Royal Megansett Nursing Home

Nursing Home
Overview of Royal Megansett Nursing Home

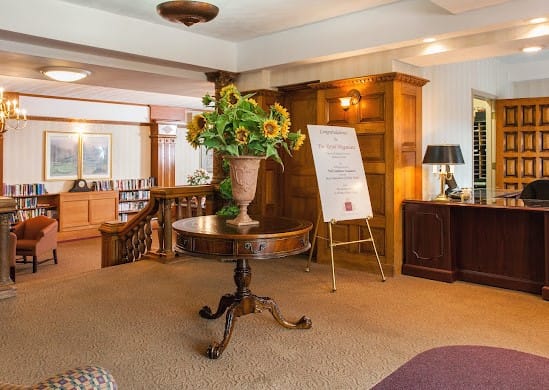
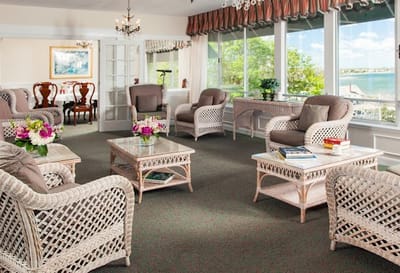
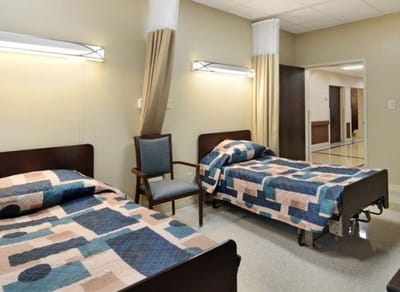
Based in North Falmouth, MA, Royal Megansett Nursing Home is a renowned senior living community that offers exceptional skilled nursing and rehabilitation services. Boasting 28 excellently designed private rooms, the community warrants for a truly personalized care and focused attention to its residents. Residents enjoy relaxing views and compassionate assistance from a team of highly-skilled care professionals available 24 hours a day and 7 days a week.

With a strong dedication to nurturing its residents’ well-being, Royal Megansett Nursing Home also provides a wide array of life-enriching activities designed based on residents’ interests and current capabilities. Residents’ nutrition is monitored and considered when preparing their meals, ensuring they always eat balanced and delicious meals. Here, residents are treated like royalties within an enriching environment that encourages them to lead a vibrant retirement life.

(508) 563-5913

Quality ratings

Measured by Centers for Medicare & Medicaid Services (CMS)

Overall rating Info Official CMS rating based on health inspections, staffing and quality measures.
4/5
Massachusetts average: 2.9/5
Health Inspection Info Official CMS rating based on deficiencies found during state health inspections.
4/5
Massachusetts average: 2.8/5
Staffing Info Official CMS rating based on nurse staffing hours per resident per day.
2/5
Massachusetts average: 3.0/5
Quality Measures Info Official CMS rating based on clinical outcomes for residents.
3/5
Massachusetts average: 3.2/5

Nursing care per resident

Info Average daily nursing hours per resident (adjusted for acuity). Higher values indicate more nursing time per resident.
3h 25m per day

This home provides 13% less nursing time per resident than the state average.

Massachusetts average: 3h 56m per day

Staffing hours breakdown

Info Hours of care per resident per day, broken down by staff type. Data from CMS Medicare.
Staff type Facility State avg National avg
Registered Nurse (RN) Info Registered nurse hours per resident per day. 39m per day 39m per day 41m per day
LPN / LVN Info Licensed Practical Nurse / Licensed Vocational Nurse hours per resident per day. 1h 5m per day 58m per day 52m per day
Nurse Aide Info Nurse aide hours per resident per day. 2h 11m per day 2h 16m per day 2h 21m per day
Total Nursing (Weekend) Info Total number of nurse staff hours per resident per day on weekends. 3h 21m per day 3h 27m per day 3h 26m per day
Physical Therapist Info Physical therapist staff hours per resident per day. 3m per day 4m per day 4m per day
RN (Weekend) Info Registered nurse hours per resident per day on weekends. 26m per day 28m per day 29m per day

Capacity and availability

Smaller home

May offer a more intimate, personalized care environment.

Total beds 87

This home usually has availability

Lower occupancy suggests more openings may be available.

Lower demand than the Massachusetts average
Occupancy rate 80.9%
Residents per day (avg) 67
Occupancy rate
80.9%
Residents per day (avg)
67

Who this home usually serves

TYPE OF STAY

Mostly short-term rehab stays

Most residents typically stay for a few weeks or months before returning home or moving on.

Might be optimal for
Short stays Recovery Medicare-covered care

Breakdown by payment type

Medicare

61% of new residents, usually for short-term rehab.

Typical stay 1 months

Private pay

32% of new residents, often for short stays.

Typical stay 3 - 4 months

Medicaid

7% of new residents, often for long-term daily care.

Typical stay 2 - 3 years

Finances and operations

Proprietary home
Partnership
Home revenue
$11.8M
Profit
$647.6K
Proprietary home Partnership
Home revenue
$11,790,024.00
Profit
$647,624.00
Payroll costs Info The portion of the home's budget spent on staff, including nurses, caregivers, and other employees who support care and operations.
$4.1M
34.8% of revenue
Other operating costs Info All remaining costs needed to run the home, such as food, utilities, building maintenance, supplies and administrative expenses.
$7.0M
Total costs $11.1M

What does this home offer?

Accepts Medicaid icon

Accept Medicaid: Accept Medicaid

Total residents icon

Total Residents: 90 Residents

Housing options icon

Housing Options: Studio / 1 Bed / 2 Bed

Building type icon
Building type icon

Building Type: Mid-rise Building

Types of Care at Royal Megansett Nursing Home

Nursing Home
Contact Royal Megansett Nursing Home

Compare Nursing Homes around Falmouth

The information below is reported by the Massachusetts Executive Office of Elder Affairs and Department of Public Health.
Royal Megansett Nursing Home
AL

Assisted Living For seniors needing help with daily tasks but not full-time nursing.

IL

Independent Living For self-sufficient seniors seeking community and minimal assistance.

MC

Memory Care Specialized care for those with Memory Loss, Alzheimer's, or dementia, ensuring safety and support.

SNF

Nursing Homes 24/7 care needed

North Falmouth (North Falmouth)
87
No
37
80.9%
$11,519,348.00
$4,104,066.00
35.6%
66.70
4/5
3.4208
4/5
2/5
3/5
1
23
-21%
-13%
-1%
Studio / 1 Bed / 2 Bed

Places of interest near Royal Megansett Nursing Home

Address 1.0 miles from city center

Address 209 County Rd, North Falmouth, MA 02556

Calculate Travel Distance to Royal Megansett Nursing Home

Add your location

Address

Staffing Data

Source: CMS Payroll-Based Journal (Q2 2025)

176
Total Staff
106
Employees
70
Contractors
28,767
Total Hours (Quarter)
46
Avg Staff/Day
6.9
Avg Shift (hrs)
Nursing Staff Breakdown
Role Count Avg Shift (hrs) Uses Contractors?
Registered Nurse187.9 Yes
Licensed Practical Nurse318.1 Yes
Certified Nursing Assistant687.9 Yes
Staff by Category
Administration
2 staff
7hs shift avg
Nursing Staff
137 staff
7.4hs shift avg
Physicians & Practitioners
10 staff
3.6hs shift avg
Therapy Services
17 staff
6.6hs shift avg
Activities & Recreation
0 staff
0hs shift avg
Social Services
2 staff
2hs shift avg
Dietary Services
7 staff
6.7hs shift avg
Other Services
1 staff
9.9hs shift avg
Contractor Analysis
15.5%
of total hours from contractors
4,452 contractor hours this quarter
Certified Nursing Assistant: 31 Licensed Practical Nurse: 12 Registered Nurse: 6 Physical Therapy Assistant: 3 Physical Therapy Aide: 3 Speech Language Pathologist: 4 Respiratory Therapy Technician: 6 Qualified Social Worker: 2 Other Physician: 1 Occupational Therapy Assistant: 1 Medical Director: 1
Role Employees Contractors Total Staff Total Hours Days Worked % of Days Avg Shift (hrs)
Certified Nursing Assistant37316810,10191100%7.9
Licensed Practical Nurse1912314,73791100%8.1
Nurse Aide in Training120123,32091100%7.8
Registered Nurse126182,5578998%7.9
RN Director of Nursing8081,5617684%4.2
Other Dietary Services Staff6061,5609099%6.4
Clinical Nurse Specialist8088628593%2.8
Speech Language Pathologist0447598088%6.3
Nurse Practitioner1015136470%8
Mental Health Service Worker1015055156%9.9
Dietitian1015026470%7.8
Administrator1014886167%8
Physical Therapy Assistant0334866268%7.8
Physical Therapy Aide0333484651%7.6
Respiratory Therapy Technician0662274448%4.9
Qualified Social Worker0221236167%2
Medical Director011581719%3.4
Occupational Therapy Assistant0113567%5.8
Other Physician011271314%2

Health Inspection History

Inspections
Total health inspections 3

Massachusetts average 4.5


Last Health inspection on Apr 2025

Total health citations 23
Citations per inspection
7.67

Health citations are formal notices following inspections when they fail to comply with safety and care standards.

All 23 citations resulted from standard inspections.

Breakdown of citation severity (last 3 years)
Critical Health citations More info 0
100% better than Massachusetts average

Massachusetts average: 0.3


Serious Health citations More info 0
100% better than Massachusetts average

Massachusetts average: 1.5

0 critical citations More info Massachusetts average: 0.3

0 serious citations More info Massachusetts average: 1.5

21 moderate citations More info Massachusetts average: 29.7

2 minor citations More info Massachusetts average: 1.3
Citations history (last 3 years)
Nursing Services minor citation Apr 08, 2025
Corrected

Quality of Care moderate citation Apr 08, 2025
Corrected

Quality of Care moderate citation Apr 08, 2025
Corrected

Care Planning moderate citation Apr 08, 2025
Corrected

Facility Characteristics

Source: CMS Long-Term Care Facility Characteristics (Data as of Jan 2026)

Ownership: For-Profit Partnership
Part of: Royal Health Group
Resident Census by Payment Source
68 Total Residents
Medicare 13 (19.1%)
Medicaid 31 (45.6%)
Private Pay/Other 24 (35.3%)
Programs & Services
Residents' Group
Family Engagement

Active councils help families stay involved in care decisions and facility operations.

Quality of care over time

These measures show how residents usually do over time at this home, based on health outcomes and preventive care.

High-risk clinical events score Info A composite score based on pressure ulcers, falls with injury, weight loss, walking ability decline, and activities of daily living decline. 11.2
10% worse than Massachusetts average

Massachusetts average: 10.2

Functional decline score Info A composite score based on activities of daily living decline, walking ability decline, and incontinence. 23.5
18% worse than Massachusetts average

Massachusetts average: 20.0

Long-stay resident measures
Need for Help with Daily Activities Increased Info Percent of long-stay residents whose need for help with daily activities has increased 21.6%
16% worse than Massachusetts average

Massachusetts average: 18.7%

Walking Ability Worsened Info Percent of long-stay residents whose ability to move independently worsened 19.4%
In line with Massachusetts average

Massachusetts average: 19.3%

Low Risk Residents with Bowel/Bladder Incontinence Info Percent of low risk long-stay residents who lose control of their bowels or bladder 29.5%
34% worse than Massachusetts average

Massachusetts average: 22.1%

Falls with Major Injury Info Percent of long-stay residents experiencing one or more falls with major injury 4.5%
25% worse than Massachusetts average

Massachusetts average: 3.6%

High Risk Residents with Pressure Ulcers Info Percent of long-stay high risk residents with pressure ulcers 1.3%
71% better than Massachusetts average

Massachusetts average: 4.7%

Urinary Tract Infection Info Percent of long-stay residents with a urinary tract infection 1.0%
50% better than Massachusetts average

Massachusetts average: 2.1%

Lost Too Much Weight Info Percent of long-stay residents who lose too much weight 9.2%
77% worse than Massachusetts average

Massachusetts average: 5.2%

Depressive Symptoms Info Percent of long-stay residents who have depressive symptoms 16.9%
58% worse than Massachusetts average

Massachusetts average: 10.7%

Antipsychotic Use Info Percent of long-stay residents who received an antipsychotic medication 19.3%
5% better than Massachusetts average

Massachusetts average: 20.3%

Pneumococcal Vaccine Info Percent of long-stay residents assessed and appropriately given the pneumococcal vaccine 99.5%
8% better than Massachusetts average

Massachusetts average: 91.9%

Influenza Vaccine Info Percent of long-stay residents assessed and appropriately given the seasonal influenza vaccine 96.1%
In line with Massachusetts average

Massachusetts average: 94.8%

Hospitalizations per 1,000 days Info Number of hospitalizations per 1,000 long-stay resident days. 1.97
6% worse than Massachusetts average

Massachusetts average: 1.86

ED visits per 1,000 days Info Number of outpatient emergency department visits per 1,000 long-stay resident days. 1.51
In line with Massachusetts average

Massachusetts average: 1.54

Short-stay resident measures
Pneumococcal Vaccine Info Percent of short-stay residents assessed and appropriately given the pneumococcal vaccine 88.4%
15% better than Massachusetts average

Massachusetts average: 76.7%

Antipsychotic medication increase Info Percent of short-stay residents who newly received an antipsychotic medication 0.6%
53% better than Massachusetts average

Massachusetts average: 1.3%

Influenza Vaccine Info Percent of short-stay residents assessed and appropriately given the seasonal influenza vaccine 87.5%
13% better than Massachusetts average

Massachusetts average: 77.7%

Re-hospitalized after SNF stay Info Percentage of short-stay residents who were re-hospitalized after their nursing home admission. 24.7%
In line with Massachusetts average

Massachusetts average: 25.8%

Emergency department visits Info Percentage of short-stay residents who had an outpatient emergency department visit. 12.4%
5% worse than Massachusetts average

Massachusetts average: 11.8%

Falls with major injury Info Percentage of SNF residents who experience falls with major injury during their stay. 0.0%
100% better than Massachusetts average

Massachusetts average: 0.8%

Ability to care for self at discharge Info Percentage of residents at or above expected ability to care for themselves at discharge. 52.6%
In line with Massachusetts average

Massachusetts average: 53.7%

Successful return to home or community Info Rate of successful return to home or community from a skilled nursing facility. 66.6%
32% better than Massachusetts average

Massachusetts average: 50.6%

Penalties and fines

Federal penalties imposed by CMS for regulatory violations, including civil money penalties (fines) and denials of payment for new Medicare/Medicaid admissions.

Source: CMS Penalties Database (Data as of Jan 2026)

Total fines amount $3K
95% lower than Massachusetts average

Massachusetts average: $72K

Number of fines 1
42% fewer fines than Massachusetts average

Massachusetts average: 1.7

Payment Denials Info Serious action where Medicare and/or Medicaid temporarily stops payments for new residents until issues are fixed. 0
100% fewer payment denials than Massachusetts average

Massachusetts average: 0.1

Fines amount comparison
This facility $3K
Massachusetts average $72K
Penalty History

Penalties are imposed by CMS for violations of federal nursing home regulations.

Civil Money Penalty Info Fines imposed for noncompliance, which can be assessed per day or per instance of violation. Jan 27, 2023
$3K

Last updated: Jan 2026

Guides for Better Senior Living

Care Cost Calculator: See Prices in Your Area

Nursing Home Data Explorer

Don’t Wait Too Long: 7 Red Flag Signs Your Parent Needs Assisted Living Now

The True Cost of Assisted Living in 2025 – And How Families Are Paying For It

Understanding Senior Living Costs: Pricing Models, Discounts & Financial Assistance

Financial Aid for Massachusetts Seniors

Get financial aid guidance

Home Care Program

MassHealth Home Care

Age 60+, Massachusetts resident, at risk of nursing home placement.

~$1,500/month (individual, varies by region).

$2,000 (individual, excludes home, car).

Coordinated through Aging Services Access Points (ASAPs); high demand in urban areas.

Frail Elder Waiver

Massachusetts Medicaid FE Waiver

Age 65+, Massachusetts resident, Medicaid-eligible, nursing home-level care need.

~$2,829/month (300% FBR, individual).

$2,000 (individual), $3,000 (couple).

Requires clinical eligibility determination.

Senior Care Options (SCO)

Massachusetts Senior Care Options

Age 65+, Massachusetts resident, eligible for MassHealth (Medicare optional), nursing home-level care need.

~$2,829/month (300% FBR, individual); QIT allowed.

$2,000 (individual), $3,000 (couple) (excludes home up to $713,000, car).

Not available in Dukes/Nantucket Counties; multiple SCO providers (e.g., CCA, Tufts).

Medicare Savings Program (MSP)

Massachusetts Medicare Savings Program (MassHealth Buy-In)

Age 65+ or disabled, Massachusetts resident, Medicare Part A/B.

~$2,510/month (QMB), ~$3,380/month (SLMB), ~$3,598/month (QI)—individual.

$9,430 (individual), $14,130 (couple).

Three tiers; no waitlist; includes Extra Help for Part D.

National Family Caregiver Support Program (NFCSP) Respite

Massachusetts NFCSP Respite Care

Caregivers of 60+ needing care or 55+ caregivers of others; Massachusetts resident; functional needs (2+ ADLs).

Prioritizes ~$24,980/year (individual); no strict cap.

Not assessed; need-based.

27 ASAPs; prioritizes low-income, rural caregivers.

Prescription Advantage

Massachusetts Prescription Advantage

Age 65+ or disabled, Massachusetts resident, enrolled in Medicare Part D (or ineligible for Medicare).

No strict limit; copays vary by income (~$24,980-$75,000/year individual).

Not assessed.

Supplements Medicare Part D; no enrollment fee for low-income.

Senior Community Service Employment Program (SCSEP)

Massachusetts SCSEP

Age 55+, unemployed, low-income, Massachusetts resident.

~$1,983/month (125% FPL).

Not specified; income-focused.

Priority for veterans, rural residents; AARP partnership.

VA Aid and Attendance (A&A) and Housebound Benefits

Massachusetts VA Aid and Attendance/Housebound

Age 65+ or disabled veteran/spouse, Massachusetts resident, wartime service, need for ADL help (A&A) or homebound.

Net income < ~$1,984/month (veteran with dependent, A&A); pension offsets income.

~$155,356 (net worth limit).

High veteran demand statewide.

Who we are

Your Senior Care Partner, Every Step of the Way

We help families find affordable senior communities and unlock same day discounts, Medicaid, and Medicare options tailored to your needs.

Contact us Today
Tour Icon
Planning a tour? Check our touring checklist.
Chat Icon
Thinking of living here? We can help you speak to a current resident