Lynwood Manor
Nursing Home, Nursing Care & Respite Care · Adrian, MI
CMS overall rating Info CMS (the Centers for Medicare & Medicaid Services) is the federal agency that rates nursing home quality. Its Overall Rating runs from 1 to 5 stars, combining health inspections, staffing, and quality measures, with inspections weighted most heavily.

Lynwood Manor

Nursing Home, Nursing Care & Respite Care · Adrian, MI
CMS overall rating Info CMS (the Centers for Medicare & Medicaid Services) is the federal agency that rates nursing home quality. Its Overall Rating runs from 1 to 5 stars, combining health inspections, staffing, and quality measures, with inspections weighted most heavily.
Calculator: See prices in your area
Lynwood Manor accepts Medicare, Medicaid, and private pay.

Overview of Lynwood Manor

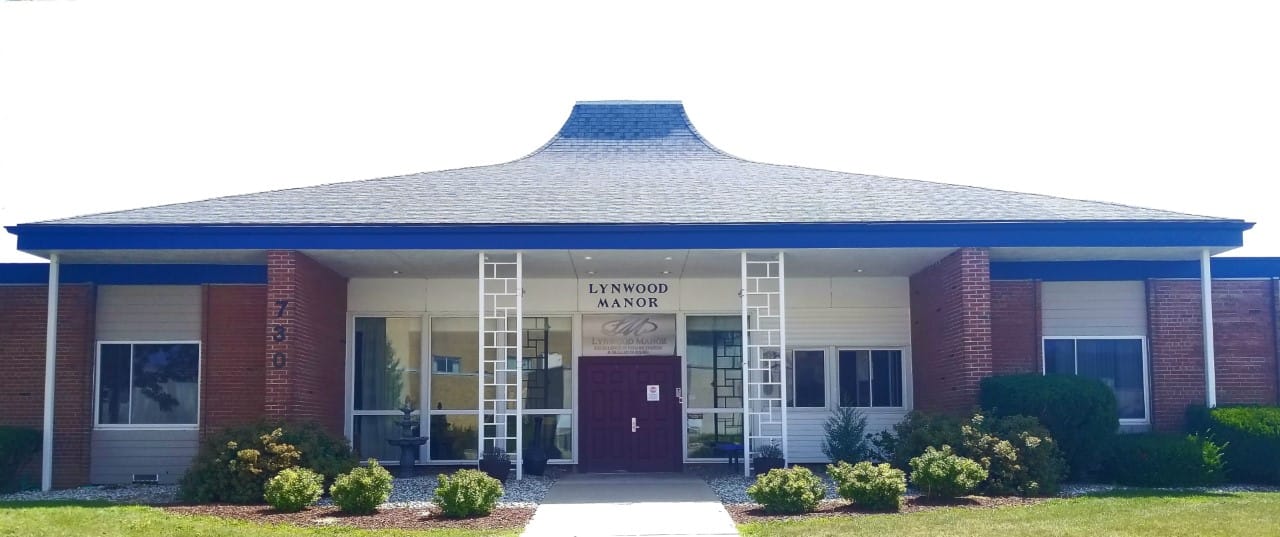
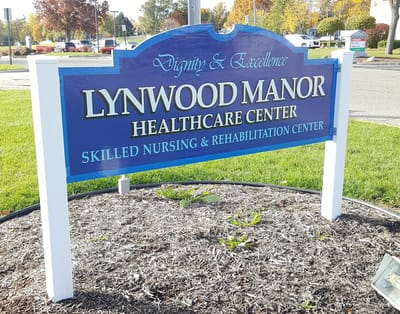
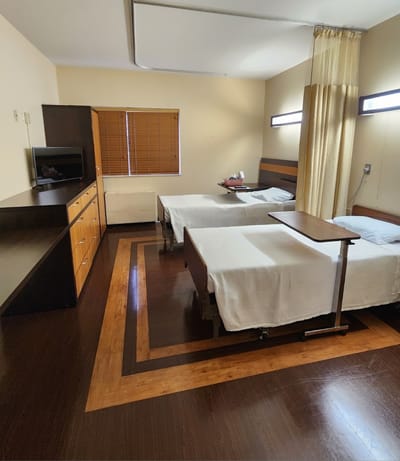
Conveniently located in the tranquil setting of Adrian, MI, Lynwood Manor is a vibrant senior living community that provides compassionate care for seniors, specializing in short-term care, skilled nursing, rehabilitation, and long-term care services. Offering a variety of living options, including private and semi-private suites, the community provides a comfortable and welcoming environment for residents. The Rehab to Home program, overseen by experienced medical professionals, ensures personalized recovery plans tailored to each resident’s needs.

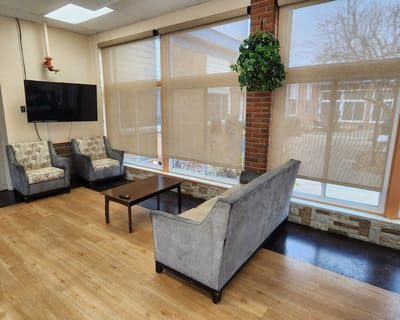
Focusing on engagement and well-being, the community offers a robust calendar filled with activities such as music concerts, bingo, and seasonal parties. The team ensures that every resident enjoys home-cooked meals, housekeeping services, and a variety of recreational opportunities. Residents can also relax in the beautifully remodeled rehabilitation wing or take part in outings, enhancing their quality of life. Lynwood Manor is committed to providing a supportive, enjoyable environment where every resident can thrive.

Quality ratings

Measured by Centers for Medicare & Medicaid Services (CMS)

Overall rating Info The Overall CMS Rating combines results from health inspections, staffing levels and quality measures. Health inspections carry the most weight. Staffing and quality scores can increase or decrease the final rating based on performance compared to state and national standards.
▼ 4.4% Below MI avg. ▼ 4.4% Below MI avg.MI average: 3.1Click the badge to see the full State ranking.Click here to see the full State ranking.
Health Inspection Info Based on the results of the facility's three most recent standard inspections and any complaint investigations. CMS reviews the number, scope, and severity of deficiencies, with more recent findings weighted more heavily.
▲ 6.1% Above MI avg. ▲ 6.1% Above MI avg.MI average: 2.8Click the badge to see the full State ranking.Click here to see the full State ranking.
Staffing Info Measures average nursing staff hours per resident per day, including Registered Nurses (RNs) and total nursing staff. Ratings are adjusted based on the level of care residents require and are compared to state and national benchmarks.
▲ 14.4% Above MI avg. ▲ 14.4% Above MI avg.MI average: 3.5Click the badge to see the full State ranking.Click here to see the full State ranking.
Quality Measures Info Based on clinical and physical health indicators reported to CMS, such as hospital readmissions, falls, pressure ulcers, and improvements in mobility. These measures reflect how well residents' health needs are being managed.
▼ 20.2% Below MI avg. ▼ 20.2% Below MI avg.MI average: 3.8Click the badge to see the full State ranking.Click here to see the full State ranking.

Staffing hours breakdown

Info Daily nursing hours per resident by staff type, reported to CMS. Higher is generally better — compare this facility to state and national averages to see where staffing stands.

Hours per resident per day — compared to Michigan state averages

Total nursing care / resident Info This home is ranked 117th out of 142 homes in Michigan for nurse hours. Total adjusted nursing hours per resident per day, combining RN, LPN, and aide time. CMS adjusts this for case-mix so facilities can be fairly compared.
3h 37m per day
Rank #117 / 142Nurse hours — State benchmarkedThis home is ranked 117th out of 142 homes in Michigan. Shows adjusted nurse hours per resident per day benchmarked to the Michigan average, with a ranking across 142 Michigan facilities. More hours mean more direct care. The national average is about 3.5 hrs; below 3.0 is a red flag.Rankings are based only on facilities in Michigan that report data for that category. Facilities without available data are excluded from the ranking.Click the rank badge to see the full State ranking.Click here to see the full State ranking.
This facility Michigan avg (4h 18m per day)
vs Michigan avg
-16%

6 of 6 metrics below state avg

Staff typeHours / Day / Residentvs state avg
Registered Nurse (RN) Info RNs hold the highest nursing license and can assess residents, interpret test results, and direct care plans. More RN hours per day often signals stronger clinical oversight and faster response to health changes. 29m per day ▼ 36% State avg: 46m per day · National avg: 41m per day
LPN / LVN Info Licensed Practical Nurses (LPNs) or Licensed Vocational Nurses (LVNs) deliver routine hands-on care — medication administration, wound dressing, and monitoring vital signs. They work under RN supervision and make up a large share of daily bedside care. 48m per day ▼ 10% State avg: 53m per day · National avg: 52m per day
Nurse Aide Info Certified Nurse Aides (CNAs) provide the most direct day-to-day assistance: bathing, dressing, feeding, and mobility. Nurse aide hours are typically the largest staffing category and directly affect residents' quality of life. 2h 2m per day ▼ 15% State avg: 2h 23m per day · National avg: 2h 21m per day
Weekend Total Nursing Info Combined nursing hours (RN + LPN + Nurse Aide) per resident per day on weekends. Staffing often drops on weekends — this figure reveals whether the facility maintains adequate coverage outside of weekday hours. 2h 55m per day ▼ 17% State avg: 3h 31m per day · National avg: 3h 26m per day
Physical Therapist Info Hours per resident per day provided by licensed Physical Therapists (PTs) or PT Assistants. PT services help residents recover mobility after injury or illness and are especially important for post-acute (short-stay) rehabilitation. 2m per day ▼ 44% State avg: 4m per day · National avg: 4m per day
Weekend RN Info Registered nurse hours specifically on weekends. Facilities sometimes reduce RN presence on Saturdays and Sundays — a low weekend RN figure compared to weekday hours can indicate reduced clinical oversight when most administrative staff are absent. 23m per day ▼ 20% State avg: 29m per day · National avg: 29m per day

Capacity and availability

This home usually has availability

Higher occupancy than the Michigan average: 75.8%
Occupancy rate
77.4% Rank #94 / 395Occupancy rate — State benchmarkedThis home is ranked 94th out of 395 homes in Michigan. Shows this facility's occupancy rate versus the Michigan average, with its Statewide rank out of 395. Higher occupancy signals strong local demand and financial stability.Rankings are based only on facilities in Michigan that report data for that category. Facilities without available data are excluded from the ranking.Click the rank badge to see the full State ranking.Click here to see the full State ranking.
Avg. Length of Stay
141 days
Bed community size
84-bed community Rank #175 / 435Bed count — State benchmarkedThis home is ranked 175th out of 435 homes in Michigan. Shows this facility's certified or reported bed count compared to other Michigan facilities. Larger communities may offer more amenities, programs, and on-site services for residents and families.Rankings are based only on facilities in Michigan that report data for that category. Facilities without available data are excluded from the ranking.Click the rank badge to see the full State ranking.Click here to see the full State ranking.
A larger shared setting that may offer more common spaces and organized community services.
Years in operation
15 years in operation Rank #114 / 182Years in operation — State benchmarkedThis home is ranked 114th out of 182 homes in Michigan. Shows how long this facility has been in operation compared to other Michigan facilities. Longer operating histories may benefit residents, families, and staff.Rankings are based only on facilities in Michigan that report data for that category. Facilities without available data are excluded from the ranking.Click the rank badge to see the full State ranking.Click here to see the full State ranking.
A community with a solid operating history and experience delivering ongoing care.
Walk Score
Walk Score: 12 / 100 Rank #594 / 703Walk Score — State benchmarkedThis home is ranked 594th out of 703 homes in Michigan. Shows how walkable this facility's neighborhood is compared to the average Walk Score across Michigan facilities. Higher scores benefit residents, families, and staff.Rankings are based only on facilities in Michigan that report data for that category. Facilities without available data are excluded from the ranking.Click the rank badge to see the full State ranking.Click here to see the full State ranking.
Car-dependent. Most errands require a car, with limited nearby walkable options.
BBB Rating
BBB Rating: A+ (Not Accredited)
An independent rating from the Better Business Bureau based on factors such as complaint history, transparency, and business practices.
How BBB ratings work

Staffing

Key information about the people who lead and staff this community.

Leadership

ContactMs. Jonna Schmidt, Medical Director

Staff Composition

Total Employees
3
Full-Time Employees
3

Contact Lynwood Manor

Inspection History

In Michigan, the Department of Licensing and Regulatory Affairs (LARA) conducts unannounced inspections and investigations to ensure long-term care facilities comply with state health codes.

Since 2023 · 3 years of data 42 deficiencies

Inspection Scorecard Info This scorecard compares key inspection, deficiency, and complaint metrics at this facility against the Michigan state average. Metrics rated ≥15% worse than average are highlighted in red; those ≥15% better are highlighted in green.

Since 2023 vs. Michigan state average
Overall vs. MI average 2 Worse Metrics worse than Michigan average:
• Total deficiencies (425% above)
• Deficiencies per year (419% above)
0 Better No metrics in this bucket.
Latest Inspection June 4, 2025 Routine

Deficiencies Info Deficiencies are formal regulatory issues recorded during state inspections.

This FacilityMI Averagevs. MI Avg
Total deficiencies Info Formal regulatory issues recorded by inspectors across all inspection types. 428 This facility has 425% more total deficiencies than a typical Michigan nursing home (42 vs. MI avg 8).↑ 425% worse
Deficiencies per year Info Average deficiencies per year since 2023. 142.7 This facility has 419% more deficiencies per year than a typical Michigan nursing home (14 vs. MI avg 2.7).↑ 419% worse

Inspection Reports Summary Info An editor-reviewed summary of the themes and findings across this facility's recent inspection reports.

  • June 4, 2025 routine inspection found 5 deficiencies including psychotropic medication overuse, incomplete care plans, poor hospice coordination, unsecured smoking materials, and unsanitary food service equipment.
  • July 12, 2024 complaint investigation revealed 15 deficiencies including immediate jeopardy from hot liquid burns, unsafe smoking assessments, medication errors, poor wound care, and failure to maintain physical plant and food safety.
  • February 15, 2024 routine inspection had 3 deficiencies related to safety assessments, weight monitoring, and dialysis communication, with no immediate jeopardy or complaints substantiated.

Health Inspection History

Inspections since 2023
Total health inspections 6

Michigan average 6.5


Last Health inspection on Jun 2025

Total health citations
40 Rank #96 / 144Health citations — State benchmarkedThis home is ranked 96th out of 144 homes in Michigan. Shows this facility's total health deficiency citations benchmarked to the Michigan State average, with a ranking across all 144 MI facilities. Lower citation counts earn a better rank.Rankings are based only on facilities in Michigan that report data for that category. Facilities without available data are excluded from the ranking.Click the rank badge to see the full State ranking.Click here to see the full State ranking.

Michigan average 33.5

Citations per inspection
6.67 Rank #104 / 144Citations per inspection — State benchmarkedThis home is ranked 104th out of 144 homes in Michigan. Shows average deficiency citations per CMS inspection for this facility versus the Michigan mean across 144 facilities with citation data. Lower is better.Rankings are based only on facilities in Michigan that report data for that category. Facilities without available data are excluded from the ranking.Click the rank badge to see the full State ranking.Click here to see the full State ranking.

Michigan average 5.18


Health citations are formal notices following inspections when they fail to comply with safety and care standards.

29 of 40 citations resulted from standard inspections; 10 of 40 resulted from complaint investigations; and 1 of 40 came from combined inspections (standard and complaint).

Breakdown of citation severity (last 3 years)
Critical health citations
1
233% worse than Michigan average

Michigan average: 0.3


Serious health citations
0
100% better than Michigan average

Michigan average: 1.9

1 critical citation Michigan average: 0.3

0 serious citations Michigan average: 1.9

39 moderate citations Michigan average: 30.8

0 minor citations Michigan average: 0.5
Citations history (last 3 years)
Abuse/Neglect moderate citation Jun 04, 2025
Corrected

Nutrition moderate citation Jun 04, 2025
Corrected

Pharmacy moderate citation Jun 04, 2025
Corrected

Quality of Care moderate citation Jun 04, 2025
Corrected

Staffing Data

Reporting period: October 1 – December 31, 2025 (Q4 2025). Source: CMS Payroll-Based Journal report.

Total staff 103
Employees 66
Contractors 37
Staff to resident ratio 1.45 : 1
15% fewer staff per resident than Michigan average
Michigan average ratio: 1.70 : 1 Michigan average ratio: 1.70 : 1See full Michigan ranking
Avg staff/day 34
Average shift 8.2 hours
0% compared with Michigan average
Michigan average: 7.9 hours Michigan average shift: 7.9 hoursSee full Michigan ranking
Total staff hours (quarter) 25,750

Nursing staff breakdown

Q4 2025 · Oct 1 – Dec 31 More info This data comes from the CMS Payroll-Based Journal report covering October 1 – December 31, 2025.
Registered Nurse

Manages medical care and health needs.

RN Staff Info 11 total: 7 full-time employees and 4 contractors. 11
Average shift length Info Average shift length. Calculated as total hours divided by days worked and average staff per day. 8.6 hours
Licensed Practical Nurse

Assists with medical care and medications.

LPN Staff Info 24 total: 12 full-time employees and 12 contractors. 24
Average shift length Info Average shift length. Calculated as total hours divided by days worked and average staff per day. 8.5 hours
Certified Nursing Assistant

Helps with daily care and mobility.

CNA Staff Info 44 total: 37 full-time employees and 7 contractors. 44
Average shift length Info Average shift length. Calculated as total hours divided by days worked and average staff per day. 8.9 hours

Contractor staffing

Q4 2025 · Oct 1 – Dec 31 More info This data comes from the CMS Payroll-Based Journal report covering October 1 – December 31, 2025.

Total hours from contractors

11.1%

2,853 contractor hours this quarter

Licensed Practical Nurse: 12 Certified Nursing Assistant: 7 Physical Therapy Assistant: 4 Registered Nurse: 4 Qualified Social Worker: 3 Respiratory Therapy Technician: 3 Speech Language Pathologist: 2 Medical Director: 1 Occupational Therapy Assistant: 1

Staff by category

Q4 2025 · Oct 1 – Dec 31 More info This data comes from the CMS Payroll-Based Journal report covering October 1 – December 31, 2025.
Certified Nursing Assistant3774413,11792100%8.9
Licensed Practical Nurse1212245,13592100%8.5
Registered Nurse74112,19992100%8.6
Other Dietary Services Staff3031,1358896%7.8
Physical Therapy Assistant0446477683%5.2
Speech Language Pathologist0226307076%6
Clinical Nurse Specialist2025605459%7.5
Dietitian1014855863%8.4
Mental Health Service Worker1014435964%7.5
Administrator1014055459%7.5
Nurse Practitioner1013985358%7.5
Respiratory Therapy Technician0332404549%4.7
Occupational Therapy Aide1012166267%3.5
Qualified Social Worker033963740%2.6
Occupational Therapy Assistant0112455%4.8
Medical Director011221415%1.5
44 Certified Nursing Assistant
% of Days 100%
24 Licensed Practical Nurse
% of Days 100%
11 Registered Nurse
% of Days 100%
3 Other Dietary Services Staff
% of Days 96%
4 Physical Therapy Assistant
% of Days 83%
2 Speech Language Pathologist
% of Days 76%
2 Clinical Nurse Specialist
% of Days 59%
1 Dietitian
% of Days 63%
1 Mental Health Service Worker
% of Days 64%
1 Administrator
% of Days 59%
1 Nurse Practitioner
% of Days 58%
3 Respiratory Therapy Technician
% of Days 49%
1 Occupational Therapy Aide
% of Days 67%
3 Qualified Social Worker
% of Days 40%
1 Occupational Therapy Assistant
% of Days 5%
1 Medical Director
% of Days 15%

Penalties and fines

Includes penalties issued in 2024

Federal penalties imposed by CMS for regulatory violations, including civil money penalties (fines) and denials of payment for new Medicare/Medicaid admissions.

Source: CMS Penalties Database (Data as of Jan 2026)

Total fines amount $24K Rank #100 / 145Federal fines — State benchmarkedThis home is ranked 100th out of 145 homes in Michigan. Shows this facility's cumulative CMS federal fine dollars versus the Michigan average among facilities with fines, and where it ranks among 145 facilities in the pool. Lower total dollars mean a better rank.Rankings are based only on facilities in Michigan that report data for that category. Facilities without available data are excluded from the ranking.Click the rank badge to see the full State ranking.Click here to see the full State ranking.
69% lower than Michigan average

Michigan average: $76K

Number of fines 1
51% fewer fines than Michigan average

Michigan average: 2.0

Payment Denials Info Serious action where Medicare and/or Medicaid temporarily stops payments for new residents until issues are fixed. 0
100% fewer payment denials than Michigan average

Michigan average: 0.8

Fines amount comparison
This facility $24K
Michigan average $76K
Penalty History

Penalties are imposed by CMS for violations of federal nursing home regulations.

1 penalty in the past 3 years

Jul 12, 2024 · $24K

Civil Money Penalty Info Fines imposed for noncompliance, which can be assessed per day or per instance of violation. Jul 12, 2024
$24K

Last updated: Jan 2026

Quality of care over time

These measures show how residents usually do over time at this home, based on health outcomes and preventive care.

High-risk clinical events score Info A composite score based on pressure ulcers, falls with injury, weight loss, walking ability decline, and activities of daily living decline. 7.9
6% better than Michigan average

Michigan average: 8.4

Functional decline score Info A composite score based on activities of daily living decline, walking ability decline, and incontinence. 16.3
In line with Michigan average

Michigan average: 16.3

Long-stay resident measures
Above average Michigan avg: 4.1 Info CMS star rating based on long-stay quality measure performance. 5 stars = significantly above average, 1 star = significantly below average.
Need for Help with Daily Activities Increased Info Percent of long-stay residents whose need for help with daily activities has increased 11.4%
8% better than Michigan average

Michigan average: 12.5%

Walking Ability Worsened Info Percent of long-stay residents whose ability to move independently worsened 11.9%
23% better than Michigan average

Michigan average: 15.3%

Low Risk Residents with Bowel/Bladder Incontinence Info Percent of low risk long-stay residents who lose control of their bowels or bladder 25.6%
22% worse than Michigan average

Michigan average: 21.0%

Falls with Major Injury Info Percent of long-stay residents experiencing one or more falls with major injury 1.8%
44% better than Michigan average

Michigan average: 3.2%

High Risk Residents with Pressure Ulcers Info Percent of long-stay high risk residents with pressure ulcers 9.6%
67% worse than Michigan average

Michigan average: 5.7%

Urinary Tract Infection Info Percent of long-stay residents with a urinary tract infection 0.0%
100% better than Michigan average

Michigan average: 1.7%

Lost Too Much Weight Info Percent of long-stay residents who lose too much weight 5.0%
13% better than Michigan average

Michigan average: 5.7%

Depressive Symptoms Info Percent of long-stay residents who have depressive symptoms 2.6%
34% better than Michigan average

Michigan average: 3.9%

Antipsychotic Use Info Percent of long-stay residents who received an antipsychotic medication 4.2%
72% better than Michigan average

Michigan average: 15.0%

Pneumococcal Vaccine Info Percent of long-stay residents assessed and appropriately given the pneumococcal vaccine 100.0%
5% better than Michigan average

Michigan average: 94.9%

Influenza Vaccine Info Percent of long-stay residents assessed and appropriately given the seasonal influenza vaccine 100.0%
5% better than Michigan average

Michigan average: 95.0%

Hospitalizations per 1,000 days Info Number of hospitalizations per 1,000 long-stay resident days. 2.24
29% worse than Michigan average

Michigan average: 1.74

ED visits per 1,000 days Info Number of outpatient emergency department visits per 1,000 long-stay resident days. 3.28
113% worse than Michigan average

Michigan average: 1.54

Short-stay resident measures
Significantly below average Michigan avg: 3.3 Info CMS star rating based on short-stay quality measure performance. 5 stars = much above average, 1 star = much below average.
Pneumococcal Vaccine Info Percent of short-stay residents assessed and appropriately given the pneumococcal vaccine 99.4%
20% better than Michigan average

Michigan average: 82.5%

Antipsychotic medication increase Info Percent of short-stay residents who newly received an antipsychotic medication 1.2%
17% better than Michigan average

Michigan average: 1.4%

Influenza Vaccine Info Percent of short-stay residents assessed and appropriately given the seasonal influenza vaccine 98.7%
24% better than Michigan average

Michigan average: 79.5%

Re-hospitalized after SNF stay Info Percentage of short-stay residents who were re-hospitalized after their nursing home admission. 32.8%
36% worse than Michigan average

Michigan average: 24.2%

Emergency department visits Info Percentage of short-stay residents who had an outpatient emergency department visit. 19.2%
67% worse than Michigan average

Michigan average: 11.5%

Falls with major injury Info Percentage of SNF residents who experience falls with major injury during their stay. 0.0%
100% better than Michigan average

Michigan average: 0.8%

Ability to care for self at discharge Info Percentage of residents at or above expected ability to care for themselves at discharge. 58.3%
9% better than Michigan average

Michigan average: 53.7%

Successful return to home or community Info Rate of successful return to home or community from a skilled nursing facility. 43.3%
14% worse than Michigan average

Michigan average: 50.6%

Breakdown by payment type

Medicare

55% of new residents, usually for short-term rehab.

Typical stay 1 - 2 months

Private pay

39% of new residents, often for short stays.

Typical stay 3 - 4 months

Medicaid

6% of new residents, often for long-term daily care.

Typical stay 5 years

Facility Characteristics

Source: CMS Long-Term Care Facility Characteristics (Data as of Jan 2026)

Total residents 71
Medicare
7
9.9% of residents
Medicaid
37
52.1% of residents
Private pay or other
27
38% of residents
Programs & Services
Residents Group

Residents meet regularly to discuss policies, care quality, and activities

Active Resident Council

Organized group of residents that meets regularly to discuss facility policies, quality of life, and activities.

Finances and operations

Based on CMS SNF Cost Report for fiscal year ending in 12/2023.

For-profit
Individual
Net patient revenue Info Net patient revenue — what the home actually collects for resident care, after contractual allowances, bad debt and discounts are subtracted from its gross charges (CMS cost report, Worksheet G-3). It covers resident care only; money the home earns from other sources is shown separately as "Other income."
$8.2M
Net patient income Info Net patient income: net patient revenue minus the home's total operating expenses. A positive figure means it earns more from resident care than it spends to deliver it; a negative figure means the opposite. It excludes non-operating "other income."
-$449.8K
For-profit Individual
Net patient revenue Info Net patient revenue — what the home actually collects for resident care, after contractual allowances, bad debt and discounts are subtracted from its gross charges (CMS cost report, Worksheet G-3). It covers resident care only; money the home earns from other sources is shown separately as "Other income."
$8.2M Rank #121 / 143Revenue — State benchmarkedThis home is ranked 121st out of 143 homes in Michigan. Shows this facility's annual revenue compared to the Michigan average. Higher revenue generally means more resources for staffing and capital — read alongside Payroll %.Rankings are based only on facilities in Michigan that report data for that category. Facilities without available data are excluded from the ranking.Click the rank badge to see the full State ranking.Click here to see the full State ranking.
Net patient income Info Net patient income: net patient revenue minus the home's total operating expenses. A positive figure means it earns more from resident care than it spends to deliver it; a negative figure means the opposite. It excludes non-operating "other income."
-$449.8K
Other income Info Money the home earns outside of resident care — such as investments, grants, rentals and other non-operating sources (CMS cost report, Worksheet G-3). It is tracked separately from net patient revenue: it is not part of that figure, and it is not included in net patient income.
$282.9K
Payroll costs Info Staff salaries plus wage-related costs — benefits such as payroll taxes, health insurance and retirement — from the home's own accounting records (CMS cost report, Worksheet A). Contract or agency labor is counted separately, under other operating costs. Rank #125 / 143Payroll — State benchmarkedThis home is ranked 125th out of 143 homes in Michigan. Shows total annual staff payroll benchmarked to the Michigan average. Higher payroll investment relative to peers often signals better staffing and less reliance on cheaper contract labor.Rankings are based only on facilities in Michigan that report data for that category. Facilities without available data are excluded from the ranking.Click the rank badge to see the full State ranking.Click here to see the full State ranking.
$4.3M 51.9% of net patient revenue Info Payroll as a share of revenue: staff salaries and wage-related benefits divided by net patient revenue. A higher figure means more of each revenue dollar goes to staff pay. Rank #71 / 143Payroll % — State benchmarkedThis home is ranked 71st out of 143 homes in Michigan. Shows payroll as a percentage of revenue versus the Michigan average. Well-run Michigan facilities typically land around 49–59% — the top third Statewide. Below 25% may signal understaffing or heavy agency use — read with Staffing ratings.Rankings are based only on facilities in Michigan that report data for that category. Facilities without available data are excluded from the ranking.Click the rank badge to see the full State ranking.Click here to see the full State ranking.
Other operating costs Info Everything it costs to run the home apart from payroll — food, utilities, supplies, maintenance, contract labor and administration. Calculated as total operating expense minus payroll (staff salaries and wage-related benefits).
$4.4M
Total costs Info The home's total operating expense for the year — all the costs of running it, salaries included (CMS cost report, Worksheet G-3).
$8.7M

What does this home offer?

Housing options icon

Housing Options: Private / Semi-Private Rooms

Building type icon
Building type icon

Building Type: Single-story

Who this home usually serves

TYPE OF STAY

Mostly short-term rehab stays

Most residents typically stay for a few weeks or months before returning home or moving on.

Most new residents arrive under Medicare (55% of admissions), and a typical Medicare stay runs around 1 - 2 months.

Admissions
154 total

Coverage residents most often arrive under.

Medicare 55%
Private pay 39%
Medicaid 6%
Discharges
187 total

Coverage residents most often leave under.

Medicare 57%
Private pay 35%
Medicaid 9%

Places of interest near Lynwood Manor

Address 1.7 miles from city center Info Estimated distance in miles from Adrian's city center to Lynwood Manor's address, calculated via Google Maps.

Calculate Travel Distance to Lynwood Manor

Add your location

Address

Compare Nursing Homes around Adrian

The information below is reported by the Michigan Department of Licensing and Regulatory Affairs (LARA).

3 facilities compared · CMS & MI Dept. of Health data

Lenawee Medical Care Facility
NH
NC
Adrian
113
Facility 113
MI AVG 75
Rank #97 / 435
83.5%
Facility 83.5%
MI AVG 75.8%
Rank #60 / 395
+10%
5.21
Facility 5.21
MI AVG 4.30
Rank #18 / 142
-45%+21%
$15.6k
Facility $15.6k
MI AVG $87.6k
Rank #90 / 145
15
Facility 15
MI AVG 33.5
Rank #24 / 144
2.5
Facility 2.5
MI AVG 5.2
Rank #9 / 144
3111-
22
Facility 22
MI AVG 39
Rank #508 / 703
Lenawee County
$15.9M
Facility $15.9M
MI AVG $15.8M
Rank #48 / 143
$10.8M
Facility $10.8M
MI AVG $5.6M
Rank #23 / 143
67.8%
Facility 67.8%
MI AVG 39%
Rank #31 / 143
235224
Lynwood Manor
NH
NC
RC
Adrian (Kimole Lane)
84
Facility 84
MI AVG 75
Rank #175 / 435
77.4%
Facility 77.4%
MI AVG 75.8%
Rank #94 / 395
+2%
3.62
Facility 3.62
MI AVG 4.30
Rank #117 / 142
+5%-16%
$23.8k
Facility $23.8k
MI AVG $87.6k
Rank #100 / 145
40
Facility 40
MI AVG 33.5
Rank #96 / 144
6.7
Facility 6.7
MI AVG 5.2
Rank #104 / 144
170A+
12
Facility 12
MI AVG 39
Rank #594 / 703
Crg Lynwood Holdings LLC
$8.2M
Facility $8.2M
MI AVG $15.8M
Rank #121 / 143
$4.3M
Facility $4.3M
MI AVG $5.6M
Rank #125 / 143
51.9%
Facility 51.9%
MI AVG 39%
Rank #71 / 143
235182
Adrian Bay Rehab and Nursing Center
NH
HC
MC
NC
PC
Adrian
117
Facility 117
MI AVG 75
Rank #86 / 435
63.2%
Facility 63.2%
MI AVG 75.8%
Rank #154 / 395
-17%
3.67
Facility 3.67
MI AVG 4.30
Rank #108 / 142
+7%-15%
$201.9k
Facility $201.9k
MI AVG $87.6k
Rank #141 / 145
35
Facility 35
MI AVG 33.5
Rank #82 / 144
7.0
Facility 7.0
MI AVG 5.2
Rank #108 / 144
385-
13
Facility 13
MI AVG 39
Rank #582 / 703
Springs Bay Op Holdco LLC
$4.0M
Facility $4.0M
MI AVG $15.8M
Rank #142 / 143
$2.0M
Facility $2.0M
MI AVG $5.6M
Rank #141 / 143
48.2%
Facility 48.2%
MI AVG 39%
Rank #49 / 143
235287

Financial Assistance for
Nursing Home in Michigan

Lynwood Manor is located in Adrian, Michigan.
Here are the financial assistance programs available to residents in Michigan.

Get Financial aid guidance

MI Choice Waiver

Michigan Medicaid MI Choice Waiver

Age 65+ or disabled
General Michigan resident, Medicaid- eligible, nursing home-level care need.
Income Limits (2025) ~$2,829/month 300% FBR, individual
Asset Limits $2,000 (individual), $3,000 (couple).
MI

Delivered through regional waiver agents; waitlists possible.

Benefits
Personal care (5-7 hours/day) Respite care (240 hours/year) Home modifications ($1,500 avg.) Adult day care ($65/day)

Home Help Program

Michigan Home Help

Age 65+ or disabled
General Michigan resident, Medicaid- eligible or low-income.
Income Limits ~$1,732/month individual, Medicaid threshold
Asset Limits $2,000 individual
MI

Can hire family caregivers; less intensive than waiver.

Benefits
Personal care (up to 60 hours/month) Homemaker services Respite (varies)

Program of All-Inclusive Care for the Elderly (PACE)

Michigan PACE

Age 55+
General Michigan resident, nursing home-level care need, safe with PACE support.
Income Limits (2025) ~$2,829/month (Medicaid-eligible); private pay option available.
Asset Limits $2,000 (individual), $3,000 (couple).
MI

16 PACE centers (e.g., Ingham, Wayne counties); expanding slowly.

Benefits
Personal care (5-7 hours/day) Medical care Meals Transportation Therapy Respite

Medicare Savings Program (MSP)

Michigan Medicare Savings Program

Age 65+ or disabled
General Michigan resident, Medicare Part A/B.
Income Limits (2025) ~$2,510/month (QMB), ~$3,380/month (SLMB), ~$3,598/month (QI)—individual.
Asset Limits $9,430 (individual), $14,130 (couple).
MI

Three tiers; no waitlist; includes Extra Help for Part D.

Benefits
Covers Part B premiums ($174.70/month) Deductibles ($240/year) Copays (~20%)

National Family Caregiver Support Program (NFCSP) Respite

Michigan NFCSP Respite Care

Age
General Caregivers of 60+ needing care or 55+ caregivers of others; Michigan resident; functional needs (2+ ADLs).
Income Limits (2025) Prioritizes ~$24,980/year (individual); no strict cap.
Asset Limits Not assessed; need-based.
MI

16 AAAs; prioritizes low-income, rural caregivers.

Benefits
Respite (4-6 hours/week or 5 days/year) Adult day care ($60/day) Caregiver training

VA Aid and Attendance (A&A) and Housebound Benefits

Michigan VA Aid and Attendance/Housebound

Age 65+ or disabled veteran/spouse
General Michigan resident, wartime service, need for ADL help (A&A) or homebound.
Income Limits (2025) Net income < ~$1,984/month (veteran with dependent, A&A); pension offsets income.
Asset Limits ~$155,356 net worth limit
MI

High veteran demand in urban/rural areas.

Benefits
Cash (~$1,433-$2,642/month veteran, ~$951-$1,318 spouse) for care costs

Frequently Asked Questions about Lynwood Manor

What neighborhood is Lynwood Manor in?

Lynwood Manor is in the Kimole Lane neighborhood of Adrian.

Is Lynwood Manor in a walkable area?

Lynwood Manor has a walk score of 12. Car-dependent. Most errands require a car, with limited nearby walkable options.

What is the occupancy rate at Lynwood Manor?

Lynwood Manor's occupancy is 85.9%.

Does Lynwood Manor operate as a for-profit or non-profit?

Lynwood Manor is registered as a for-profit in MI.

Are there photos of Lynwood Manor?

Yes — there are 4 photos of Lynwood Manor in the photo gallery on this page.

What is the address of Lynwood Manor?

Lynwood Manor is located at 730 Kimole Ln, Adrian, MI 49221.

What is the phone number of Lynwood Manor?

(517) 263-6771 will put you in contact with the team at Lynwood Manor.

Guides for Better Senior Living

Care Cost Calculator: See Prices in Your Area

Nursing Home Data Explorer

Don’t Wait Too Long: 7 Red Flag Signs Your Parent Needs Assisted Living Now

The True Cost of Assisted Living in 2025 – And How Families Are Paying For It

Understanding Senior Living Costs: Pricing Models, Discounts & Financial Assistance