Occupancy rate
85%
California average: 73%

We arrange tours, appointments, and even moving support so you don’t have to
Thank you for your interest!
Our team will be in touch shortly to help with next steps.
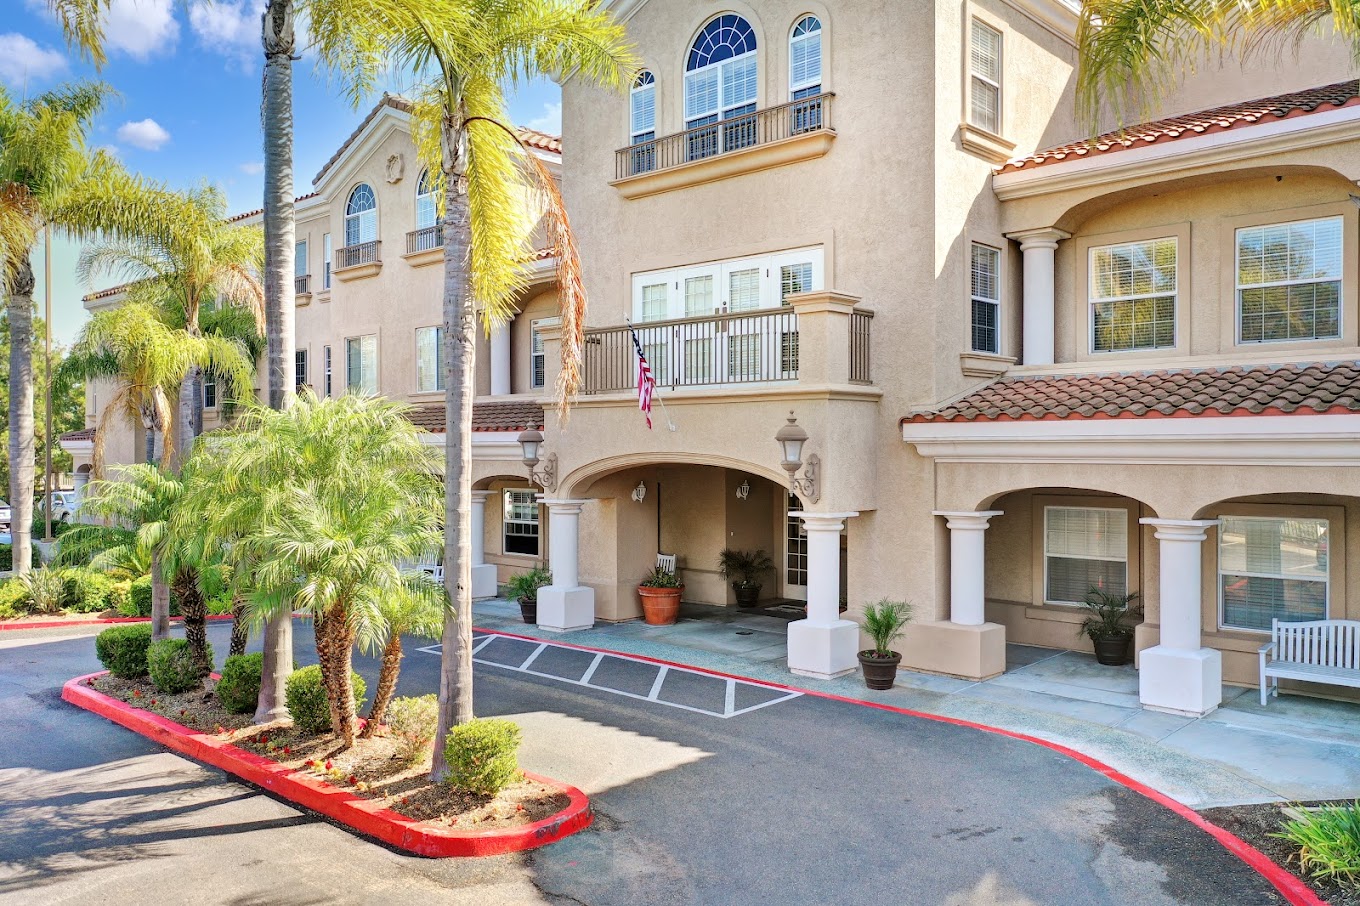

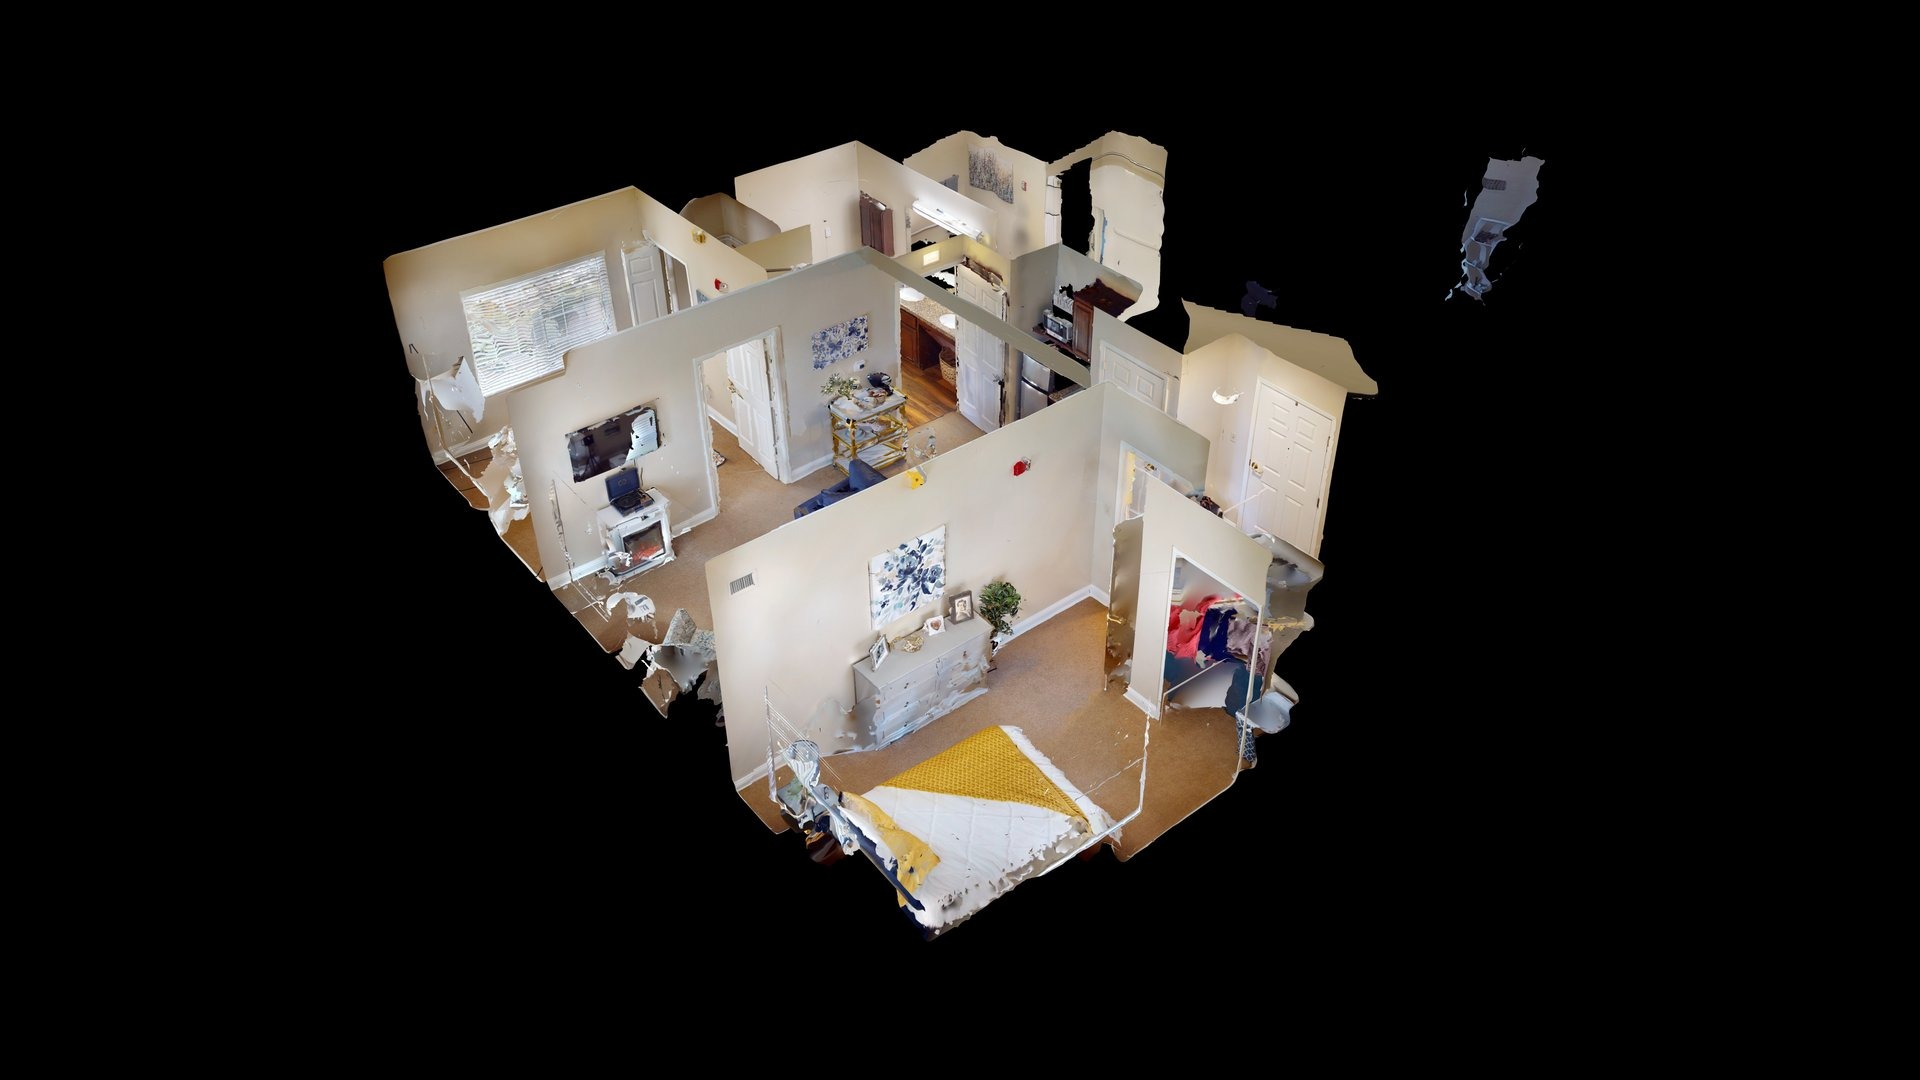

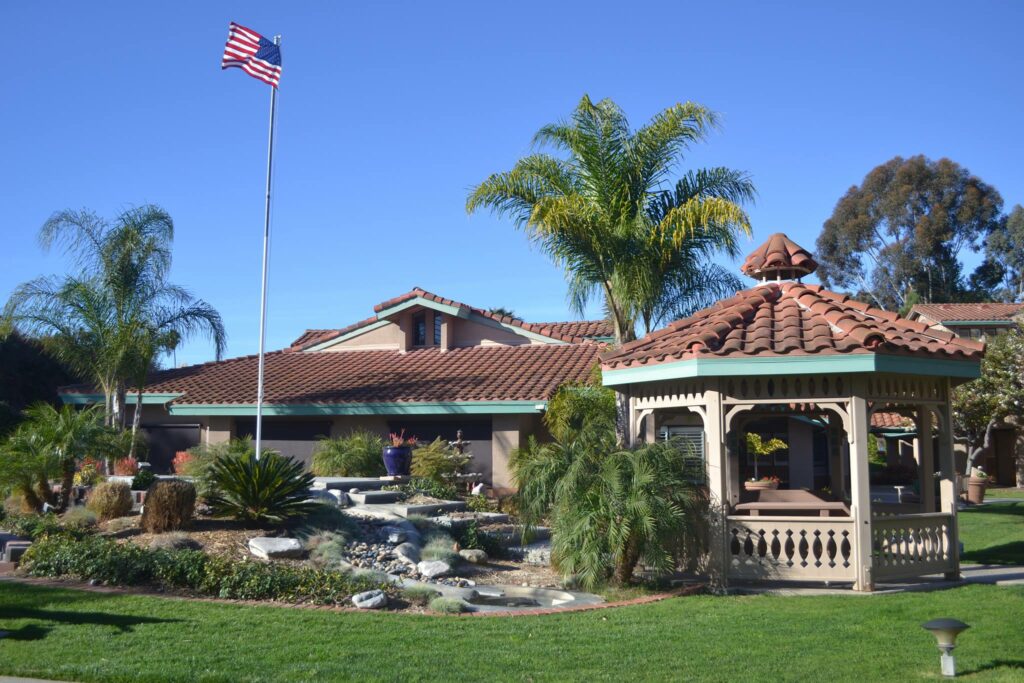
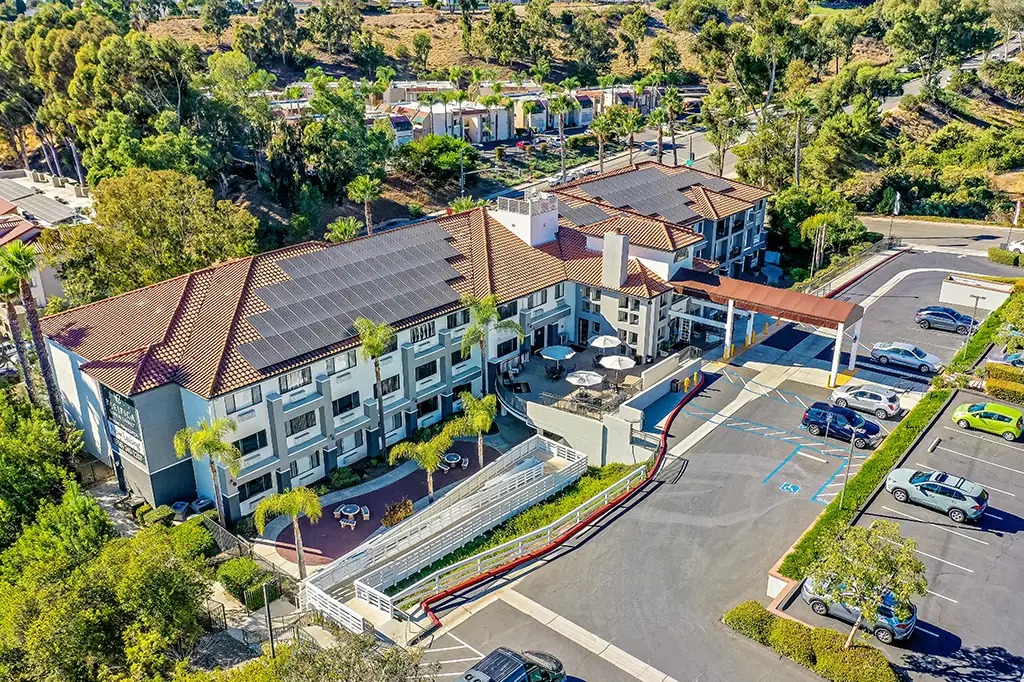
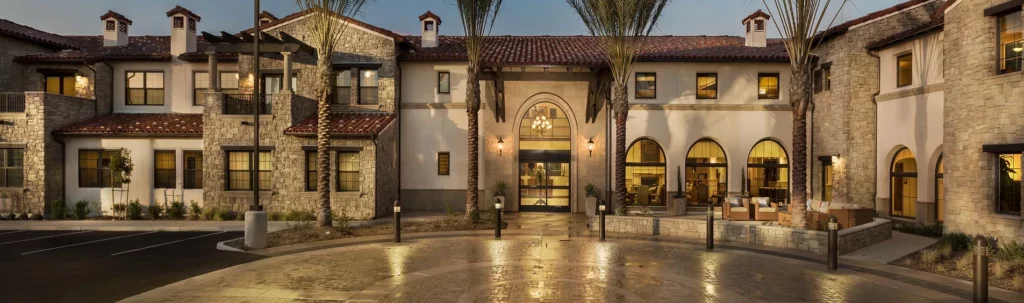
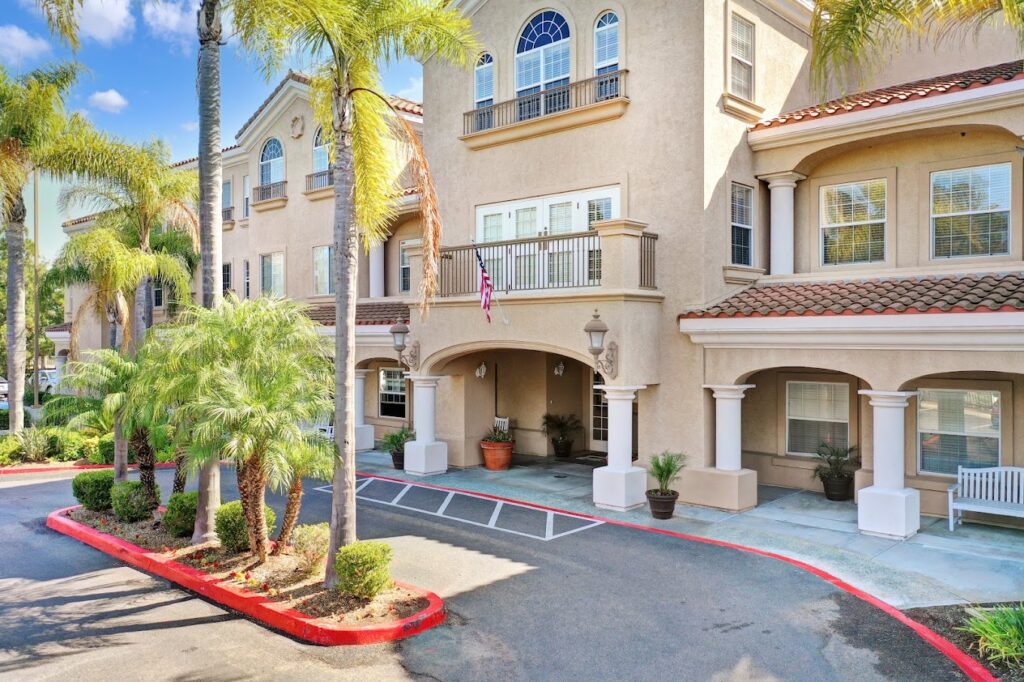
A top continuing care community in San Diego, Bayshire Torrey Pines is a senior living community that offers all levels of care. Bayshire Torrey Pines consists of professional staff who are committed to providing a safe and comfortable environment for all seniors. They pride themselves on their integrity by ensuring that everyone is confident to speak up and be truthful with their communication– growing a trusting bond between residents and staff. The senior living community does its best to guarantee everyone can thrive in a home that is bustling with big and inspiring spaces to help live a purposeful life. Torrey Pines puts value on the trust that families place in them; they are dedicated to earning and proving their worth.
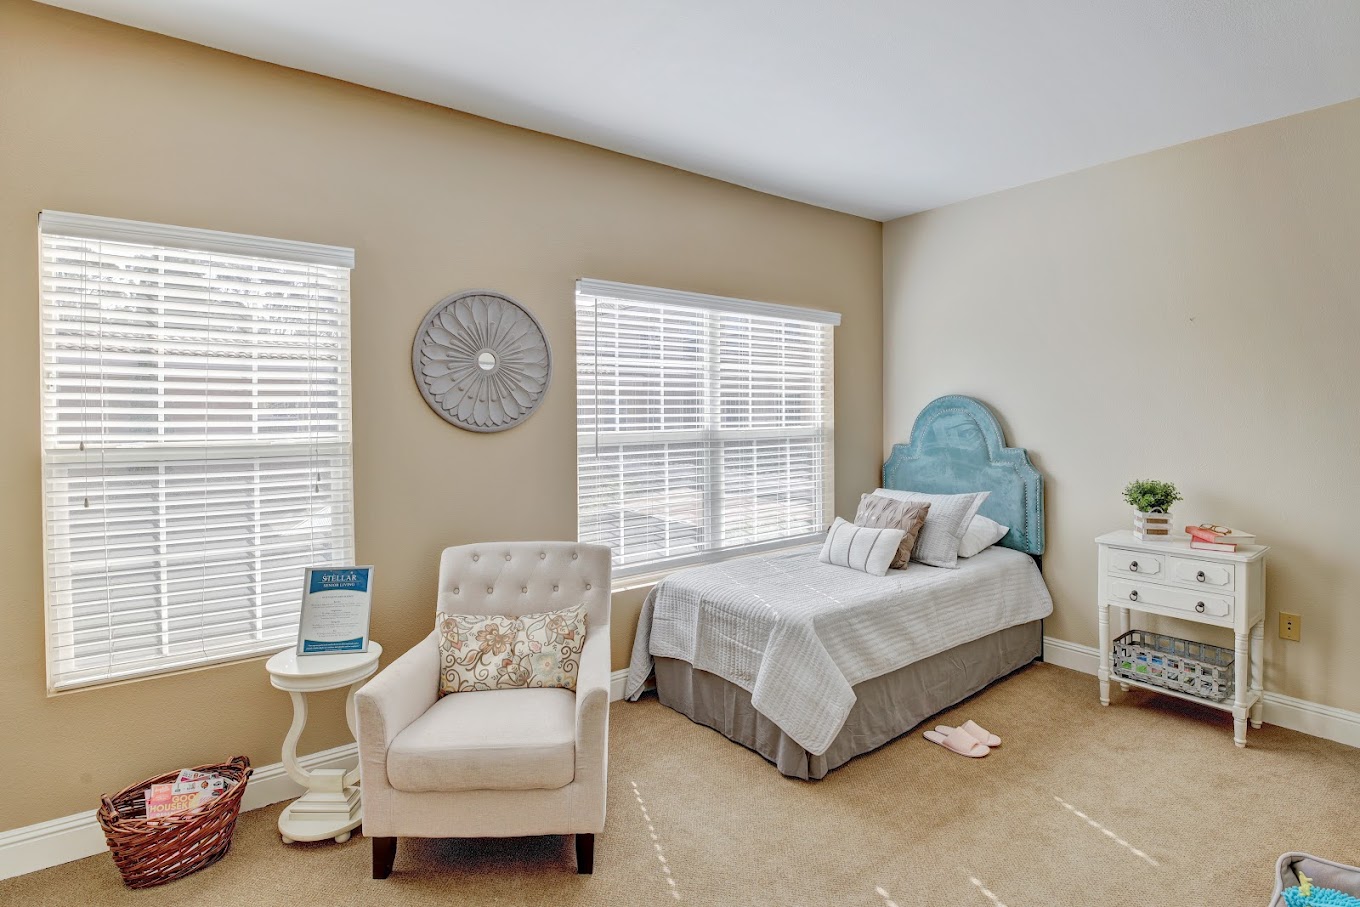
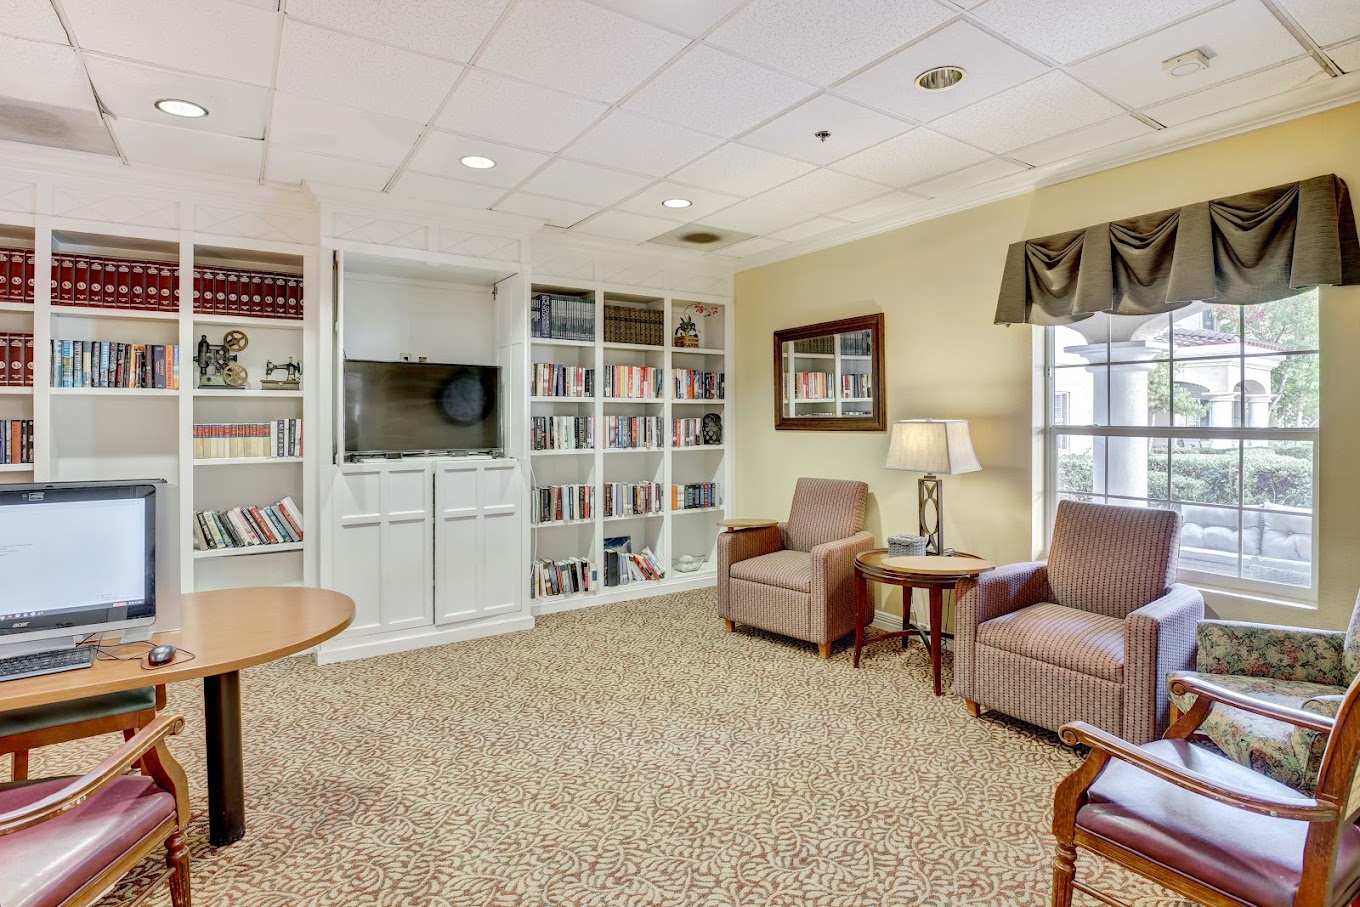
A certified quality care provision in San Diego, Bayshire Torrey Pines has a welcoming community housing independent living in resort-like hospitality. The charming community provides indoor and outdoor restaurant-style dining; a movie theater, a fitness center, library, and salon and day spa– among a few of their amenities and facilities offered. A few of their services are poetry classes, art classes, volunteering activities, maintenance and housekeeping, and concierge services. Bayshire Torrey Pines houses residents of ages averaging between seventy to ninety. Many families have come back to Bayshire Torrey Pines and with its rapid vacancy rate lowering, it’s a testament to the demand of the community– a community where families are confident their loved ones will be in good hands.
Offers a balance of services and community atmosphere.
Lower occupancy suggests more openings may be available.
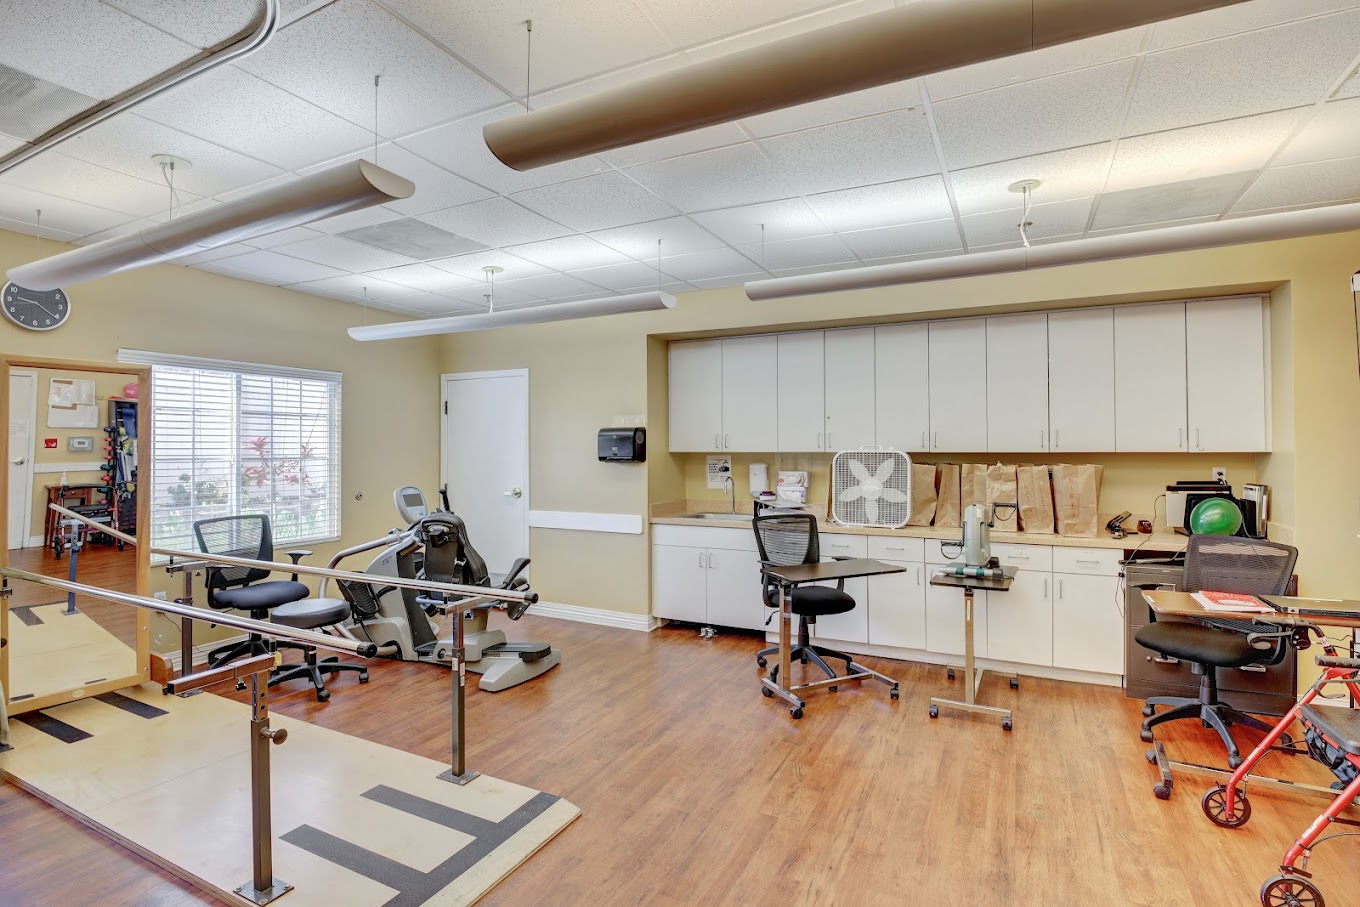
This home supports both short-term rehab and long-term care, with residents staying for a wide range of durations.
45% of new residents, usually for short-term rehab.
55% of new residents, often for short stays.
California average: 73%
Bayshire Torrey Pines is legally operated by HARTFIELD CARE LLC.
Key information about the people who lead and staff this community.
In California, the Department of Social Services (for assisted living facilities) and the Department of Public Health (for nursing homes) conduct inspections to ensure resident safety and regulatory compliance.
California average: 16 visits
2 total complaint visits
2 other visits
![]() Other visits include regulatory visits that are not routine inspections or complaint investigations, such as administrative check-ins, follow-up reviews, or licensing-related visits.
Other visits include regulatory visits that are not routine inspections or complaint investigations, such as administrative check-ins, follow-up reviews, or licensing-related visits.
13 total complaint visits
7 other visits
Investigations can have many visits.
California average: 10 complaint investigations
California average: 4 official inspections
A violation that poses an immediate risk to resident health or safety, or represents a substantial failure to comply with licensing requirements.
California average: 3 serious citations
A violation that does not pose an immediate risk to resident health or safety but requires correction to remain in compliance.
California average: 4 moderate citations
Most inspections found no deficiencies, including the most recent complaint investigation on September 15, 2025, which found no evidence to support allegations about medication administration, care plan adherence, or diet compliance. Earlier complaint investigations in July 2025 also concluded that staff met incontinence care needs and followed PPE protocols, with those allegations unsubstantiated. The facility’s February 25, 2025 annual inspection was clean with no deficiencies cited, though it was incomplete due to time constraints. The initial licensing inspection in March 2024 found the facility clean, safe, and ready for licensure with all required safety equipment in place. Overall, the record shows consistent compliance with regulations and no serious issues or enforcement actions reported.
California average 12.5
Last Health inspection on Feb 2025
California average 50.2
California average 4.65
Health citations are formal notices following inspections when they fail to comply with safety and care standards.
44 of 52 citations resulted from standard inspections; and 8 of 52 resulted from complaint investigations.
California average: 0.4
California average: 1
Data sourced from CMS Health Deficiencies reports. Citation severity codes range from A (least serious) to L (most serious). Immediate Jeopardy (J-L) citations indicate situations where the facility's noncompliance has placed residents at risk of death or serious harm.
Assisted Living A licensed, long-term care setting for seniors or individuals with disabilities who need help with daily activities — like bathing, dressing, and medication management — but not 24-hour skilled nursing. Offers housing, meals, and around-the-clock support while aiming to maximize resident independence.
Independent Living Lifestyle-focused communities for older adults offering dining, activities, and transportation with minimal personal care. Best for active, independent seniors who want community without medical support.
Nursing Home Licensed facility providing 24/7 skilled nursing care for residents with complex, ongoing medical needs. Staffed by RNs, LPNs, and CNAs. Inspected and star-rated annually by CMS. Accepts Medicare (short-term rehab) and Medicaid (long-term care).
Assisted Living A licensed, long-term care setting for seniors or individuals with disabilities who need help with daily activities — like bathing, dressing, and medication management — but not 24-hour skilled nursing. Offers housing, meals, and around-the-clock support while aiming to maximize resident independence.
Independent Living Lifestyle-focused communities for older adults offering dining, activities, and transportation with minimal personal care. Best for active, independent seniors who want community without medical support.
![]() 17.1 miles from city center — 1.5 miles to nearest hospital (Children's Primary Care Medical Group Carmel Valley)
17.1 miles from city center — 1.5 miles to nearest hospital (Children's Primary Care Medical Group Carmel Valley)
![]() 13101 Hartfield Ave, San Diego, CA 92130
13101 Hartfield Ave, San Diego, CA 92130
Add your location
This data corresponds to Q2 2025 and is based on CMS Payroll-Based Journal.
California average ratio: 0.00:1
California average: 7.7 hours
Manages medical care and health needs.
No contractors work on this role.
Assists with medical care and medications.
This role is partially covered by contractors.
Helps with daily care and mobility.
This role is partially covered by contractors.
Total hours from contractors
296 contractor hours this quarter
| Certified Nursing Assistant | 36 | 6 | 42 | 9,250 | 91 | 100% | 7.1 |
| Licensed Practical Nurse | 15 | 13 | 28 | 4,398 | 91 | 100% | 7 |
| Respiratory Therapy Technician | 7 | 0 | 7 | 1,760 | 79 | 87% | 6.3 |
| Registered Nurse | 7 | 0 | 7 | 1,544 | 88 | 97% | 6.9 |
| Physical Therapy Aide | 6 | 0 | 6 | 1,305 | 66 | 73% | 7.2 |
| Physical Therapy Assistant | 5 | 0 | 5 | 1,063 | 76 | 84% | 7.3 |
| RN Director of Nursing | 5 | 0 | 5 | 976 | 75 | 82% | 7.3 |
| Speech Language Pathologist | 3 | 0 | 3 | 920 | 67 | 74% | 7.4 |
| Clinical Nurse Specialist | 5 | 1 | 6 | 800 | 72 | 79% | 7.4 |
| Other Dietary Services Staff | 8 | 0 | 8 | 567 | 72 | 79% | 7.4 |
| Dental Services Staff | 1 | 0 | 1 | 556 | 67 | 74% | 8.3 |
| Mental Health Service Worker | 1 | 0 | 1 | 520 | 65 | 71% | 8 |
| Qualified Social Worker | 2 | 0 | 2 | 488 | 67 | 74% | 7.2 |
| Administrator | 1 | 0 | 1 | 352 | 44 | 48% | 8 |
| Occupational Therapy Aide | 2 | 0 | 2 | 188 | 37 | 41% | 4.9 |
| Nurse Practitioner | 1 | 0 | 1 | 88 | 11 | 12% | 8 |
| Medical Director | 0 | 1 | 1 | 61 | 18 | 20% | 3.4 |
| Occupational Therapy Assistant | 0 | 1 | 1 | 27 | 3 | 3% | 8.8 |
Source: CMS Long-Term Care Facility Characteristics (Data as of Jan 2026)
Part of a Continuing Care Retirement Community offering multiple care levels
Data sourced from CMS Long-Term Care Facility Characteristics quarterly report. Payer mix reflects the current resident census by primary payment source.
These measures show how residents usually do over time at this home, based on health outcomes and preventive care.
California average: 94.0%
California average: 1.5%
California average: 93.2%
Quality measures are calculated from Minimum Data Set (MDS) assessments. For most measures, lower percentages indicate better care quality.
Federal penalties imposed by CMS for regulatory violations, including civil money penalties (fines) and denials of payment for new Medicare/Medicaid admissions.
Source: CMS Penalties Database (Data as of Jan 2026)
California average: $55K
California average: 2.4
California average: 0.5
Penalties are imposed by CMS for violations of federal nursing home regulations.
Last updated: Jan 2026
Historical financial and operational data for Bayshire Torrey Pines based on CMS SNF Cost Reports.
Loading trend charts...
Care Cost Calculator: See Prices in Your Area
Nursing Home Data Explorer
Don’t Wait Too Long: 7 Red Flag Signs Your Parent Needs Assisted Living Now
The True Cost of Assisted Living in 2025 – And How Families Are Paying For It
Understanding Senior Living Costs: Pricing Models, Discounts & Financial Assistance
Touring a community? Use this expert-backed checklist to stay organized, ask the right questions, and find the perfect fit.
We'll send you a PDF version of the touring checklist.