Total health inspections
11
Illinois average 10.4
Last Health inspection on May 2025

We arrange tours, appointments, and even moving support so you don’t have to
Thank you for your interest!
Our team will be in touch shortly to help with next steps.

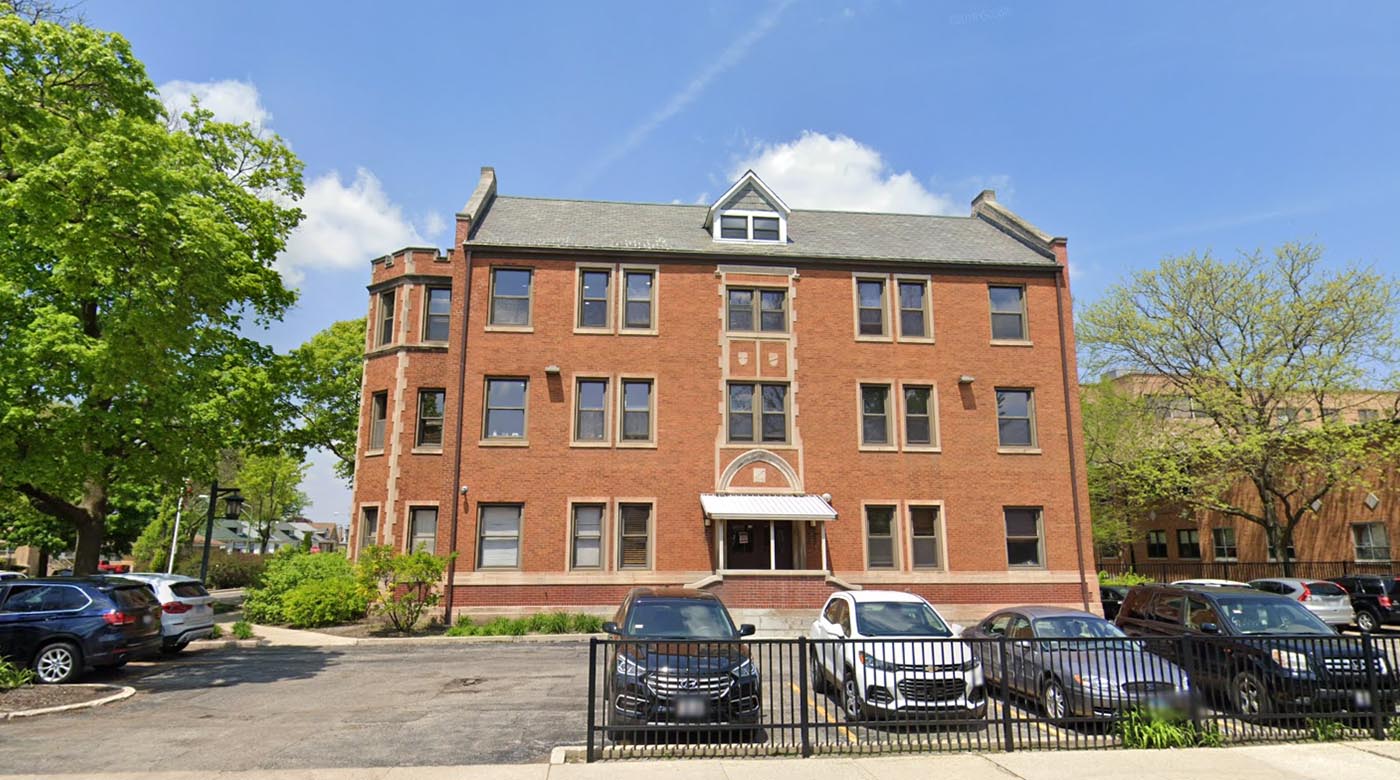
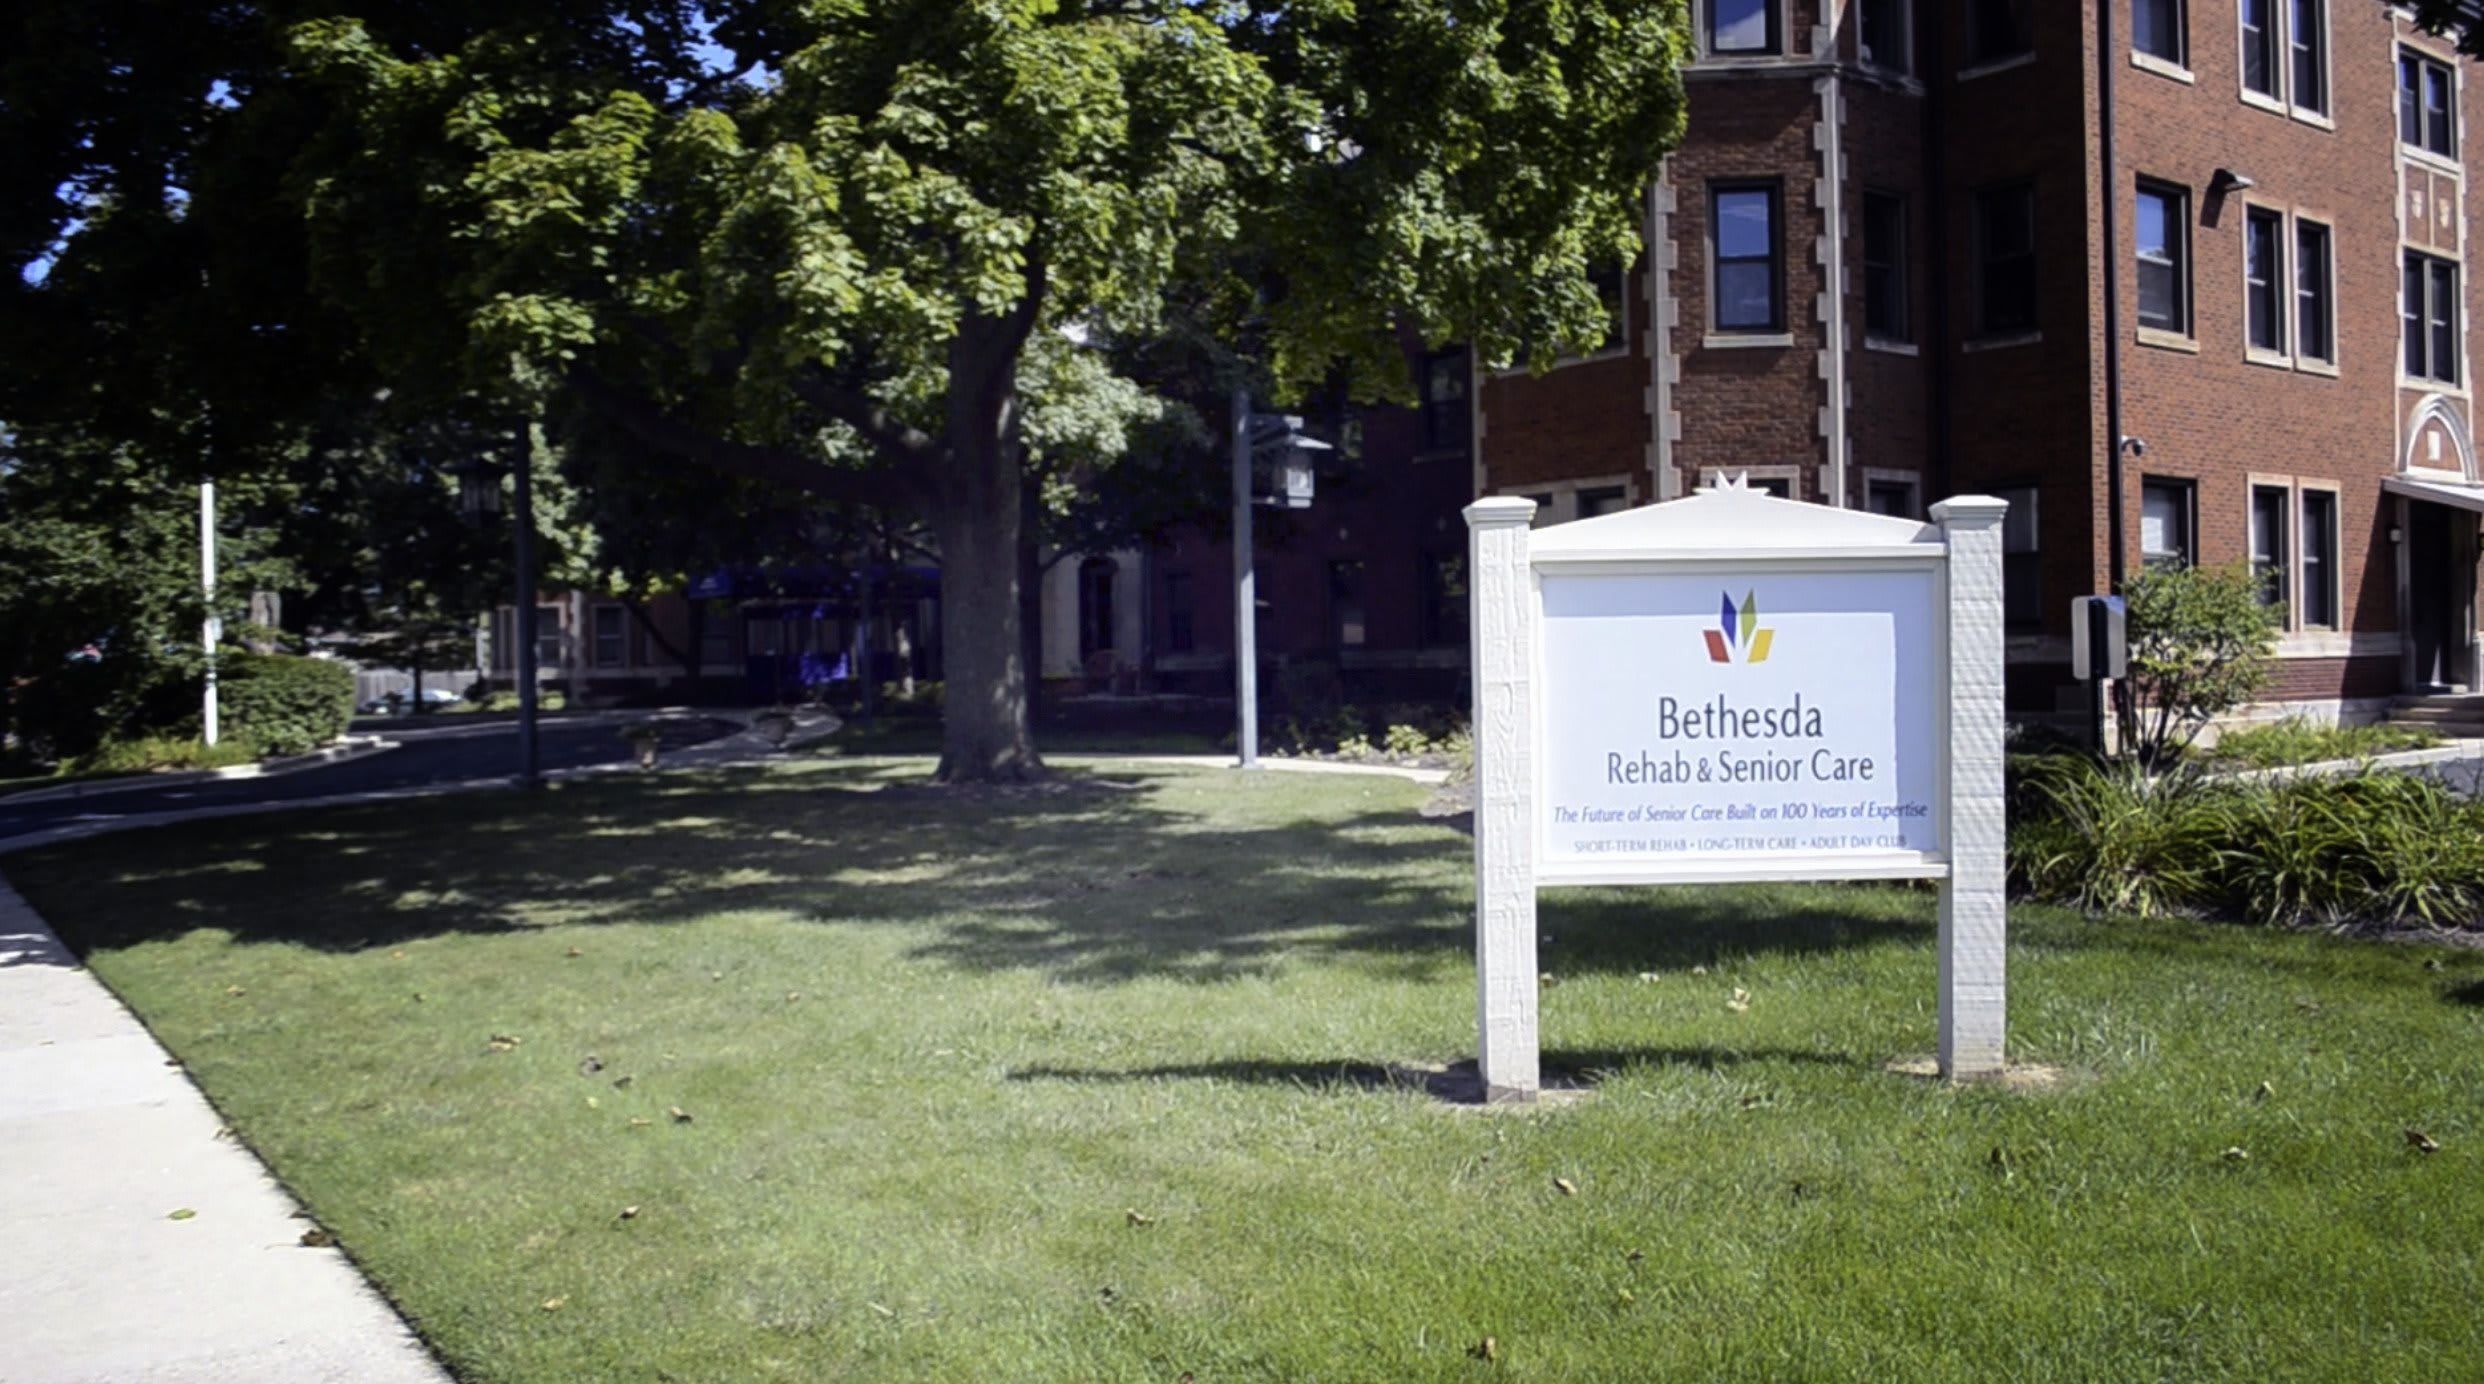
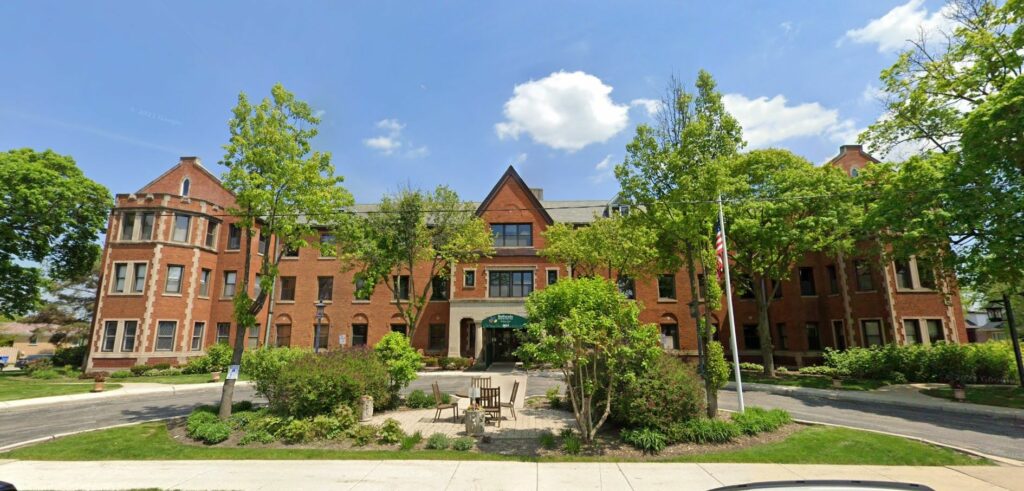
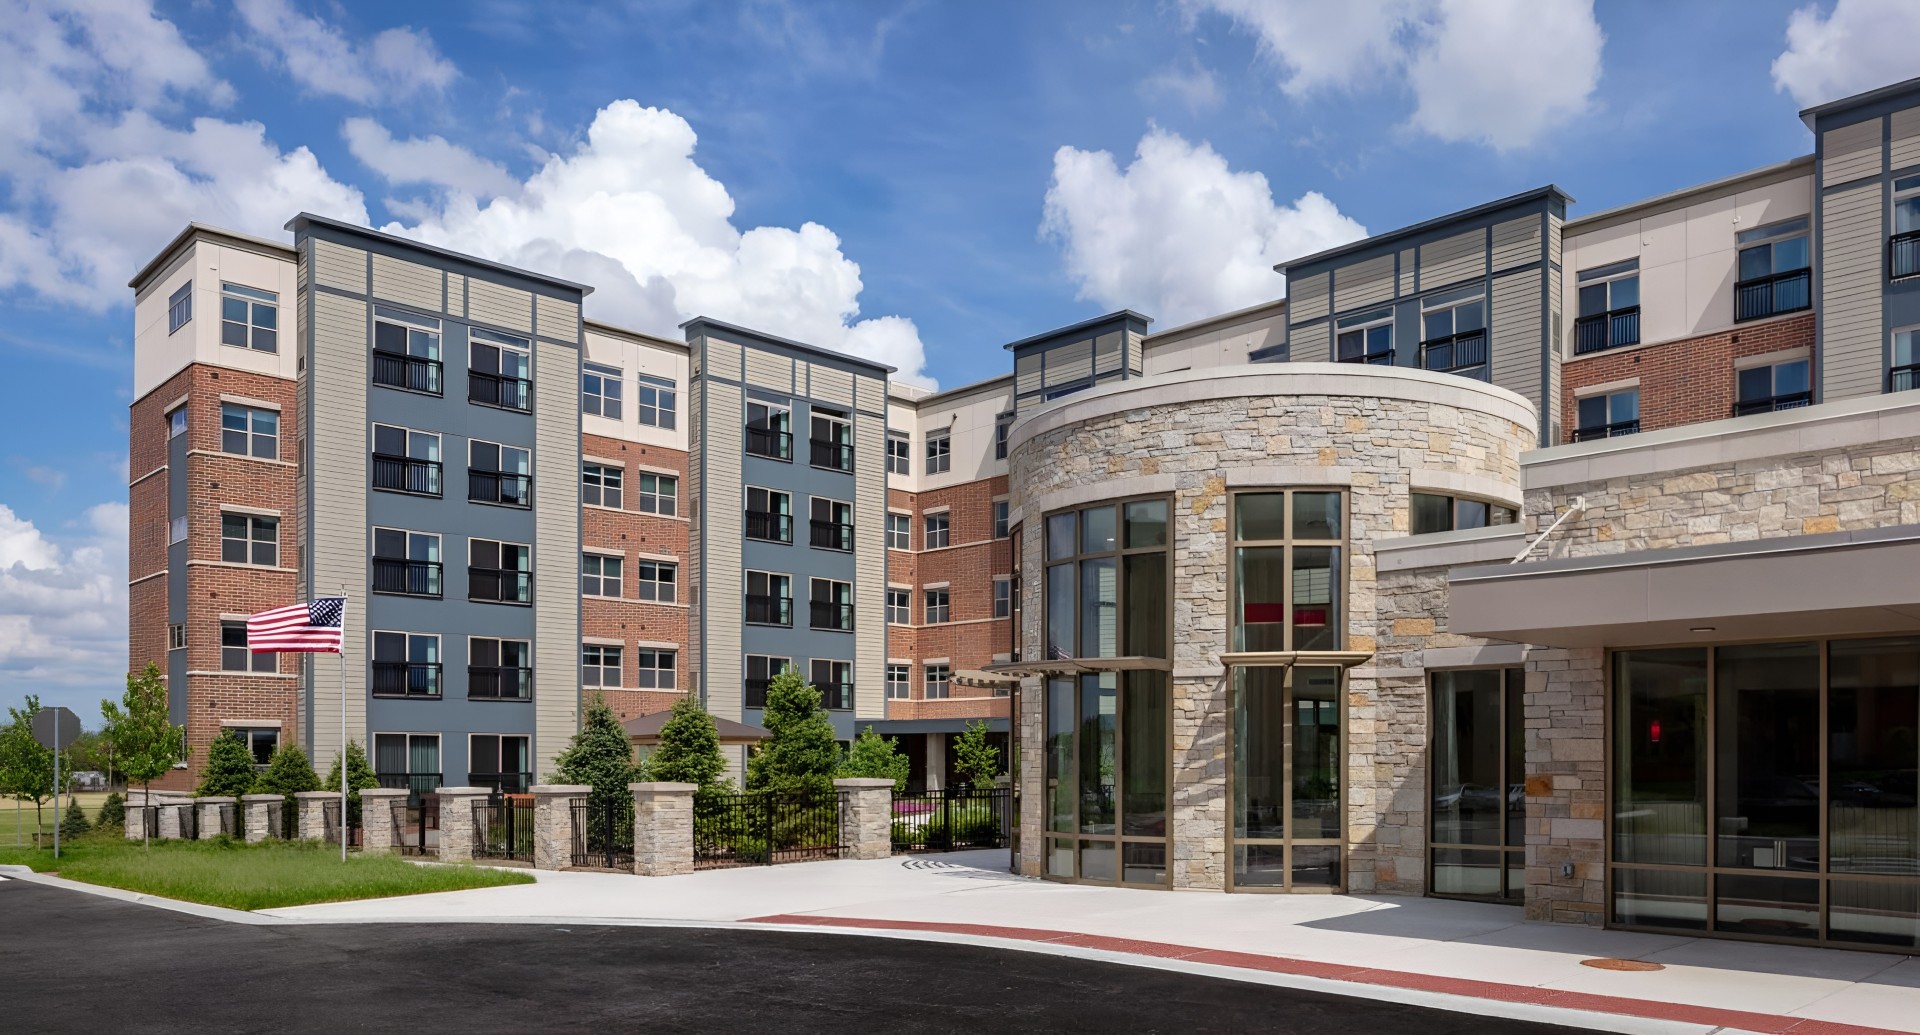
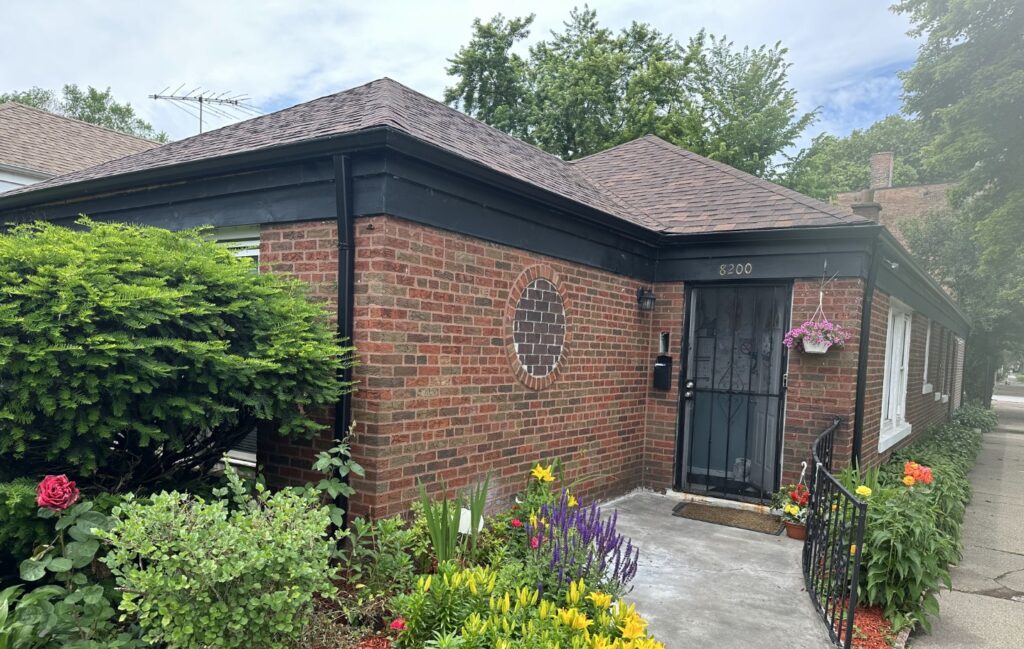
With over 100 years of experience in the field of senior care, Bethesda Rehab and Senior Care is a community that truly understands the aging process and is dedicated to providing the highest level of care to its residents. The community’s specially trained staff is committed to helping seniors achieve maximum independence, with ability-centered programming that promotes autonomy and self-expression. They offer a range of living options, from long term care to respite care, short term rehab, and Alzheimer’s and memory care services. They accept a variety of payment options, including Medicare, Medicaid, long term care insurance, and VA Aid and Assistance, making it accessible to all seniors who require its exceptional care.
Bethesda Rehab and Senior Care provides an extensive range of therapies and treatments to support its residents’ health and wellbeing. The community offers IV therapy, respiratory and orthopedic care, wound care, and cardiac care, along with physical, occupational, and speech therapy. With these services, residents can rest assured that their medical needs are being taken care of with the utmost attention and expertise. In keeping with its commitment to family-centered care, Bethesda Rehab and Senior Care offers family support services and welcomes visitors at any time. This allows seniors to stay connected with their loved ones.
Offers a balance of services and community atmosphere.
Lower occupancy suggests more openings may be available.
Most residents typically stay for a few weeks or months before returning home or moving on.
70% of new residents, usually for short-term rehab.
22% of new residents, often for short stays.
9% of new residents, often for long-term daily care.
Key information about the people who lead and staff this community.
In Illinois, the Department of Public Health, Office of Health Care Regulation conducts annual unannounced surveys to assess compliance with state and federal healthcare facility standards.
8 visits/inspections triggered by complaints
4 routine inspections
13 with issues
0 without issues
Deficiencies indicate regulatory issues. A higher number implies the facility had several areas requiring improvement.
Illinois average: 7 deficiencies
Illinois average 10.4
Last Health inspection on May 2025
Illinois average 36.8
Illinois average 3.68
Health citations are formal notices following inspections when they fail to comply with safety and care standards.
40 of 54 citations resulted from standard inspections; 13 of 54 resulted from complaint investigations; and 1 of 54 came from combined inspections (standard and complaint).
Illinois average: 0.7
Illinois average: 3.6
Data sourced from CMS Health Deficiencies reports. Citation severity codes range from A (least serious) to L (most serious). Immediate Jeopardy (J-L) citations indicate situations where the facility's noncompliance has placed residents at risk of death or serious harm.
Memory Care Secured, specialized care for people living with Alzheimer's or dementia. Staff trained in cognitive impairment, with higher staff-to-resident ratios and an environment designed to reduce confusion and wandering risk.
Nursing Home Licensed facility providing 24/7 skilled nursing care for residents with complex, ongoing medical needs. Staffed by RNs, LPNs, and CNAs. Inspected and star-rated annually by CMS. Accepts Medicare (short-term rehab) and Medicaid (long-term care).
Assisted Living A licensed, long-term care setting for seniors or individuals with disabilities who need help with daily activities — like bathing, dressing, and medication management — but not 24-hour skilled nursing. Offers housing, meals, and around-the-clock support while aiming to maximize resident independence.
Memory Care Secured, specialized care for people living with Alzheimer's or dementia. Staff trained in cognitive impairment, with higher staff-to-resident ratios and an environment designed to reduce confusion and wandering risk.
Assisted Living A licensed, long-term care setting for seniors or individuals with disabilities who need help with daily activities — like bathing, dressing, and medication management — but not 24-hour skilled nursing. Offers housing, meals, and around-the-clock support while aiming to maximize resident independence.
Home Care Professional care delivered in the person's own home — from companionship and errands to skilled nursing and therapy. Allows seniors to age in place. Medicare covers skilled home health when medically necessary.
Memory Care Secured, specialized care for people living with Alzheimer's or dementia. Staff trained in cognitive impairment, with higher staff-to-resident ratios and an environment designed to reduce confusion and wandering risk.
Assisted Living A licensed, long-term care setting for seniors or individuals with disabilities who need help with daily activities — like bathing, dressing, and medication management — but not 24-hour skilled nursing. Offers housing, meals, and around-the-clock support while aiming to maximize resident independence.
Memory Care Secured, specialized care for people living with Alzheimer's or dementia. Staff trained in cognitive impairment, with higher staff-to-resident ratios and an environment designed to reduce confusion and wandering risk.
![]() 13.2 miles from city center — 3.87 miles to nearest hospital (Resurrection Medical Center - Emergency Fast Track)
13.2 miles from city center — 3.87 miles to nearest hospital (Resurrection Medical Center - Emergency Fast Track)
![]() 2833 N Nordica Ave, Chicago, IL 60634
2833 N Nordica Ave, Chicago, IL 60634
Add your location
This data corresponds to Q2 2025 and is based on CMS Payroll-Based Journal.
Illinois average ratio: 1.90:1
Illinois average: 7.6 hours
Manages medical care and health needs.
This role is partially covered by contractors.
Assists with medical care and medications.
This role is partially covered by contractors.
Helps with daily care and mobility.
This role is partially covered by contractors.
Total hours from contractors
6,185 contractor hours this quarter
| Certified Nursing Assistant | 76 | 137 | 213 | 20,686 | 91 | 100% | 7.2 |
| Licensed Practical Nurse | 26 | 21 | 47 | 6,685 | 91 | 100% | 8 |
| Registered Nurse | 15 | 42 | 57 | 4,850 | 91 | 100% | 7.8 |
| Other Dietary Services Staff | 5 | 0 | 5 | 1,838 | 91 | 100% | 7.6 |
| Nurse Practitioner | 1 | 1 | 2 | 608 | 64 | 70% | 7.5 |
| Clinical Nurse Specialist | 2 | 1 | 3 | 608 | 63 | 69% | 7.3 |
| Respiratory Therapy Technician | 0 | 2 | 2 | 488 | 64 | 70% | 7.6 |
| Physical Therapy Aide | 0 | 4 | 4 | 487 | 64 | 70% | 6.6 |
| Administrator | 1 | 0 | 1 | 473 | 63 | 69% | 7.5 |
| Mental Health Service Worker | 1 | 0 | 1 | 473 | 63 | 69% | 7.5 |
| Qualified Social Worker | 0 | 3 | 3 | 469 | 62 | 68% | 7.4 |
| Dietitian | 1 | 0 | 1 | 458 | 61 | 67% | 7.5 |
| Speech Language Pathologist | 0 | 11 | 11 | 444 | 68 | 75% | 6.3 |
| Physical Therapy Assistant | 0 | 3 | 3 | 444 | 60 | 66% | 7.4 |
| Qualified Activities Professional | 1 | 0 | 1 | 263 | 35 | 38% | 7.5 |
| Occupational Therapy Aide | 0 | 1 | 1 | 28 | 9 | 10% | 3.1 |
| RN Director of Nursing | 1 | 0 | 1 | 2 | 3 | 3% | 0.5 |
Source: CMS Long-Term Care Facility Characteristics (Data as of Jan 2026)
Residents meet regularly to discuss policies, care quality, and activities
Organized group of residents that meets regularly to discuss facility policies, quality of life, and activities.
Data sourced from CMS Long-Term Care Facility Characteristics quarterly report. Payer mix reflects the current resident census by primary payment source.
These measures show how residents usually do over time at this home, based on health outcomes and preventive care.
Illinois average: 9.7
Illinois average: 18.6
Illinois average: 15.5%
Illinois average: 18.4%
Illinois average: 21.6%
Illinois average: 3.4%
Illinois average: 5.3%
Illinois average: 1.8%
Illinois average: 6.5%
Illinois average: 48.1%
Illinois average: 20.2%
Illinois average: 89.2%
Illinois average: 91.6%
Illinois average: 68.3%
Illinois average: 2.3%
Illinois average: 63.0%
Quality measures are calculated from Minimum Data Set (MDS) assessments. For most measures, lower percentages indicate better care quality.
Federal penalties imposed by CMS for regulatory violations, including civil money penalties (fines) and denials of payment for new Medicare/Medicaid admissions.
Source: CMS Penalties Database (Data as of Jan 2026)
Illinois average: $143K
Illinois average: 3.0
Illinois average: 1.1
Penalties are imposed by CMS for violations of federal nursing home regulations.
Last updated: Jan 2026
Historical financial and operational data for Bethesda Rehab & Senior Care based on CMS SNF Cost Reports.
Loading trend charts...
Care Cost Calculator: See Prices in Your Area
Nursing Home Data Explorer
Don’t Wait Too Long: 7 Red Flag Signs Your Parent Needs Assisted Living Now
The True Cost of Assisted Living in 2025 – And How Families Are Paying For It
Understanding Senior Living Costs: Pricing Models, Discounts & Financial Assistance

Touring a community? Use this expert-backed checklist to stay organized, ask the right questions, and find the perfect fit.
We'll send you a PDF version of the touring checklist.