Bowling Green Nursing and Rehabilitation Center

Nursing Home

Bowling Green Nursing and Rehabilitation Center

1561 Newton Ave, Bowling Green, KY 42104 View Map
Nursing Home
icon
Care Cost Calculator: See Prices in Your Area Care Cost Calculator: See Prices in Your Area icon
Overview of Bowling Green Nursing and Rehabilitation Center

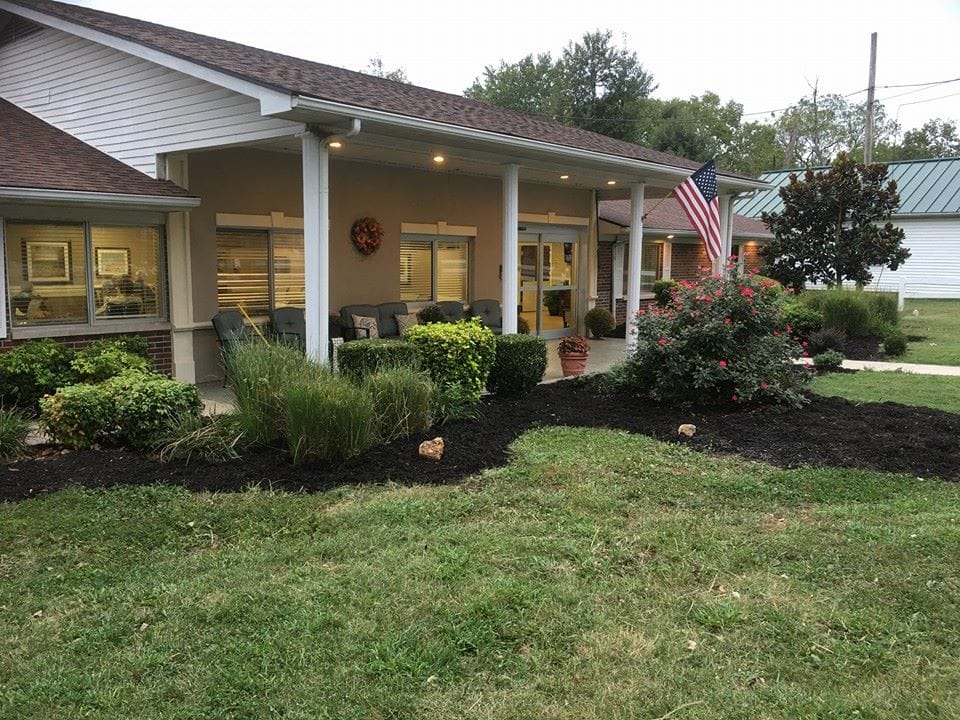
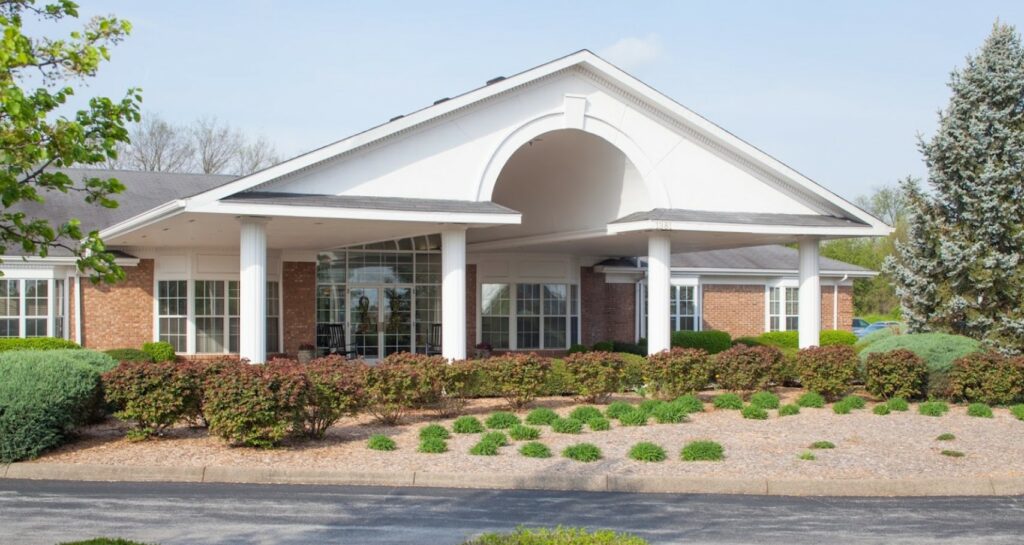
Bowling Green Nursing and Rehabilitation Center operates with an unwavering commitment to providing exceptional nursing home care, with customized plans and cutting-edge therapies. With an interdisciplinary team, individualized treatment approaches, and state-of-the-art technology, they offer world-class equipment and skills to facilitate faster recovery for residents.
The home offers an array of specialized programs tailored to meet the unique needs of residents, whether they are cardiac patients, orthopedic patients, or long-term stay patients. These nursing home activities are designed to promote optimal health and well-being, providing residents with engaging opportunities for social interaction and personal fulfillment. The rehab gym, equipped with advanced equipment, ensures that residents have access to the best tools for their recovery journey. Additionally, they understand the importance of nursing home reviews, which allow them to continuously improve and provide the highest level of care.

Quality ratings

Measured by Centers for Medicare & Medicaid Services (CMS)

Overall rating Info Official CMS rating based on health inspections, staffing and quality measures.
3/5
Kentucky average: 2.8/5
Health Inspection Info Official CMS rating based on deficiencies found during state health inspections.
4/5
Kentucky average: 2.9/5
Staffing Info Official CMS rating based on nurse staffing hours per resident per day.
1/5
Kentucky average: 2.7/5
Quality Measures Info Official CMS rating based on clinical outcomes for residents.
2/5
Kentucky average: 2.9/5

Nursing care per resident

Info Average daily nursing hours per resident (adjusted for acuity). Higher values indicate more nursing time per resident.
3h 9m per day

This home provides 16% less nursing time per resident than the state average.

Kentucky average: 3h 45m per day

Staffing hours breakdown

Info Hours of care per resident per day, broken down by staff type. Data from CMS Medicare.
Staff type Facility State avg National avg
Registered Nurse (RN) Info Registered nurse hours per resident per day. 24m per day 46m per day 41m per day
LPN / LVN Info Licensed Practical Nurse / Licensed Vocational Nurse hours per resident per day. 44m per day 49m per day 52m per day
Nurse Aide Info Nurse aide hours per resident per day. 2h 9m per day 2h 25m per day 2h 21m per day
Total Nursing (Weekend) Info Total number of nurse staff hours per resident per day on weekends. 2h 51m per day 3h 29m per day 3h 26m per day
Physical Therapist Info Physical therapist staff hours per resident per day. 5m per day 4m per day 4m per day
RN (Weekend) Info Registered nurse hours per resident per day on weekends. 17m per day 31m per day 29m per day

Capacity and availability

Smaller home

May offer a more intimate, personalized care environment.

Total beds 66

This home usually has availability

Lower occupancy suggests more openings may be available.

Lower demand than the Kentucky average
Occupancy rate 84.2%
Residents per day (avg) 57
Occupancy rate
84.2%
Residents per day (avg)
57

Who this home usually serves

TYPE OF STAY

Mostly long-term care residents

Most residents stay for extended periods and receive ongoing daily care.

Might be optimal for
Long-term daily care Ongoing support needs

Breakdown by payment type

Medicare

30% of new residents, usually for short-term rehab.

Typical stay 1 - 2 months

Private pay

31% of new residents, often for short stays.

Typical stay 2 months

Medicaid

39% of new residents, often for long-term daily care.

Typical stay 8 - 9 months

Finances and operations

Proprietary home
Corporation
Home revenue
$6.3M
Profit
$106.4K
Proprietary home Corporation
Home revenue
$6,268,258.00
Profit
$106,381.00
Payroll costs Info The portion of the home's budget spent on staff, including nurses, caregivers, and other employees who support care and operations.
$2.8M
44% of revenue
Other operating costs Info All remaining costs needed to run the home, such as food, utilities, building maintenance, supplies and administrative expenses.
$3.4M
Total costs $6.2M
Bed community size
66-bed community
A moderately sized community that may balance personal attention with shared amenities and social activities.
Years in operation
1 year in operation
A newer community that may feature more recent facilities and programs.
Walk Score
Walk Score: 52 / 100
Moderately walkable. Some errands can be accomplished on foot, with a mix of nearby amenities.

About this community

Occupancy Rate
83%
Occupied Beds
55 of 66
Percentage of available beds currently in use by residents.
Facility Type
Long Term Care (Nursing Facility)
License Date
January 1, 2025
License Expiration
December 31, 2025

Additional licensing details

License number: 100409
CMS Certification Number: 185224
County: WARREN

Ownership & operating entity

Bowling Green Nursing and Rehabilitation Center is legally operated by BOWLING GREEN HEALTH CENTER, LLC, and administrated by JEFFREY.

Type Of Units

NF (Nursing Facility)
66 units
Total beds
66 units

Safety & Compliance

Care Services

Doctor on Staff
Nursing Services
Rehabilitation Services
Respite Care
Skilled Nursing
Licensed Nurses/CNAs
24-Hour Staffing
Short-Term Rehab

Additional Policies & Features

Pets Allowed

Amenities & Lifestyle

Social gatherings with friends and family
Social outings
including church
Beauty and barber services
Complimentary Wi-Fi
Family gathering rooms
Pet-friendly (with proof of vaccination
pets are welcome to visit)
Laundry services
Private rooms available

Programs & Activities

Specific Programs
Skilled Nursing, Specialty Services, Rehabilitation, Amenities, Activities, News

Dining & Nutrition

Food Description
Bowling Green Nursing & Rehabilitation Center offers dietary and nutritional counseling as part of their services.
Contact Bowling Green Nursing and Rehabilitation Center

Inspection History

In Kentucky, the Cabinet for Health and Family Services, Office of Inspector General is the regulatory authority that conducts inspections and investigates complaints in all long-term care homes.

1 visit/inspection

Results

0 with issues

1 without issues

Latest inspection

Date:October 21, 2025
Type:Abbreviated Survey

Compare Nursing Homes around Bowling Green

The information below is reported by the Kentucky Cabinet for Health and Family Services, Office of Inspector General.
Magnolia Village
SNF

Nursing Home 24/7 care needed

AL

Assisted Living For seniors needing help with daily tasks but not full-time nursing.

Bowling Green
60
No
37
MAGNOLIA VILLAGE HEALTH CENTER LLC
93.9%
$7,406,434.00
$2,481,051.00
33.5%
57.90
4/5
2.5631
5/5
1/5
3/5
8
-
-3%
-32%
+15%
Edmonson Center
AL

Assisted Living For seniors needing help with daily tasks but not full-time nursing.

SNF

Nursing Homes 24/7 care needed

Brownsville
86
No
43
EDMONSON HEALTH CENTER LLC
85.2%
$10,473,598.00
$3,119,720.00
29.8%
71.50
4/5
3.4651
4/5
3/5
4/5
11
3
-29%
-8%
+5%
Bowling Green Nursing and Rehabilitation Center
SNF

Nursing Home 24/7 care needed

AL

Assisted Living For seniors needing help with daily tasks but not full-time nursing.

Bowling Green
66
No
52
RAYMER, NATALIE
84.2%
$6,197,377.00
$2,757,933.00
44.5%
56.60
3/5
3.1453
4/5
1/5
2/5
8
-
+9%
-16%
+4%

Places of interest near Bowling Green Nursing and Rehabilitation Center

Address 2.3 miles from city center — 0.69 miles to nearest hospital (TriStar Greenview Regional Hospital)

Address 1561 Newton Ave, Bowling Green, KY 42104

Calculate Travel Distance to Bowling Green Nursing and Rehabilitation Center

Add your location

Address

Staffing Data

Source: CMS Payroll-Based Journal (Q2 2025)

97
Total Staff
69
Employees
28
Contractors
21,275
Total Hours (Quarter)
27
Avg Staff/Day
8.7
Avg Shift (hrs)
Nursing Staff Breakdown
Role Count Avg Shift (hrs) Uses Contractors?
Registered Nurse117.7 Yes
Licensed Practical Nurse119.9 Yes
Certified Nursing Assistant379.2 No
Staff by Category
Administration
2 staff
7.7hs shift avg
Nursing Staff
65 staff
9.1hs shift avg
Physicians & Practitioners
4 staff
7.8hs shift avg
Therapy Services
19 staff
5.8hs shift avg
Activities & Recreation
1 staff
8.9hs shift avg
Social Services
3 staff
7.4hs shift avg
Dietary Services
2 staff
7.2hs shift avg
Other Services
1 staff
7.2hs shift avg
Contractor Analysis
12.8%
of total hours from contractors
2,724 contractor hours this quarter
Licensed Practical Nurse: 3 Physical Therapy Assistant: 5 Speech Language Pathologist: 4 Registered Nurse: 1 Qualified Social Worker: 3 Physical Therapy Aide: 4 Respiratory Therapy Technician: 2 Occupational Therapy Aide: 2 Medical Director: 1 Nurse Practitioner: 1 Occupational Therapy Assistant: 2
Role Employees Contractors Total Staff Total Hours Days Worked % of Days Avg Shift (hrs)
Certified Nursing Assistant370379,76791100%9.2
Licensed Practical Nurse83112,8989099%9.9
RN Director of Nursing3031,3186673%7.9
Medication Aide/Technician2021,2449099%9.7
Registered Nurse101111,1748796%7.7
Speech Language Pathologist0446196774%6.1
Qualified Activities Professional1015366066%8.9
Qualified Social Worker0334986774%7.4
Administrator1014325459%8
Respiratory Therapy Technician0224296066%7.2
Mental Health Service Worker1014115763%7.2
Nurse Practitioner2133764549%8
Physical Therapy Aide0443696470%5.8
Other Dietary Services Staff1013124347%7.2
Dietitian1012483538%7.1
Clinical Nurse Specialist1012363235%7.4
Nurse Aide in Training1011611415%11.5
Occupational Therapy Aide0221041516%6.9
Physical Therapy Assistant055934145%2.3
Occupational Therapy Assistant0224733%7.8
Medical Director011633%2

Health Inspection History

Inspections
Total health inspections 4

Kentucky average 2.9


Last Health inspection on Nov 2024

Total health citations 8
Citations per inspection
2

Health citations are formal notices following inspections when they fail to comply with safety and care standards.

5 of 8 citations resulted from standard inspections; and 3 of 8 resulted from complaint investigations.

Breakdown of citation severity (last 3 years)
Critical Health citations More info 0
100% better than Kentucky average

Kentucky average: 1.1


Serious Health citations More info 0
100% better than Kentucky average

Kentucky average: 0.6

0 critical citations More info Kentucky average: 1.1

0 serious citations More info Kentucky average: 0.6

7 moderate citations More info Kentucky average: 11.6

1 minor citation More info Kentucky average: 0.1
Citations history (last 3 years)
Pharmacy moderate citation Nov 07, 2024
Corrected

Care Planning moderate citation Nov 07, 2024
Corrected

Abuse/Neglect moderate citation Oct 03, 2024
Corrected

Care Planning moderate citation Oct 03, 2024
Corrected

Facility Characteristics

Source: CMS Long-Term Care Facility Characteristics (Data as of Jan 2026)

Ownership: For-Profit LLC
Resident Census by Payment Source
58 Total Residents
Medicare 8 (13.8%)
Medicaid 46 (79.3%)
Private Pay/Other 4 (6.9%)
Programs & Services
Residents' Group
Family Engagement

Active councils help families stay involved in care decisions and facility operations.

Quality of care over time

These measures show how residents usually do over time at this home, based on health outcomes and preventive care.

High-risk clinical events score Info A composite score based on pressure ulcers, falls with injury, weight loss, walking ability decline, and activities of daily living decline. 14.8
41% worse than Kentucky average

Kentucky average: 10.5

Functional decline score Info A composite score based on activities of daily living decline, walking ability decline, and incontinence. 24.8
31% worse than Kentucky average

Kentucky average: 18.9

Long-stay resident measures
Need for Help with Daily Activities Increased Info Percent of long-stay residents whose need for help with daily activities has increased 19.9%
18% worse than Kentucky average

Kentucky average: 16.8%

Walking Ability Worsened Info Percent of long-stay residents whose ability to move independently worsened 27.4%
40% worse than Kentucky average

Kentucky average: 19.6%

Low Risk Residents with Bowel/Bladder Incontinence Info Percent of low risk long-stay residents who lose control of their bowels or bladder 27.2%
33% worse than Kentucky average

Kentucky average: 20.5%

Falls with Major Injury Info Percent of long-stay residents experiencing one or more falls with major injury 8.2%
117% worse than Kentucky average

Kentucky average: 3.8%

High Risk Residents with Pressure Ulcers Info Percent of long-stay high risk residents with pressure ulcers 10.6%
85% worse than Kentucky average

Kentucky average: 5.8%

Urinary Tract Infection Info Percent of long-stay residents with a urinary tract infection 1.0%
47% better than Kentucky average

Kentucky average: 1.9%

Lost Too Much Weight Info Percent of long-stay residents who lose too much weight 7.9%
17% worse than Kentucky average

Kentucky average: 6.8%

Depressive Symptoms Info Percent of long-stay residents who have depressive symptoms 0.0%
100% better than Kentucky average

Kentucky average: 14.3%

Antipsychotic Use Info Percent of long-stay residents who received an antipsychotic medication 24.7%
59% worse than Kentucky average

Kentucky average: 15.6%

Pneumococcal Vaccine Info Percent of long-stay residents assessed and appropriately given the pneumococcal vaccine 97.6%
In line with Kentucky average

Kentucky average: 93.9%

Influenza Vaccine Info Percent of long-stay residents assessed and appropriately given the seasonal influenza vaccine 96.6%
In line with Kentucky average

Kentucky average: 96.2%

Hospitalizations per 1,000 days Info Number of hospitalizations per 1,000 long-stay resident days. 1.30
30% better than Kentucky average

Kentucky average: 1.87

ED visits per 1,000 days Info Number of outpatient emergency department visits per 1,000 long-stay resident days. 1.49
32% better than Kentucky average

Kentucky average: 2.19

Short-stay resident measures
Pneumococcal Vaccine Info Percent of short-stay residents assessed and appropriately given the pneumococcal vaccine 98.1%
17% better than Kentucky average

Kentucky average: 83.7%

Antipsychotic medication increase Info Percent of short-stay residents who newly received an antipsychotic medication 1.1%
41% better than Kentucky average

Kentucky average: 1.9%

Influenza Vaccine Info Percent of short-stay residents assessed and appropriately given the seasonal influenza vaccine 97.4%
17% better than Kentucky average

Kentucky average: 83.6%

Re-hospitalized after SNF stay Info Percentage of short-stay residents who were re-hospitalized after their nursing home admission. 15.0%
39% better than Kentucky average

Kentucky average: 24.5%

Emergency department visits Info Percentage of short-stay residents who had an outpatient emergency department visit. 8.0%
42% better than Kentucky average

Kentucky average: 13.9%

Successful return to home or community Info Rate of successful return to home or community from a skilled nursing facility. 42.1%
17% worse than Kentucky average

Kentucky average: 50.6%

Guides for Better Senior Living

Care Cost Calculator: See Prices in Your Area

Nursing Home Data Explorer

Don’t Wait Too Long: 7 Red Flag Signs Your Parent Needs Assisted Living Now

The True Cost of Assisted Living in 2025 – And How Families Are Paying For It

Understanding Senior Living Costs: Pricing Models, Discounts & Financial Assistance

Financial Aid for Kentucky Seniors

Get financial aid guidance

Home and Community Based Waiver

Kentucky Medicaid HCB Waiver

Age 65+ or disabled, Kentucky resident, Medicaid-eligible, nursing home-level care need.

~$2,829/month (300% FBR, individual).

$2,000 (individual), $3,000 (couple).

Rural focus; waitlists possible.

Hart-Supported Living Program

KY Hart-Supported Living

Age 65+ or disabled, Kentucky resident.

No strict limit; prioritizes low-income.

Not applicable.

Competitive grants; limited availability.

Kentucky Homecare Program

Kentucky Homecare Program

Age 60+, Kentucky resident, at risk of nursing home placement, not eligible for Medicaid waivers.

No strict limit; prioritizes low-income (~$24,980/year individual).

Not assessed; need-based focus.

15 AAAs; rural focus; not in nursing homes.

Medicare Savings Program (MSP)

Kentucky Medicare Savings Program

Age 65+ or disabled, Kentucky resident, Medicare Part A/B.

~$2,510/month (QMB), ~$3,380/month (SLMB), ~$3,598/month (QI)—individual.

$9,430 (individual), $14,130 (couple).

Three tiers; no waitlist; auto Extra Help for Part D.

National Family Caregiver Support Program (NFCSP) Respite

Kentucky NFCSP Respite Care

Caregivers of 60+ needing care or 55+ caregivers of others; Kentucky resident; functional needs (2+ ADLs).

Prioritizes ~$24,980/year (individual); no strict cap.

Not assessed; need-based.

15 AAAs; prioritizes low-income, rural caregivers.

Kentucky Family Caregiver Program

Kentucky Family Caregiver Program

Grandparents (often 55+) as primary caregivers to grandchildren under 18, Kentucky resident, not on Kinship Care.

~$31,225/year (individual); varies by AAA.

Not strictly assessed; need-based.

Max $1,500/year; statewide via AAAs.

Senior Community Service Employment Program (SCSEP)

Kentucky SCSEP

Age 55+, unemployed, low-income, Kentucky resident.

~$1,983/month (125% FPL).

Not specified; income-focused.

Priority for veterans, rural residents.

VA Aid and Attendance (A&A) and Housebound Benefits

Kentucky VA Aid and Attendance/Housebound

Age 65+ or disabled veteran/spouse, Kentucky resident, wartime service, need for ADL help (A&A) or homebound.

Net income < ~$1,984/month (veteran with dependent, A&A); pension offsets income.

~$155,356 (net worth limit).

High veteran demand in rural areas.

Who we are

Your Senior Care Partner, Every Step of the Way

We help families find affordable senior communities and unlock same day discounts, Medicaid, and Medicare options tailored to your needs.

Contact us Today