Explore Open Rooms

1 Contact details
2 What type of senior care service are you looking for?
3 What budget do you have in mind for senior care?
4 How soon do you need to find care?
5 Additional details

Thank you for your interest!

Our team will be in touch shortly to help with next steps.

Nursing Home

Cedar Crest Nursing and Rehabilitation Center

Nursing Home

Cedar Crest Nursing and Rehabilitation Center

797 E Fremont Ave, Sunnyvale, CA 94087 View map
Overview of Cedar Crest Nursing and Rehabilitation Center

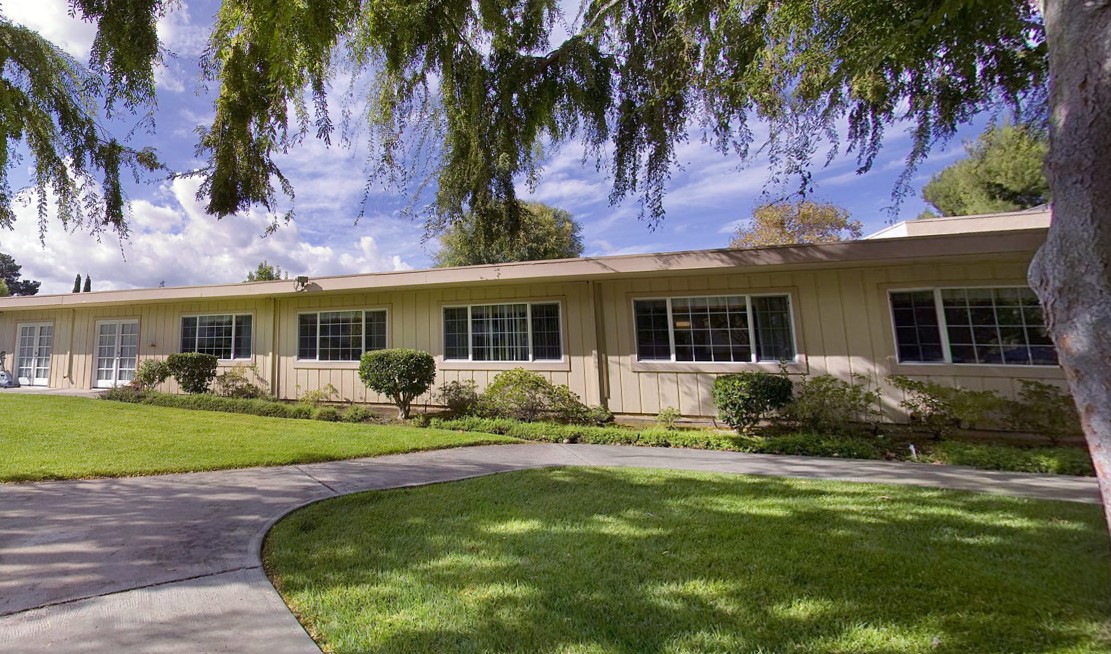
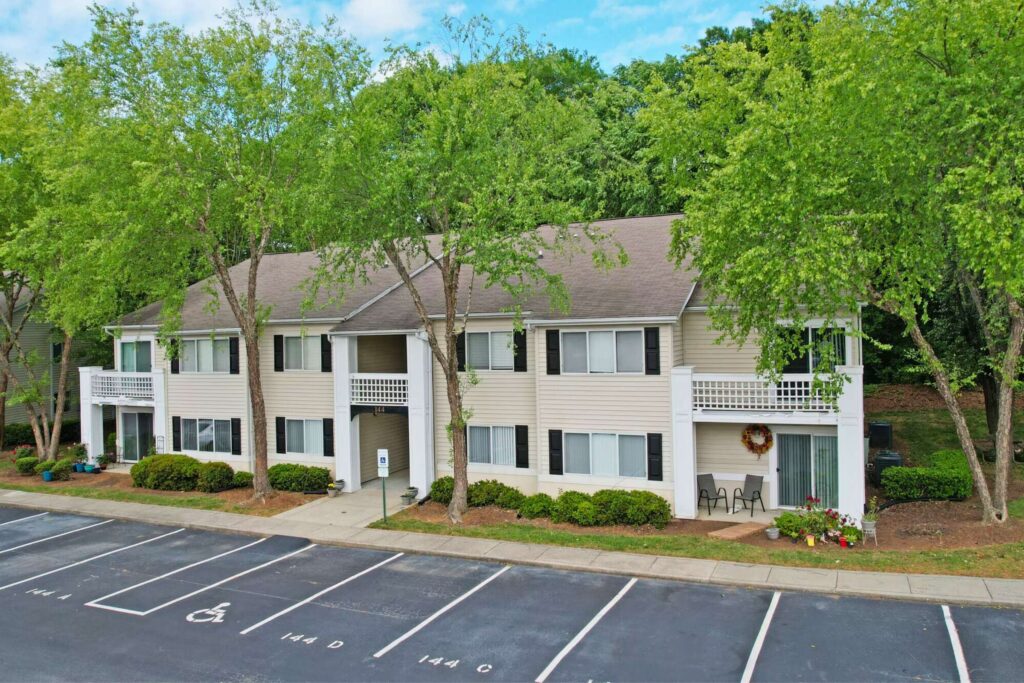
Overlooking the peaceful neighborhood of Sunnyvale, CA, Cedar Crest Nursing and Rehabilitation Center is a respected senior living community that offers excellent skilled nursing and rehabilitation services. The community aims to help residents maintain their functional independence by offering an array of services, including daily living assistance, therapy services, and behavioral health programs for those living with mental health disorders. Residents here enjoy cozy and safe accommodations with easy access to care services and amenities.

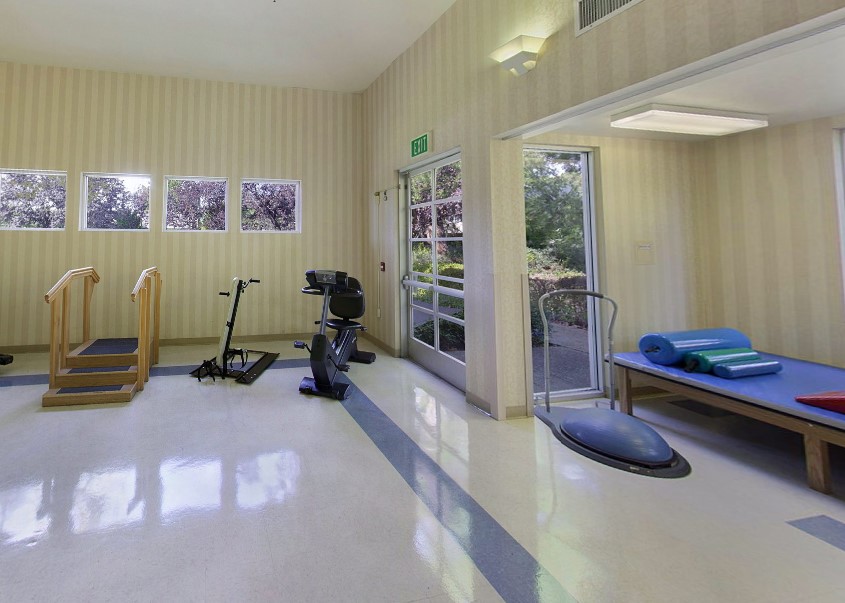
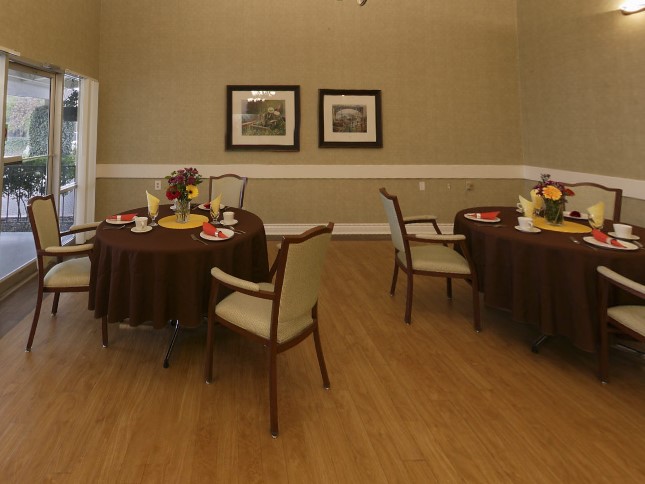
In addition to individualized care plans, residents are also offered meaningful activity programs for their enrichment and entertainment. Three meals and snacks throughout the day are available to make sure residents’ nutritional needs and cravings are satisfied. A multitude of amenities are also available to ensure residents enjoy utmost comfort and convenience during their stay.

(717) 272-6191

Managed by Bethany

Administrator

Bethany is the Administrator at Cedar Crest Nursing and Rehabilitation Center, dedicated to caring for her staff and residents with a warm and professional approach. She ensures her team is well-trained and committed to providing exceptional care, fostering a supportive environment where residents feel valued and at home.

Quality ratings

Measured by Centers for Medicare & Medicaid Services (CMS)

Overall rating Info The Overall CMS Rating combines results from health inspections, staffing levels and quality measures. Health inspections carry the most weight. Staffing and quality scores can increase or decrease the final rating based on performance compared to state and national standards.
5/5
California average: 3.1/5
Health Inspection Info Based on the results of the facility's three most recent standard inspections and any complaint investigations. CMS reviews the number, scope, and severity of deficiencies, with more recent findings weighted more heavily.
4/5
California average: 2.8/5
Staffing Info Measures average nursing staff hours per resident per day, including Registered Nurses (RNs) and total nursing staff. Ratings are adjusted based on the level of care residents require and are compared to state and national benchmarks.
4/5
California average: 3.1/5
Quality Measures Info Based on clinical and physical health indicators reported to CMS, such as hospital readmissions, falls, pressure ulcers, and improvements in mobility. These measures reflect how well residents' health needs are being managed.
5/5
California average: 4.1/5

Nursing care per resident

Info This shows how many total hours of nursing staff time are available per resident each day. Higher numbers usually mean more staff support.
3h 55m per day

This home provides 7% less nursing time per resident than the California average.

California average: 4h 13m per day

Staffing hours breakdown

Info Hours of care per resident per day, broken down by staff type. Data from CMS Medicare.
Staff type Facility State avg National avg
Registered Nurse (RN) Info Registered nurse hours per resident per day. 43m per day 39m per day 41m per day
Nurse Aide Info Nurse aide hours per resident per day. 2h 44m per day 2h 39m per day 2h 21m per day
Total Nursing (Weekend) Info Total number of nurse staff hours per resident per day on weekends. 3h 53m per day 4h 5m per day 3h 26m per day
Physical Therapist Info Physical therapist staff hours per resident per day. 12m per day 5m per day 4m per day
RN (Weekend) Info Registered nurse hours per resident per day on weekends. 24m per day 30m per day 29m per day

Capacity and availability

This home usually has limited availability

Occupancy is moderate, suggesting balanced demand.

Similar demand to the California average
Occupancy rate 88.9%
Residents per day (avg) 84
Occupancy rate
88.9%
Residents per day (avg)
84

Who this home usually serves

TYPE OF STAY

Mostly short-term rehab stays

Most residents typically stay for a few weeks or months before returning home or moving on.

Might be optimal for
Short stays Recovery Medicare-covered care

Breakdown by payment type

Medicare

54% of new residents, usually for short-term rehab.

Typical stay 29 days

Private pay

44% of new residents, often for short stays.

Typical stay 3 - 4 months

Medicaid

2% of new residents, often for long-term daily care.

Typical stay 5 - 6 months

Finances and operations

Privately-owned community
Operated by a business corporation.
Home revenue
$16.6M
Profit
$2.3M
Privately-owned community Operated by a business corporation.
Home revenue
$16,584,993.00
Profit
$2,335,900.00
Payroll costs Info The portion of the home's budget spent on staff, including nurses, caregivers, and other employees who support care and operations.
$8.2M
49.5% of revenue
Other operating costs Info All remaining costs needed to run the home, such as food, utilities, building maintenance, supplies and administrative expenses.
$6.0M
Total costs $14.2M

What does this home offer?

Accepts Medicaid icon

Accept Medicaid: Yes, Accept

Total residents icon

Total Residents: 99 Residents

Housing options icon

Housing Options: Studio / 1 Bed / 2 Bed

Building type icon
Building type icon

Building Type: Single-story

Types of Care at Cedar Crest Nursing and Rehabilitation Center

Nursing Home
Contact Cedar Crest Nursing and Rehabilitation Center

Health Inspection History

Inspections
Total health inspections 3

California average 12.5


Last Health inspection on Aug 2025

Total health citations 32

California average 50.2

Citations per inspection
10.67

California average 4.65


Health citations are formal notices following inspections when they fail to comply with safety and care standards.

31 of 32 citations resulted from standard inspections; and 1 of 32 came from combined inspections (standard and complaint).

Breakdown of citation severity (last 3 years)
Critical Health citations More info 0
100% better than California average

California average: 0.4


Serious Health citations More info 0
100% better than California average

California average: 1

0 critical citations More info California average: 0.4

0 serious citations More info California average: 1

32 moderate citations More info California average: 47.2

0 minor citations More info California average: 1.5
Citations history (last 3 years)
Environmental moderate citation Info Issues related to building safety, cleanliness, maintenance, and overall living conditions. Aug 11, 2025
Corrected

Infection Control moderate citation Info Issues related to preventing and controlling infections, including hygiene practices and safety protocols. Aug 11, 2025
Corrected

Nutrition moderate citation Info Issues related to food quality, meal service, and resident's nutritional needs. Aug 11, 2025
Corrected

Nutrition moderate citation Info Issues related to food quality, meal service, and resident's nutritional needs. Aug 11, 2025
Corrected

Compare Nursing Homes around Sunnyvale The information below is reported by the California Department of Social Services and Department of Public Health.

2 facilities compared · CMS & CA Dept. of Health data · Updated Mar 2026

Cedar Crest Nursing and Rehabilitation Center
AL

Assisted Living A licensed, long-term care setting for seniors or individuals with disabilities who need help with daily activities — like bathing, dressing, and medication management — but not 24-hour skilled nursing. Offers housing, meals, and around-the-clock support while aiming to maximize resident independence.

IL

Independent Living Lifestyle-focused communities for older adults offering dining, activities, and transportation with minimal personal care. Best for active, independent seniors who want community without medical support.

MC

Memory Care Secured, specialized care for people living with Alzheimer's or dementia. Staff trained in cognitive impairment, with higher staff-to-resident ratios and an environment designed to reduce confusion and wandering risk.

NH

Nursing Home Licensed facility providing 24/7 skilled nursing care for residents with complex, ongoing medical needs. Staffed by RNs, LPNs, and CNAs. Inspected and star-rated annually by CMS. Accepts Medicare (short-term rehab) and Medicaid (long-term care).

Sunnyvale (Sunnyarts)
90
88.9%
+5%
3.92
-18%
-7%
0
32
0
84
67
$16,6M
$8,2M
49.5%
555790
Private / Semi-Private Rooms
Crescent Oaks
-
NH

Nursing Home Licensed facility providing 24/7 skilled nursing care for residents with complex, ongoing medical needs. Staffed by RNs, LPNs, and CNAs. Inspected and star-rated annually by CMS. Accepts Medicare (short-term rehab) and Medicaid (long-term care).

AL

Assisted Living A licensed, long-term care setting for seniors or individuals with disabilities who need help with daily activities — like bathing, dressing, and medication management — but not 24-hour skilled nursing. Offers housing, meals, and around-the-clock support while aiming to maximize resident independence.

SUNNYVALE
44
-
-
-
-
-
-
-
-
0
0
0
-
-
-
-
-
-
Studio / 1 Bed / 2 Bed

Places of interest near Cedar Crest Nursing and Rehabilitation Center

Address 1.9 miles from city center

Address 797 E Fremont Ave, Sunnyvale, CA 94087

Calculate Travel Distance to Cedar Crest Nursing and Rehabilitation Center

Add your location

Address

Staffing Data (Q2 2025)

This data corresponds to Q2 2025 and is based on CMS Payroll-Based Journal.

Total staff 142
Employees 142
Contractors 0
Staff to resident ratio 1.75:1
1752986% better than California average

California average ratio: 0.00:1

Avg staff/day 68
Average shift 7.2 hours
6% worse than California average

California average: 7.7 hours

Total staff hours (quarter) 44,739
Nursing staff breakdown
Registered Nurse

Manages medical care and health needs.

Total count 10
Average shift length Info Average shift length. Calculated as total hours divided by days worked and average staff per day. 7.2 hours

No contractors work on this role.

Licensed Practical Nurse

Assists with medical care and medications.

Total count 21
Average shift length Info Average shift length. Calculated as total hours divided by days worked and average staff per day. 7.6 hours

No contractors work on this role.

Certified Nursing Assistant

Helps with daily care and mobility.

Total count 66
Average shift length Info Average shift length. Calculated as total hours divided by days worked and average staff per day. 7 hours

No contractors work on this role.

Contractor staffing

Total hours from contractors

0%

0 contractor hours this quarter

No contractor roles were reported this quarter.

Staff by category
Certified Nursing Assistant6606620,77591100%7
Licensed Practical Nurse210216,99391100%7.6
Registered Nurse100103,32691100%7.2
Physical Therapy Assistant120122,0048391%7.6
Clinical Nurse Specialist4041,8978998%7.5
Respiratory Therapy Technician4041,4237380%7.4
RN Director of Nursing3031,3816875%8
Other Dietary Services Staff4041,1838796%7.6
Therapeutic Recreation Specialist3039986571%7.5
Mental Health Service Worker2029846470%8
Speech Language Pathologist2029646774%7.6
Dental Services Staff1015326369%8.5
Nurse Practitioner1015126470%8
Physical Therapy Aide3034915864%5.9
Administrator1014886167%8
Qualified Social Worker4044286571%4.4
Dietitian1013604549%8
66 Certified Nursing Assistant
% of Days 100%
21 Licensed Practical Nurse
% of Days 100%
10 Registered Nurse
% of Days 100%
12 Physical Therapy Assistant
% of Days 91%
4 Clinical Nurse Specialist
% of Days 98%
4 Respiratory Therapy Technician
% of Days 80%
3 RN Director of Nursing
% of Days 75%
4 Other Dietary Services Staff
% of Days 96%
3 Therapeutic Recreation Specialist
% of Days 71%
2 Mental Health Service Worker
% of Days 70%
2 Speech Language Pathologist
% of Days 74%
1 Dental Services Staff
% of Days 69%
1 Nurse Practitioner
% of Days 70%
3 Physical Therapy Aide
% of Days 64%
1 Administrator
% of Days 67%
4 Qualified Social Worker
% of Days 71%
1 Dietitian
% of Days 49%

Facility Characteristics

Source: CMS Long-Term Care Facility Characteristics (Data as of Jan 2026)

Total census
81 residents
Residents by payment source
Medicare
28 residents (34.6%)
Medicaid
34 residents (42%)
Private pay or other
19 residents (23.5%)
Programs & Services
Residents' Group

Residents meet regularly to discuss policies, care quality, and activities

Nurse Aide Training

State-approved Nurse Aide Training and Competency Evaluation Program on-site

Active Resident Council

Organized group of residents that meets regularly to discuss facility policies, quality of life, and activities.

Quality of care over time

These measures show how residents usually do over time at this home, based on health outcomes and preventive care.

High-risk clinical events score Info A composite score based on pressure ulcers, falls with injury, weight loss, walking ability decline, and activities of daily living decline. 4.3
35% better than California average

California average: 6.6

Functional decline score Info A composite score based on activities of daily living decline, walking ability decline, and incontinence. 11.7
In line with California average

California average: 11.3

Long-stay resident measures
Significantly above average California avg: 4.3 Info CMS star rating based on long-stay quality measure performance. 5 stars = significantly above average, 1 star = significantly below average.
Need for Help with Daily Activities Increased Info Percent of long-stay residents whose need for help with daily activities has increased 6.9%
38% better than California average

California average: 11.1%

Walking Ability Worsened Info Percent of long-stay residents whose ability to move independently worsened 8.7%
27% better than California average

California average: 12.0%

Low Risk Residents with Bowel/Bladder Incontinence Info Percent of low risk long-stay residents who lose control of their bowels or bladder 19.5%
73% worse than California average

California average: 11.3%

Falls with Major Injury Info Percent of long-stay residents experiencing one or more falls with major injury 1.7%
5% worse than California average

California average: 1.7%

High Risk Residents with Pressure Ulcers Info Percent of long-stay high risk residents with pressure ulcers 2.3%
54% better than California average

California average: 5.0%

Urinary Tract Infection Info Percent of long-stay residents with a urinary tract infection 0.0%
100% better than California average

California average: 1.2%

Lost Too Much Weight Info Percent of long-stay residents who lose too much weight 1.8%
57% better than California average

California average: 4.2%

Depressive Symptoms Info Percent of long-stay residents who have depressive symptoms 1.2%
82% better than California average

California average: 6.7%

Antipsychotic Use Info Percent of long-stay residents who received an antipsychotic medication 6.6%
35% better than California average

California average: 10.1%

Pneumococcal Vaccine Info Percent of long-stay residents assessed and appropriately given the pneumococcal vaccine 100.0%
In line with California average

California average: 98.5%

Influenza Vaccine Info Percent of long-stay residents assessed and appropriately given the seasonal influenza vaccine 100.0%
In line with California average

California average: 98.2%

Hospitalizations per 1,000 days Info Number of hospitalizations per 1,000 long-stay resident days. 3.20
42% worse than California average

California average: 2.25

ED visits per 1,000 days Info Number of outpatient emergency department visits per 1,000 long-stay resident days. 1.11
30% better than California average

California average: 1.59

Short-stay resident measures
Significantly above average California avg: 3.5 Info CMS star rating based on short-stay quality measure performance. 5 stars = much above average, 1 star = much below average.
Pneumococcal Vaccine Info Percent of short-stay residents assessed and appropriately given the pneumococcal vaccine 99.7%
6% better than California average

California average: 94.0%

Antipsychotic medication increase Info Percent of short-stay residents who newly received an antipsychotic medication 1.1%
28% better than California average

California average: 1.5%

Influenza Vaccine Info Percent of short-stay residents assessed and appropriately given the seasonal influenza vaccine 100.0%
7% better than California average

California average: 93.2%

Re-hospitalized after SNF stay Info Percentage of short-stay residents who were re-hospitalized after their nursing home admission. 19.7%
15% better than California average

California average: 23.2%

Emergency department visits Info Percentage of short-stay residents who had an outpatient emergency department visit. 7.8%
30% better than California average

California average: 11.2%

Falls with major injury Info Percentage of SNF residents who experience falls with major injury during their stay. 0.3%
57% better than California average

California average: 0.8%

Ability to care for self at discharge Info Percentage of residents at or above expected ability to care for themselves at discharge. 46.9%
13% worse than California average

California average: 53.7%

Successful return to home or community Info Rate of successful return to home or community from a skilled nursing facility. 64.9%
28% better than California average

California average: 50.6%

Guides for Better Senior Living

Care Cost Calculator: See Prices in Your Area

Nursing Home Data Explorer

Don’t Wait Too Long: 7 Red Flag Signs Your Parent Needs Assisted Living Now

The True Cost of Assisted Living in 2025 – And How Families Are Paying For It

Understanding Senior Living Costs: Pricing Models, Discounts & Financial Assistance

Financial Aid for California Seniors

Get financial aid guidance

Multipurpose Senior Services Program

MSSP (Medi-Cal Waiver)

Age 65+, California resident, Medi-Cal eligible, nursing home risk.

~$2,829/month (300% FBR, individual).

$2,000 (individual), $3,000 (couple).

County-managed; waitlists possible.

In-Home Supportive Services (IHSS)

California IHSS

Age 65+, California resident, Medicaid-eligible or low-income.

~$1,732/month (individual, Medi-Cal threshold).

$2,000 (individual).

Can hire family as caregivers.

Multipurpose Senior Services Program (MSSP)

CA MSSP

Age 65+, California resident, Medi-Cal-eligible, nursing home-eligible but community-capable.

~$2,829/month (300% FBR, individual).

$2,000 (individual).

Available in 38 counties; waitlists common.

Property Tax Postponement Program (PTP)

CA PTP

Age 62+, California resident, own and live in home, 40% equity.

~$51,500/year (household, adjusted annually).

Equity-based; no strict asset cap.

Deferred taxes accrue interest (5% as of 2024); repaid upon sale/death.

Assisted Living Waiver (ALW)

CA ALW

Age 65+ or disabled, California resident, Medi-Cal-eligible, nursing home-eligible.

~$2,829/month (300% FBR, individual).

$2,000 (individual).

Available in 15 counties (e.g., LA, Sacramento); waitlists common.

California CARES Program

CA CARES

Caregivers of California residents 60+ needing help with 3+ daily activities; no caregiver age limit.

No strict limit; cost-sharing above ~$2,500/month threshold.

Not applicable; need-based.

High demand in urban areas; complements IHSS respite.

Low-Income Home Energy Assistance Program (LIHEAP)

CA LIHEAP

Age 60+ priority, California resident, low-income, utility/heating need.

~$2,510/month (200% of poverty level, individual).

Not applicable; income-focused.

High demand in inland/coastal extremes; weatherization capped at $5,000/home.