


Total staff
115
Employees
89
Contractors
26
Delaney Park Health and Rehabilitation Center is located on Annie Street in Portland. The facility is surrounded by hospitals, which provides reassurance and accessibility in case of emergencies. For 40 years, it has been a trusted provider of healthcare services, offering post-acute care, skilled nursing care, rehabilitation programs, restorative programs, respite care, and palliative care.
The area is also perfect for those who want to relax and maintain an active lifestyle. At Delaney Park, they believe that every patient is unique, and they strive to personalize treatment plans accordingly. They put a lot of effort into providing high-quality care, as they cherish the trust that their patients and their families have in them.
| Staff type | Hours / Day / Resident | vs state avg |
|---|---|---|
|
Registered Nurse (RN)
| 56m per day | ▲ 28% State avg: 44m per day · National avg: 41m per day |
|
LPN / LVN
| 30m per day | ▼ 36% State avg: 47m per day · National avg: 52m per day |
|
Nurse Aide
| 2h 2m per day | ▼ 13% State avg: 2h 20m per day · National avg: 2h 21m per day |
|
Weekend Total Nursing
| 3h 5m per day | ▼ 12% State avg: 3h 31m per day · National avg: 3h 26m per day |
|
Physical Therapist
| 5m per day | ■ Avg State avg: 5m per day · National avg: 4m per day |
|
Weekend RN
| 43m per day | ▲ 34% State avg: 32m per day · National avg: 29m per day |
Reporting period: October 1 – December 31, 2025 (Q4 2025). Source: CMS Payroll-Based Journal report.
Manages medical care and health needs.
Assists with medical care and medications.
Helps with daily care and mobility.
Total hours from contractors
6,507 contractor hours this quarter
| Certified Nursing Assistant | 44 | 0 | 44 | 15,436 | 92 | 100% | 7.7 |
| Registered Nurse | 23 | 1 | 24 | 4,881 | 92 | 100% | 7.7 |
| Licensed Practical Nurse | 9 | 0 | 9 | 3,354 | 92 | 100% | 8.3 |
| Speech Language Pathologist | 0 | 5 | 5 | 1,731 | 91 | 99% | 6.4 |
| Clinical Nurse Specialist | 4 | 0 | 4 | 1,565 | 76 | 83% | 9.1 |
| Physical Therapy Aide | 0 | 7 | 7 | 1,558 | 92 | 100% | 7.4 |
| Physical Therapy Assistant | 0 | 3 | 3 | 1,189 | 90 | 98% | 6.6 |
| Qualified Social Worker | 0 | 3 | 3 | 863 | 79 | 86% | 6.6 |
| Nurse Practitioner | 2 | 0 | 2 | 680 | 60 | 65% | 8 |
| Respiratory Therapy Technician | 0 | 4 | 4 | 628 | 76 | 83% | 6.9 |
| Dietitian | 1 | 0 | 1 | 508 | 60 | 65% | 8.5 |
| RN Director of Nursing | 1 | 0 | 1 | 466 | 59 | 64% | 7.9 |
| Administrator | 1 | 0 | 1 | 464 | 58 | 63% | 8 |
| Mental Health Service Worker | 1 | 0 | 1 | 464 | 58 | 63% | 8 |
| Therapeutic Recreation Specialist | 0 | 1 | 1 | 458 | 59 | 64% | 7.8 |
| Occupational Therapy Aide | 1 | 0 | 1 | 216 | 27 | 29% | 8 |
| Other Dietary Services Staff | 2 | 0 | 2 | 204 | 28 | 30% | 7.3 |
| Occupational Therapy Assistant | 0 | 1 | 1 | 41 | 8 | 9% | 5.1 |
| Medical Director | 0 | 1 | 1 | 3 | 3 | 3% | 1 |
Federal penalties imposed by CMS for regulatory violations, including civil money penalties (fines) and denials of payment for new Medicare/Medicaid admissions.
Source: CMS Penalties Database (Data as of Jan 2026)
Florida average: $72K
Florida average: 2.6
Florida average: 0.1
No penalties in the past 3 years
No civil money penalties or payment denials were reported in the last 3 years.
These measures show how residents usually do over time at this home, based on health outcomes and preventive care.
Florida average: 7.4
Florida average: 12.4
Florida average: 10.5%
Florida average: 12.9%
Florida average: 13.5%
Florida average: 2.6%
Florida average: 5.4%
Florida average: 0.9%
Florida average: 6.0%
Florida average: 3.3%
Florida average: 8.0%
Florida average: 97.7%
Florida average: 99.2%
Florida average: 2.10
Florida average: 1.18
Florida average: 94.0%
Florida average: 1.5%
Florida average: 94.7%
Florida average: 26.2%
Florida average: 9.3%
Florida average: 0.8%
Florida average: 53.7%
Florida average: 50.6%
Quality measures are calculated from Minimum Data Set (MDS) assessments. For most measures, lower percentages indicate better care quality.
48% of new residents, usually for short-term rehab.
48% of new residents, often for short stays.
4% of new residents, often for long-term daily care.
Source: CMS Long-Term Care Facility Characteristics (Data as of Jan 2026)
Residents meet regularly to discuss policies, care quality, and activities
Family members meet regularly to discuss policies, care quality, and activities
Organized group of family members that meets regularly to discuss facility policies, resident care, and activities.
Organized group of residents that meets regularly to discuss facility policies, quality of life, and activities.
Data sourced from CMS Long-Term Care Facility Characteristics quarterly report. Payer mix reflects the current resident census by primary payment source.
Historical financial and operational data for Delaney Park Health and Rehabilitation Center from 2012–2024, based on CMS SNF Cost Reports.
Key figures below are for fiscal year ending in 01/2024.
Based on CMS SNF Cost Report for fiscal year ending in 01/2024.
This home supports both short-term rehab and long-term care, with residents staying for a wide range of durations.
New residents most often arrive under Medicare (48% of admissions), and a typical Medicare stay runs around 25 days.
Coverage residents most often arrive under.
Coverage residents most often leave under.
![]() 0.6 miles from city center
0.6 miles from city center
![]() Estimated distance in miles from Orlando's city center to Delaney Park Health and Rehabilitation Center's address, calculated via Google Maps.
Estimated distance in miles from Orlando's city center to Delaney Park Health and Rehabilitation Center's address, calculated via Google Maps.
Add your location
Info below is compiled from CMS reports & the FL Agency for Health Care Administration (AHCA), senior community websites & trusted data sources such as Walk Score & BBB.
Communities are listed from highest to lowest based on our ranking methodology.
| Westminster Baldwin Park | NH AL IL MC SNF | Orlando (Northeast Orlando) | 24
Facility
24
FL AVG
88
Rank
#858 / 1058 | - | - | 4.90
Facility
4.90
FL AVG
4.04
Rank
#26 / 181 | +80% | +21% | $0
Facility
$0
FL AVG
$78.9k
Rank
#1 / 185 | - | 15
Facility
15
FL AVG
19.7
Rank
#68 / 181 | 5.0
Facility
5.0
FL AVG
4.5
Rank
#118 / 181 | - | 18 | - |
26
Facility
26
FL AVG
40
Rank
#977 / 1487 | Presbyterian Retirement Communities, Inc | $4.7MFiscal year ending 03/2024
Facility
$4.7MFiscal year ending 03/2024
FL AVG
$15.7M
Rank
#163 / 184 | $3.5MFiscal year ending 03/2024
Facility
$3.5MFiscal year ending 03/2024
FL AVG
$6.1M
Rank
#172 / 184 | 73.9%Fiscal year ending 03/2024
Facility
73.9%Fiscal year ending 03/2024
FL AVG
39.8%
Rank
#151 / 184 | 106118 | ||||
| South Orange Health and Rehabilitation Center | NH HOS RC SNF | Orlando (Southeast Orlando) | 115
Facility
115
FL AVG
88
Rank
#340 / 1058 |
92.0%
Facility
92.0%
FL AVG
84.4
Rank
#56 / 125 | +9% | 4.82
Facility
4.82
FL AVG
4.04
Rank
#31 / 181 | -7% | +19% | $14.4k
Facility
$14.4k
FL AVG
$78.9k
Rank
#132 / 185 | - | 15
Facility
15
FL AVG
19.7
Rank
#68 / 181 | 3.0
Facility
3.0
FL AVG
4.5
Rank
#39 / 181 | - | 106 | - |
60
Facility
60
FL AVG
40
Rank
#351 / 1487 | Orlando Fl Holdco LLC | $8.7M*Fiscal year ending 12/2022These figures are from this home's most recent complete cost report — an older period than most facilities report. Compare with that in mind.
Facility
$8.7M*Fiscal year ending 12/2022These figures are from this home's most recent complete cost report — an older period than most facilities report. Compare with that in mind.
FL AVG
$15.7M
Rank
#170 / 184 | $4.7M*Fiscal year ending 12/2022These figures are from this home's most recent complete cost report — an older period than most facilities report. Compare with that in mind.
Facility
$4.7M*Fiscal year ending 12/2022These figures are from this home's most recent complete cost report — an older period than most facilities report. Compare with that in mind.
FL AVG
$6.1M
Rank
#145 / 184 | 54.5%*Fiscal year ending 12/2022These figures are from this home's most recent complete cost report — an older period than most facilities report. Compare with that in mind.
Facility
54.5%*Fiscal year ending 12/2022These figures are from this home's most recent complete cost report — an older period than most facilities report. Compare with that in mind.
FL AVG
39.8%
Rank
#4 / 184 | 105546 | ||||
| The Towers Orlando | NH AL IL SNF | Orlando (Central Business District) | 168
Facility
168
FL AVG
88
Rank
#96 / 1058 |
88.0%
Facility
88.0%
FL AVG
84.4
Rank
#77 / 125 | +4% | 4.09
Facility
4.09
FL AVG
4.04
Rank
#76 / 181 | +71% | +1% | $0
Facility
$0
FL AVG
$78.9k
Rank
#1 / 185 | - | 11
Facility
11
FL AVG
19.7
Rank
#42 / 181 | 2.8
Facility
2.8
FL AVG
4.5
Rank
#34 / 181 | - | 148 | - |
96
Facility
96
FL AVG
40
Rank
#11 / 1487 | Orlando Lutheran Towers, Inc | $15.9MFiscal year ending 12/2023
Facility
$15.9MFiscal year ending 12/2023
FL AVG
$15.7M
Rank
#73 / 184 | $11.1MFiscal year ending 12/2023
Facility
$11.1MFiscal year ending 12/2023
FL AVG
$6.1M
Rank
#46 / 184 | 70%Fiscal year ending 12/2023
Facility
70%Fiscal year ending 12/2023
FL AVG
39.8%
Rank
#57 / 184 | 105731 | ||||
| Solaris Healthcare Celebration | NH SNF | Kissimmee (Green Project) | 120
Facility
120
FL AVG
88
Rank
#253 / 1058 |
95.0%
Facility
95.0%
FL AVG
84.4
Rank
#17 / 125 | +13% | 3.88
Facility
3.88
FL AVG
4.04
Rank
#104 / 181 | +44% | -4% | $0
Facility
$0
FL AVG
$78.9k
Rank
#1 / 185 | - | 16
Facility
16
FL AVG
19.7
Rank
#78 / 181 | 5.3
Facility
5.3
FL AVG
4.5
Rank
#127 / 181 | - | 114 | - |
13
Facility
13
FL AVG
40
Rank
#1204 / 1487 | Celebration Snf Operations Holdings LLC | $16.1M*Fiscal year ending 12/2022These figures are from this home's most recent complete cost report — an older period than most facilities report. Compare with that in mind.
Facility
$16.1M*Fiscal year ending 12/2022These figures are from this home's most recent complete cost report — an older period than most facilities report. Compare with that in mind.
FL AVG
$15.7M
Rank
#94 / 184 | $8.7M*Fiscal year ending 12/2022These figures are from this home's most recent complete cost report — an older period than most facilities report. Compare with that in mind.
Facility
$8.7M*Fiscal year ending 12/2022These figures are from this home's most recent complete cost report — an older period than most facilities report. Compare with that in mind.
FL AVG
$6.1M
Rank
#88 / 184 | 54.2%*Fiscal year ending 12/2022These figures are from this home's most recent complete cost report — an older period than most facilities report. Compare with that in mind.
Facility
54.2%*Fiscal year ending 12/2022These figures are from this home's most recent complete cost report — an older period than most facilities report. Compare with that in mind.
FL AVG
39.8%
Rank
#84 / 184 | 106127 | ||||
| Delaney Park Health and Rehabilitation Center | NH PC RC SNF | Orlando (Lake Copeland) | 89
Facility
89
FL AVG
88
Rank
#534 / 1058 |
93.0%
Facility
93.0%
FL AVG
84.4
Rank
#45 / 125 | +10% | 3.02
Facility
3.02
FL AVG
4.04
Rank
#181 / 181 | +73% | -25% | $0
Facility
$0
FL AVG
$78.9k
Rank
#1 / 185 | - | 23
Facility
23
FL AVG
19.7
Rank
#121 / 181 | 4.6
Facility
4.6
FL AVG
4.5
Rank
#105 / 181 | 2 | 83 | - |
66
Facility
66
FL AVG
40
Rank
#262 / 1487 | Matthew Mines | $12.2MFiscal year ending 01/2024
Facility
$12.2MFiscal year ending 01/2024
FL AVG
$15.7M
Rank
#131 / 184 | $5.5MFiscal year ending 01/2024
Facility
$5.5MFiscal year ending 01/2024
FL AVG
$6.1M
Rank
#123 / 184 | 45.1%Fiscal year ending 01/2024
Facility
45.1%Fiscal year ending 01/2024
FL AVG
39.8%
Rank
#62 / 184 | 105791 |
Delaney Park Health and Rehabilitation Center is located in Orlando, Florida.
Here are the financial assistance programs available to residents in Florida.
Delaney Park Health and Rehabilitation Center is in the Lake Copeland neighborhood.
Delaney Park Health and Rehabilitation Center has a walk score of 66. Moderately walkable. Some errands can be accomplished on foot, with a mix of nearby amenities.
Delaney Park Health and Rehabilitation Center's occupancy is 90.9%.
No, Delaney Park Health and Rehabilitation Center has a no-pet policy.
Delaney Park Health and Rehabilitation Center is registered as a non-profit.
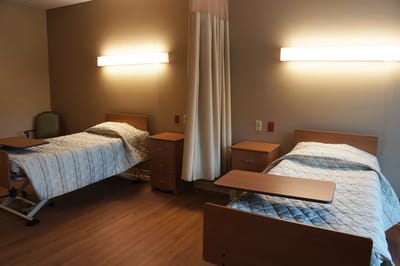
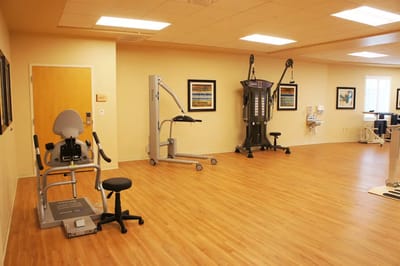
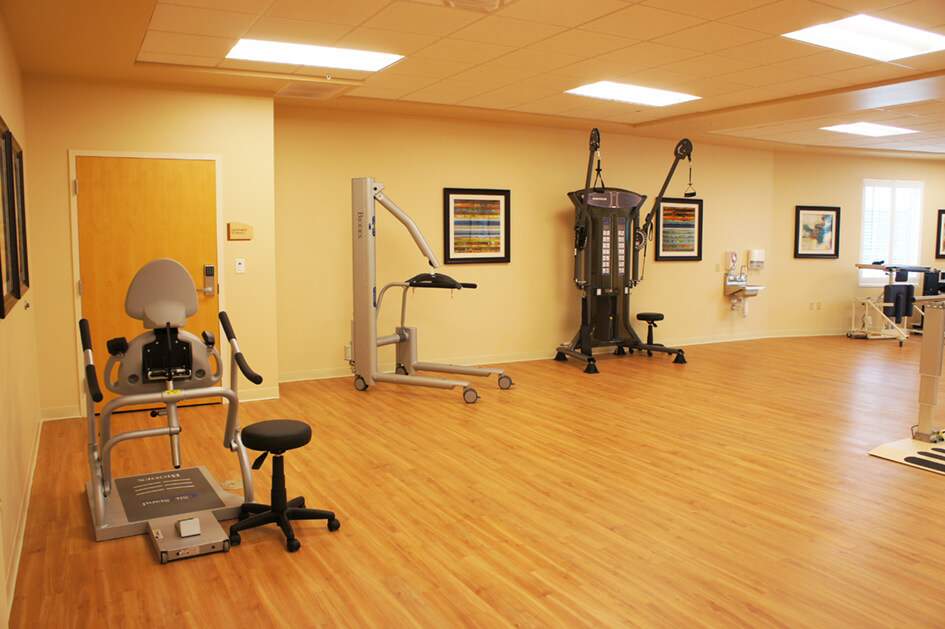
Yes — there are 5 photos of Delaney Park Health and Rehabilitation Center in the photo gallery on this page.
Delaney Park Health and Rehabilitation Center is located at 215 Annie St, Orlando, FL 32806.
Care Cost Calculator: See Prices in Your Area
Nursing Home Data Explorer
Don’t Wait Too Long: 7 Red Flag Signs Your Parent Needs Assisted Living Now
The True Cost of Assisted Living in 2025 – And How Families Are Paying For It
Understanding Senior Living Costs: Pricing Models, Discounts & Financial Assistance


