Dover Nursing and Rehabilitation Center

Nursing Home
Overview of Dover Nursing and Rehabilitation Center

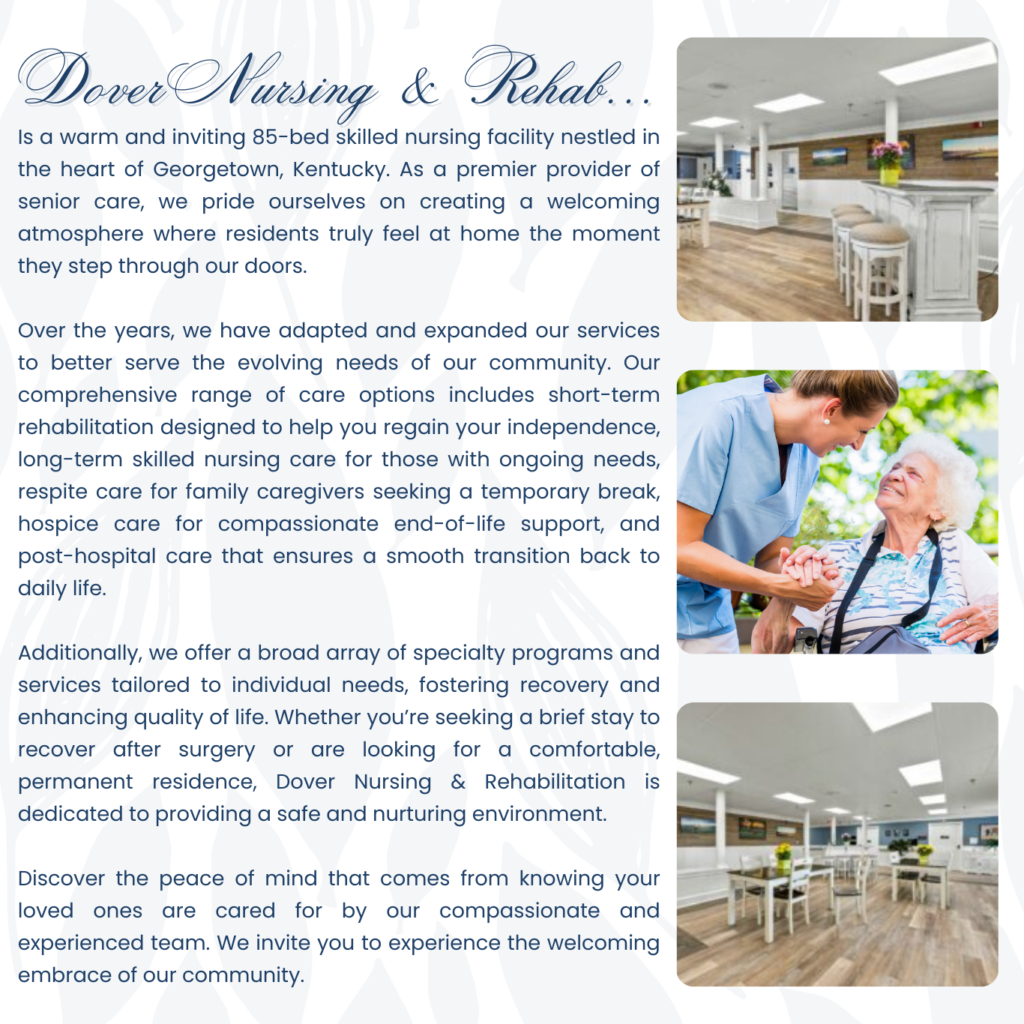
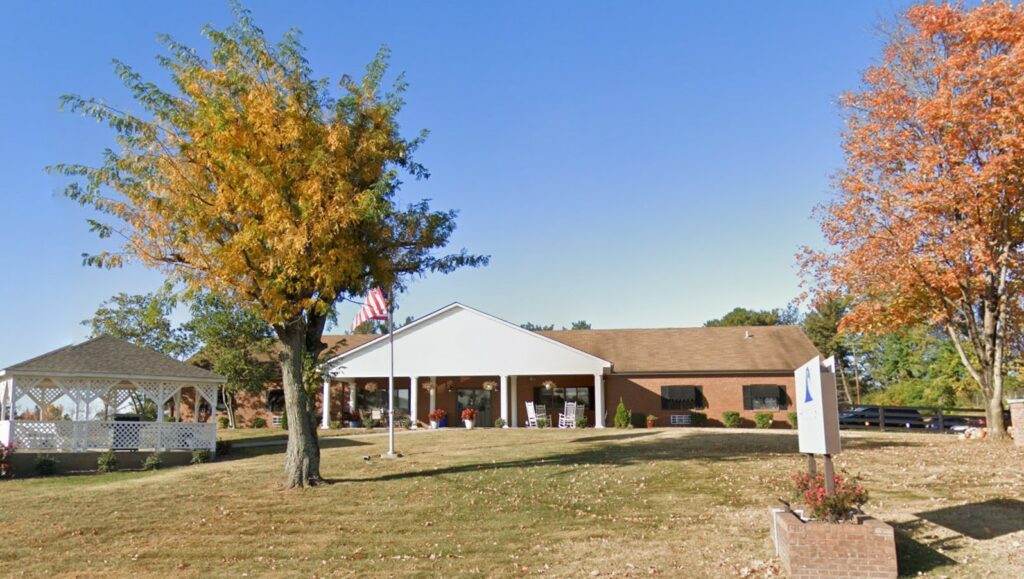
Dover Nursing and Rehabilitation Center, situated in the heart of Georgetown, Kentucky, is a haven for seniors searching for compassionate care and a nurturing environment. The center’s devoted staff, well-versed in senior care, ensures that each individual receives personalized attention. Offering a spectrum of services, from rehabilitation to long-term care, Dover Nursing and Rehabilitation Center caters to the diverse needs of its residents. Dover Nursing and Rehabilitation Center promotes a vibrant and fulfilling lifestyle, from therapeutic exercises to social gatherings. Known as Harborview Dover, this facility is central in Georgetown, ensuring accessibility for families and loved ones. Whether residents are recovering from an illness or embracing their golden years, they discover solace within the embrace of these walls. 
In the heart of the Bluegrass State, Dover Nursing and Rehabilitation Center stands as a testament to the enduring spirit of seniors. It transcends being merely a facility where cherished memories are created, laughter resonates through the hallways, and meaningful bonds form across generations. With its 85 certified beds, this skilled nursing facility provides a sanctuary where residents can thrive. The legacy of this community extends beyond its physical structure; it embodies a commitment to dignity, respect, and holistic well-being. Families place their trust in the staff’s capable hands, confident that every interaction is guided by compassion and professionalism. Within its warm and inviting atmosphere, a sense of community flourishes, fostering the growth of friendships and sharing life stories. As sunlight filters through the windows, illuminating cozy common areas, residents actively engage in activities that enrich their lives.

(502) 863-9529

Quality ratings

Measured by Centers for Medicare & Medicaid Services (CMS)

Overall rating Info Official CMS rating based on health inspections, staffing and quality measures.
1/5
Kentucky average: 2.8/5
Health Inspection Info Official CMS rating based on deficiencies found during state health inspections.
2/5
Kentucky average: 2.9/5
Staffing Info Official CMS rating based on nurse staffing hours per resident per day.
1/5
Kentucky average: 2.7/5
Quality Measures Info Official CMS rating based on clinical outcomes for residents.
2/5
Kentucky average: 2.9/5

Nursing care per resident

Info Average daily nursing hours per resident (adjusted for acuity). Higher values indicate more nursing time per resident.
3h 18m per day

This home provides 12% less nursing time per resident than the state average.

Kentucky average: 3h 45m per day

Staffing hours breakdown

Info Hours of care per resident per day, broken down by staff type. Data from CMS Medicare.
Staff type Facility State avg National avg
Registered Nurse (RN) Info Registered nurse hours per resident per day. 32m per day 46m per day 41m per day
LPN / LVN Info Licensed Practical Nurse / Licensed Vocational Nurse hours per resident per day. 52m per day 49m per day 52m per day
Nurse Aide Info Nurse aide hours per resident per day. 2h 29m per day 2h 25m per day 2h 21m per day
Total Nursing (Weekend) Info Total number of nurse staff hours per resident per day on weekends. 3h 32m per day 3h 29m per day 3h 26m per day
Physical Therapist Info Physical therapist staff hours per resident per day. 1m per day 4m per day 4m per day
RN (Weekend) Info Registered nurse hours per resident per day on weekends. 19m per day 31m per day 29m per day

Capacity and availability

Smaller home

May offer a more intimate, personalized care environment.

Total beds 85

This home usually has limited availability

Occupancy is moderate, suggesting balanced demand.

Similar demand to the Kentucky average
Occupancy rate 92.4%
Residents per day (avg) 79
Occupancy rate
92.4%
Residents per day (avg)
79

Who this home usually serves

TYPE OF STAY

Mix of rehab and long-term care

This home supports both short-term rehab and long-term care, with residents staying for a wide range of durations.

Breakdown by payment type

Medicare

34% of new residents, usually for short-term rehab.

Typical stay 1 - 2 months

Private pay

57% of new residents, often for short stays.

Typical stay 1 - 2 months

Medicaid

8% of new residents, often for long-term daily care.

Typical stay 4 - 5 years

Finances and operations

Proprietary home
Partnership
Home revenue
$10.6M
Operating loss
-$217.1K
Proprietary home Partnership
Home revenue
$10,620,298.00
Operating loss
$-217,141.00
Payroll costs Info The portion of the home's budget spent on staff, including nurses, caregivers, and other employees who support care and operations.
$3.6M
33.5% of revenue
Other operating costs Info All remaining costs needed to run the home, such as food, utilities, building maintenance, supplies and administrative expenses.
$7.3M
Total costs $10.8M
Bed community size
85-bed community
A larger shared setting that may offer more common spaces and organized community services.
Walk Score
Walk Score: 33 / 100
Somewhat walkable. A few nearby services may be reachable on foot, but most trips require transportation.

About this community

License Status
Active
Facility Type
Long Term Care (Nursing Facility)
License Date
July 1, 2025
License Expiration
June 30, 2026

Additional licensing details

License number: 100480
County: SCOTT

Ownership & operating entity

Dover Nursing and Rehabilitation Center is legally operated by DOVER MANOR OPERATIONS, LLC, and administrated by SHANNON.

Type Of Units

NF (Nursing Facility)
85 units
Total beds
85 units

Safety & Compliance

Care Services

Nursing Services
Rehabilitation Services
Respite Care
Skilled Nursing
Licensed Nurses/CNAs

All Levels of Care

Rehabilitation
Skilled Nursing
Long-Term Care
Respite

Additional Policies & Features

Pets Allowed
Housekeeping: Yes
Linen Service: Yes

Amenities & Lifestyle

Ambulance & transportation
Beauty/barber salon
Cable & phone
Complimentary Wi-Fi
Computer access
Conference room
Daily activities
Dental
podiatry
optometry
& audiology services
Electronic security system
Family/resident lounges
Furnished private & semi-private rooms
Group outings
Housekeeping
linen
& laundry services
Library
Mobile garden
On-site religious services
Outdoor courtyard
Oxygen services
Personal and medical supplies
Pet friendly
Pharmacy
State-of-the-art therapy equipment
X-ray and laboratory services

Programs & Activities

Specific Programs
Rehabilitation, Skilled Nursing, Long-Term Care, Respite
Religious Services
Yes
Operating Hours
Open visiting hours

Types of Care at Dover Nursing and Rehabilitation Center

Respite Care Hospice Care Nursing Home
Contact Dover Nursing and Rehabilitation Center

Compare Nursing Homes around Georgetown

The information below is reported by the Kentucky Cabinet for Health and Family Services, Office of Inspector General.
Dover Nursing and Rehabilitation Center
SNF

Nursing Home 24/7 care needed

HC

Hospice Care

MC

Memory Care Specialized care for those with Memory Loss, Alzheimer's, or dementia, ensuring safety and support.

RC

Respite Care

Georgetown
85
No
33
DOVER MANOR OPERATIONS, LLC
92.4%
$10,620,285.00
$3,554,071.00
33.5%
78.60
1/5
3.2975
2/5
1/5
2/5
4
29
1
-31%
-12%
+14%

Places of interest near Dover Nursing and Rehabilitation Center

Address 1.9 miles from city center — 2.41 miles to nearest hospital (Fresenius Medical Care at Georgetown (Contract Termed 4/30))

Address 112 Dover Dr, Georgetown, KY 40324

Calculate Travel Distance to Dover Nursing and Rehabilitation Center

Add your location

Address

Staffing Data

Source: CMS Payroll-Based Journal (Q2 2025)

139
Total Staff
124
Employees
15
Contractors
32,124
Total Hours (Quarter)
40
Avg Staff/Day
8.8
Avg Shift (hrs)
Nursing Staff Breakdown
Role Count Avg Shift (hrs) Uses Contractors?
Registered Nurse1010.2 No
Licensed Practical Nurse248.5 No
Certified Nursing Assistant689.2 No
Staff by Category
Administration
2 staff
7.2hs shift avg
Nursing Staff
114 staff
9.1hs shift avg
Physicians & Practitioners
4 staff
8hs shift avg
Therapy Services
12 staff
5.2hs shift avg
Activities & Recreation
0 staff
0hs shift avg
Social Services
2 staff
7.8hs shift avg
Dietary Services
4 staff
8.1hs shift avg
Other Services
1 staff
7.2hs shift avg
Contractor Analysis
4.9%
of total hours from contractors
1,589 contractor hours this quarter
Physical Therapy Aide: 1 Qualified Social Worker: 2 Respiratory Therapy Technician: 3 Speech Language Pathologist: 2 Physical Therapy Assistant: 4 Occupational Therapy Assistant: 1 Medical Director: 1 Occupational Therapy Aide: 1
Role Employees Contractors Total Staff Total Hours Days Worked % of Days Avg Shift (hrs)
Certified Nursing Assistant6806817,33491100%9.2
Licensed Practical Nurse240245,12291100%8.5
Registered Nurse100102,02491100%10.2
Other Dietary Services Staff4041,3977380%8.1
RN Director of Nursing4041,1996875%7.7
Medication Aide/Technician8081,0406875%11.3
Clinical Nurse Specialist3031,0006470%8
Administrator1015126470%8
Nurse Practitioner1015126470%8
Qualified Social Worker0225066571%7.8
Speech Language Pathologist0224736268%7.6
Dental Services Staff1013955560%7.2
Physical Therapy Aide0113075864%5.3
Physical Therapy Assistant0441303538%3.6
Respiratory Therapy Technician033713033%2.2
Medical Director011411314%3.2
Occupational Therapy Aide0113867%6.3
Occupational Therapy Assistant0112467%3.9

Health Inspection History

Inspections
Total health inspections 3

Kentucky average 2.9


Last Health inspection on Dec 2024

Total health citations 29
Citations per inspection
9.67

Health citations are formal notices following inspections when they fail to comply with safety and care standards.

22 of 29 citations resulted from standard inspections; and 7 of 29 came from combined inspections (standard and complaint).

Breakdown of citation severity (last 3 years)
Critical Health citations More info 0
100% better than Kentucky average

Kentucky average: 1.1


Serious Health citations More info 1
67% worse than Kentucky average

Kentucky average: 0.6

0 critical citations More info Kentucky average: 1.1

1 serious citation More info Kentucky average: 0.6

28 moderate citations More info Kentucky average: 11.6

0 minor citations More info Kentucky average: 0.1
Citations history (last 3 years)
Nutrition moderate citation Dec 13, 2024
Corrected

Pharmacy moderate citation Dec 13, 2024
Corrected

Abuse/Neglect serious citation Dec 13, 2023
Corrected

Abuse/Neglect moderate citation Dec 13, 2023
Corrected

Facility Characteristics

Source: CMS Long-Term Care Facility Characteristics (Data as of Jan 2026)

Ownership: For-Profit LLC
Resident Census by Payment Source
77 Total Residents
Medicare 5 (6.5%)
Medicaid 56 (72.7%)
Private Pay/Other 16 (20.8%)
Programs & Services
Residents' Group
Family Engagement

Active councils help families stay involved in care decisions and facility operations.

Quality of care over time

These measures show how residents usually do over time at this home, based on health outcomes and preventive care.

High-risk clinical events score Info A composite score based on pressure ulcers, falls with injury, weight loss, walking ability decline, and activities of daily living decline. 15.2
45% worse than Kentucky average

Kentucky average: 10.5

Functional decline score Info A composite score based on activities of daily living decline, walking ability decline, and incontinence. 25.2
33% worse than Kentucky average

Kentucky average: 18.9

Long-stay resident measures
Need for Help with Daily Activities Increased Info Percent of long-stay residents whose need for help with daily activities has increased 17.0%
In line with Kentucky average

Kentucky average: 16.8%

Walking Ability Worsened Info Percent of long-stay residents whose ability to move independently worsened 35.5%
81% worse than Kentucky average

Kentucky average: 19.6%

Low Risk Residents with Bowel/Bladder Incontinence Info Percent of low risk long-stay residents who lose control of their bowels or bladder 23.0%
12% worse than Kentucky average

Kentucky average: 20.5%

Falls with Major Injury Info Percent of long-stay residents experiencing one or more falls with major injury 5.4%
43% worse than Kentucky average

Kentucky average: 3.8%

High Risk Residents with Pressure Ulcers Info Percent of long-stay high risk residents with pressure ulcers 8.4%
46% worse than Kentucky average

Kentucky average: 5.8%

Urinary Tract Infection Info Percent of long-stay residents with a urinary tract infection 4.7%
152% worse than Kentucky average

Kentucky average: 1.9%

Lost Too Much Weight Info Percent of long-stay residents who lose too much weight 9.6%
41% worse than Kentucky average

Kentucky average: 6.8%

Depressive Symptoms Info Percent of long-stay residents who have depressive symptoms 20.0%
40% worse than Kentucky average

Kentucky average: 14.3%

Antipsychotic Use Info Percent of long-stay residents who received an antipsychotic medication 14.8%
5% better than Kentucky average

Kentucky average: 15.6%

Pneumococcal Vaccine Info Percent of long-stay residents assessed and appropriately given the pneumococcal vaccine 89.3%
5% worse than Kentucky average

Kentucky average: 93.9%

Influenza Vaccine Info Percent of long-stay residents assessed and appropriately given the seasonal influenza vaccine 85.3%
11% worse than Kentucky average

Kentucky average: 96.2%

Hospitalizations per 1,000 days Info Number of hospitalizations per 1,000 long-stay resident days. 0.58
69% better than Kentucky average

Kentucky average: 1.87

ED visits per 1,000 days Info Number of outpatient emergency department visits per 1,000 long-stay resident days. 2.10
In line with Kentucky average

Kentucky average: 2.19

Short-stay resident measures
Pneumococcal Vaccine Info Percent of short-stay residents assessed and appropriately given the pneumococcal vaccine 85.5%
In line with Kentucky average

Kentucky average: 83.7%

Antipsychotic medication increase Info Percent of short-stay residents who newly received an antipsychotic medication 1.9%
In line with Kentucky average

Kentucky average: 1.9%

Influenza Vaccine Info Percent of short-stay residents assessed and appropriately given the seasonal influenza vaccine 76.3%
9% worse than Kentucky average

Kentucky average: 83.6%

Falls with major injury Info Percentage of SNF residents who experience falls with major injury during their stay. 0.0%
100% better than Kentucky average

Kentucky average: 0.8%

Ability to care for self at discharge Info Percentage of residents at or above expected ability to care for themselves at discharge. 23.8%
56% worse than Kentucky average

Kentucky average: 53.7%

Successful return to home or community Info Rate of successful return to home or community from a skilled nursing facility. 41.2%
19% worse than Kentucky average

Kentucky average: 50.6%

Penalties and fines

Federal penalties imposed by CMS for regulatory violations, including civil money penalties (fines) and denials of payment for new Medicare/Medicaid admissions.

Source: CMS Penalties Database (Data as of Jan 2026)

Total fines amount $171K
171% higher than Kentucky average

Kentucky average: $63K

Number of fines 4
74% more fines than Kentucky average

Kentucky average: 2.3

Payment Denials Info Serious action where Medicare and/or Medicaid temporarily stops payments for new residents until issues are fixed. 0
100% fewer payment denials than Kentucky average

Kentucky average: 0.3

Fines amount comparison
This facility $171K
Kentucky average $63K
Penalty History

Penalties are imposed by CMS for violations of federal nursing home regulations.

Civil Money Penalty Info Fines imposed for noncompliance, which can be assessed per day or per instance of violation. Dec 13, 2023
$164K
Civil Money Penalty Info Fines imposed for noncompliance, which can be assessed per day or per instance of violation. Aug 14, 2023
$2K
Civil Money Penalty Info Fines imposed for noncompliance, which can be assessed per day or per instance of violation. Aug 7, 2023
$2K
Civil Money Penalty Info Fines imposed for noncompliance, which can be assessed per day or per instance of violation. Jul 17, 2023
$3K

Last updated: Jan 2026

Guides for Better Senior Living

Care Cost Calculator: See Prices in Your Area

Nursing Home Data Explorer

Don’t Wait Too Long: 7 Red Flag Signs Your Parent Needs Assisted Living Now

The True Cost of Assisted Living in 2025 – And How Families Are Paying For It

Understanding Senior Living Costs: Pricing Models, Discounts & Financial Assistance

Financial Aid for Kentucky Seniors

Get financial aid guidance

Home and Community Based Waiver

Kentucky Medicaid HCB Waiver

Age 65+ or disabled, Kentucky resident, Medicaid-eligible, nursing home-level care need.

~$2,829/month (300% FBR, individual).

$2,000 (individual), $3,000 (couple).

Rural focus; waitlists possible.

Hart-Supported Living Program

KY Hart-Supported Living

Age 65+ or disabled, Kentucky resident.

No strict limit; prioritizes low-income.

Not applicable.

Competitive grants; limited availability.

Kentucky Homecare Program

Kentucky Homecare Program

Age 60+, Kentucky resident, at risk of nursing home placement, not eligible for Medicaid waivers.

No strict limit; prioritizes low-income (~$24,980/year individual).

Not assessed; need-based focus.

15 AAAs; rural focus; not in nursing homes.

Medicare Savings Program (MSP)

Kentucky Medicare Savings Program

Age 65+ or disabled, Kentucky resident, Medicare Part A/B.

~$2,510/month (QMB), ~$3,380/month (SLMB), ~$3,598/month (QI)—individual.

$9,430 (individual), $14,130 (couple).

Three tiers; no waitlist; auto Extra Help for Part D.

National Family Caregiver Support Program (NFCSP) Respite

Kentucky NFCSP Respite Care

Caregivers of 60+ needing care or 55+ caregivers of others; Kentucky resident; functional needs (2+ ADLs).

Prioritizes ~$24,980/year (individual); no strict cap.

Not assessed; need-based.

15 AAAs; prioritizes low-income, rural caregivers.

Kentucky Family Caregiver Program

Kentucky Family Caregiver Program

Grandparents (often 55+) as primary caregivers to grandchildren under 18, Kentucky resident, not on Kinship Care.

~$31,225/year (individual); varies by AAA.

Not strictly assessed; need-based.

Max $1,500/year; statewide via AAAs.

Senior Community Service Employment Program (SCSEP)

Kentucky SCSEP

Age 55+, unemployed, low-income, Kentucky resident.

~$1,983/month (125% FPL).

Not specified; income-focused.

Priority for veterans, rural residents.

VA Aid and Attendance (A&A) and Housebound Benefits

Kentucky VA Aid and Attendance/Housebound

Age 65+ or disabled veteran/spouse, Kentucky resident, wartime service, need for ADL help (A&A) or homebound.

Net income < ~$1,984/month (veteran with dependent, A&A); pension offsets income.

~$155,356 (net worth limit).

High veteran demand in rural areas.

Who we are

Your Senior Care Partner, Every Step of the Way

We help families find affordable senior communities and unlock same day discounts, Medicaid, and Medicare options tailored to your needs.

Contact us Today