Explore Open Rooms
1 Contact details
2 What type of senior care service are you looking for?
3 What budget do you have in mind for senior care?
4 How soon do you need to find care?
5 Additional details

Thank you for your interest!

Our team will be in touch shortly to help with next steps.

Nursing Home in Bowling Green

CMS overall rating Info The Overall CMS Rating combines results from health inspections, staffing levels and quality measures. Health inspections carry the most weight. Staffing and quality scores can increase or decrease the final rating based on performance compared to state and national standards.

Edmonson Center

Overview of Edmonson Center

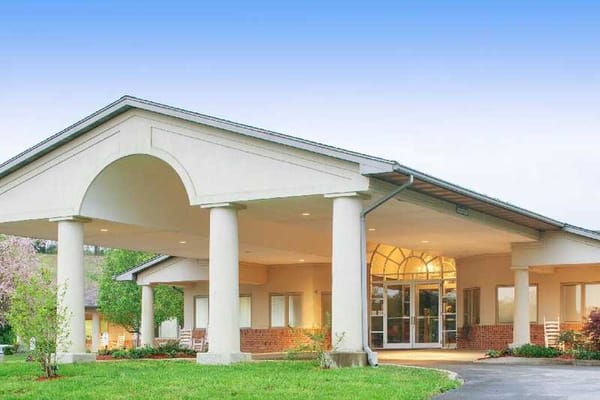
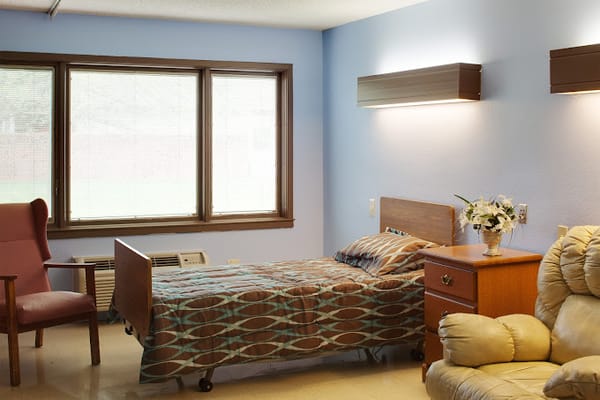
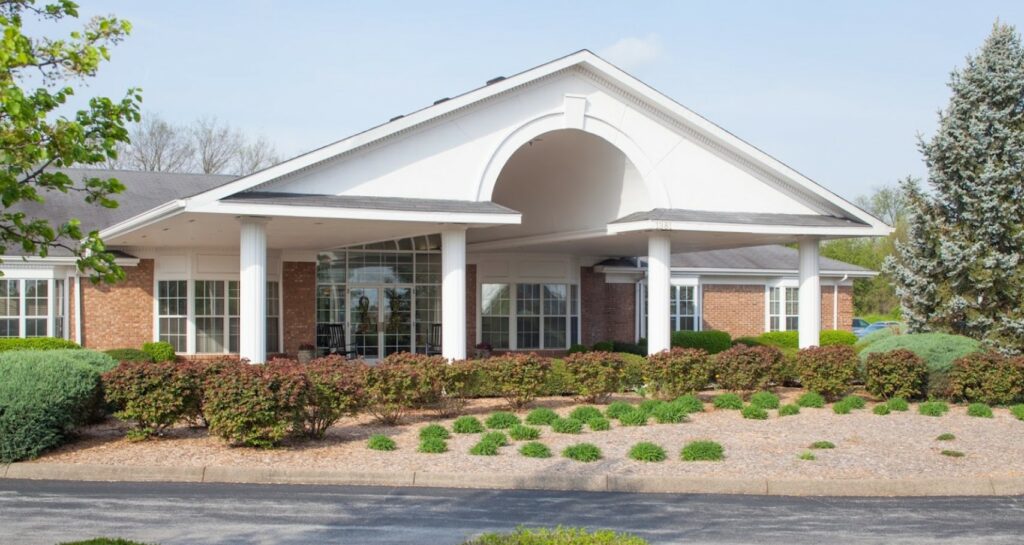
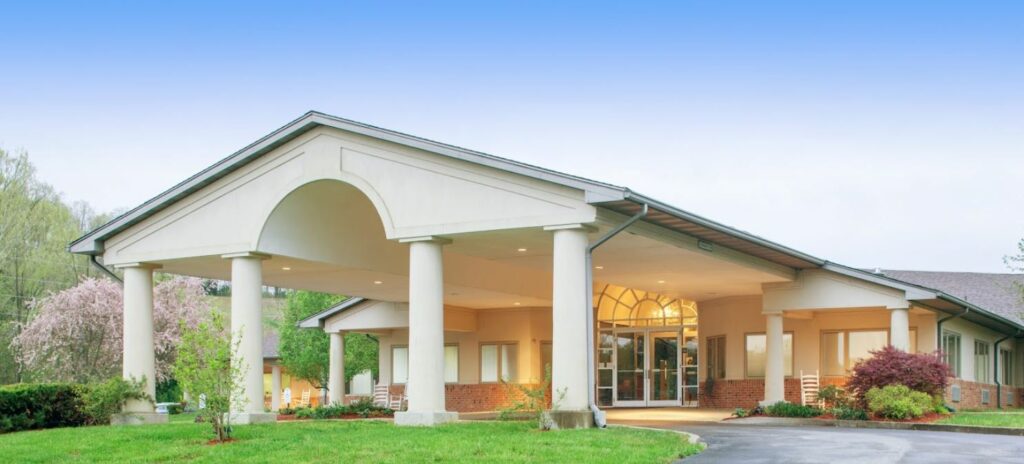
Edmonson Center is a welcoming community nestled in the picturesque town of Brownsville, Kentucky, offering exceptional care for those seeking nursing homes or assisted living services. With an 86-bed skilled nursing facility, residents can enjoy spacious private and semi-private rooms designed to provide comfort and tranquility. Conveniently located just minutes away from the awe-inspiring Mammoth Cave National Park, Edmonson Center provides a serene and natural setting for residents to call home.

A dedicated team of compassionate nurses, aides, and therapists ensures that residents receive the highest level of care and support. Beyond addressing medical needs, the staff goes the extra mile to keep family members well-informed throughout the journey. With a strong emphasis on family culture, Edmonson Center creates an environment where residents feel valued and embraced, making the transition to a nursing home or assisted living a smoother and more fulfilling experience.

(423) 476-6800

Quality ratings

Measured by Centers for Medicare & Medicaid Services (CMS)

Overall rating Info The Overall CMS Rating combines results from health inspections, staffing levels and quality measures. Health inspections carry the most weight. Staffing and quality scores can increase or decrease the final rating based on performance compared to state and national standards.
4/5
Kentucky average: 2.8/5
Health Inspection Info Based on the results of the facility's three most recent standard inspections and any complaint investigations. CMS reviews the number, scope, and severity of deficiencies, with more recent findings weighted more heavily.
4/5
Kentucky average: 2.9/5
Staffing Info Measures average nursing staff hours per resident per day, including Registered Nurses (RNs) and total nursing staff. Ratings are adjusted based on the level of care residents require and are compared to state and national benchmarks.
3/5
Kentucky average: 2.4/5
Quality Measures Info Based on clinical and physical health indicators reported to CMS, such as hospital readmissions, falls, pressure ulcers, and improvements in mobility. These measures reflect how well residents' health needs are being managed.
4/5
Kentucky average: 2.9/5

Nursing care per resident

Info This shows how many total hours of nursing staff time are available per resident each day. Higher numbers usually mean more staff support.
3h 28m per day

This home provides 0% more nursing time per resident than the Kentucky average.

Kentucky average: 3h 27m per day

Staffing hours breakdown

Info Hours of care per resident per day, broken down by staff type. Data from CMS Medicare.
Staff type Facility State avg National avg
Registered Nurse (RN) Info Registered nurse hours per resident per day. 36m per day 46m per day 41m per day
Nurse Aide Info Nurse aide hours per resident per day. 2h 17m per day 2h 25m per day 2h 21m per day
Total Nursing (Weekend) Info Total number of nurse staff hours per resident per day on weekends. 3h 21m per day 3h 29m per day 3h 26m per day
Physical Therapist Info Physical therapist staff hours per resident per day. 1m per day 4m per day 4m per day
RN (Weekend) Info Registered nurse hours per resident per day on weekends. 19m per day 31m per day 29m per day

Capacity and availability

Smaller home

May offer a more intimate, personalized care environment.

Total beds 74

This home is often near full

That suggests steady demand, but availability may be limited.

Higher demand than most homes in Kentucky
Occupancy rate 97.3%
Residents per day (avg) 72
Occupancy rate
97.3%
Residents per day (avg)
72

Who this home usually serves

TYPE OF STAY

Mix of rehab and long-term care

This home supports both short-term rehab and long-term care, with residents staying for a wide range of durations.

Breakdown by payment type

Medicare

33% of new residents, usually for short-term rehab.

Typical stay 1 - 2 months

Private pay

58% of new residents, often for short stays.

Typical stay 1 - 2 months

Medicaid

9% of new residents, often for long-term daily care.

Typical stay 3 - 4 years

Finances and operations

Privately-owned community
Operated by a business corporation.
Home revenue
$10.5M
Operating loss
-$96.8K
Privately-owned community Operated by a business corporation.
Home revenue
$10.5M
Operating loss
-$96.8K
Payroll costs Info The portion of the home's budget spent on staff, including nurses, caregivers, and other employees who support care and operations.
$3.1M
29.7% of revenue
Other operating costs Info All remaining costs needed to run the home, such as food, utilities, building maintenance, supplies and administrative expenses.
$7.5M
Total costs $10.6M
Bed community size
74-bed community
A moderately sized community that may balance personal attention with shared amenities and social activities.
Walk Score
Walk Score: 43 / 100
Somewhat walkable. A few nearby services may be reachable on foot, but most trips require transportation.

About this community

Occupancy

Occupancy rate
97%
In line with Kentucky average
Occupied beds
72 / 74
Average residents 80 per day

License Details

Facility TypeLong Term Care (nursing Facility)
StatusActive
IssuanceOctober 1, 2025
ExpirationSeptember 30, 2026
CountyEDMONSON

Additional Licensing Details

License Number100680
CMS Certification Number185401

Ownership & Operating Entity

Edmonson Center is legally operated by Edmonson Health Center Llc, and administrated by Ryan.

Type Of Units

NF (Nursing Facility)
74 units
Total beds
74 units

What does this home offer?

Housing options icon

Housing Options: Private Rooms

Building type icon
Building type icon

Building Type: Single-story

Transportation services icon

Transportation Services

Fitness and recreation icon

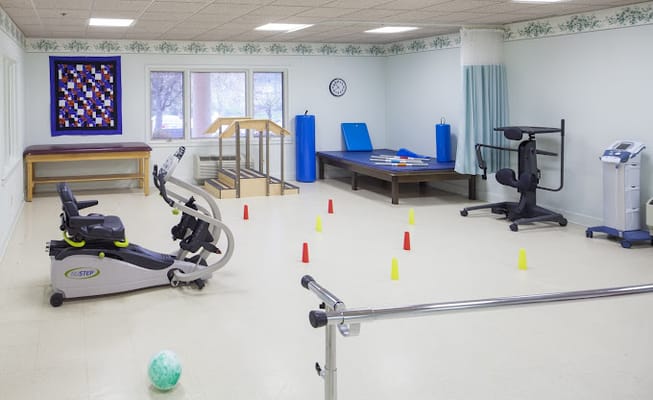
Fitness and Recreation

Types of Care at Edmonson Center

Nursing Home Assisted Living

Contact Edmonson Center

Inspection History

In Kentucky, the Cabinet for Health and Family Services, Office of Inspector General is the regulatory authority that conducts inspections and investigates complaints in all long-term care homes.

3 visits/inspections

Latest inspection

Date May 1, 2025
Annual Inspection

11 deficiencies

Deficiencies indicate regulatory issues. A higher number implies the facility had several areas requiring improvement.

Kentucky average: 6 deficiencies

Inspection Report Summary for Edmonson Center

The most recent inspection on May 1, 2025, found the facility in substantial compliance with no deficiencies. Earlier inspections are not listed in the available reports, so no broader pattern of compliance or issues can be determined. No complaint investigations or enforcement actions were noted in the available information. There were no fines, immediate jeopardy findings, or license actions reported. This suggests the facility met regulatory requirements at the time of the latest survey.

Health Inspection History

Inspections
Total health inspections 2

Kentucky average 2.9


Last Health inspection on Mar 2020

Total health citations 11

Kentucky average 13.5

Citations per inspection
5.5

Kentucky average 4.4


Health citations are formal notices following inspections when they fail to comply with safety and care standards.

All 11 citations resulted from standard inspections.

Breakdown of citation severity (last 3 years)
Critical Health citations More info 3
173% worse than Kentucky average

Kentucky average: 1.1


Serious Health citations More info 0
100% better than Kentucky average

Kentucky average: 0.6

3 critical citations More info Kentucky average: 1.1

0 serious citations More info Kentucky average: 0.6

8 moderate citations More info Kentucky average: 11.6

0 minor citations More info Kentucky average: 0.1
Citations history (last 3 years)
Abuse/Neglect critical citation Info Issues related to protecting resident's from harm, including abuse, neglect, or mistreatment. Mar 06, 2020
Corrected

Abuse/Neglect critical citation Info Issues related to protecting resident's from harm, including abuse, neglect, or mistreatment. Mar 06, 2020
Corrected

Abuse/Neglect critical citation Info Issues related to protecting resident's from harm, including abuse, neglect, or mistreatment. Mar 06, 2020
Corrected

Infection Control moderate citation Info Issues related to preventing and controlling infections, including hygiene practices and safety protocols. Jan 24, 2019
Corrected

Compare Nursing Homes around Bowling Green The information below is reported by the Kentucky Cabinet for Health and Family Services, Office of Inspector General.

3 facilities compared · CMS & KY Dept. of Health data · Updated Apr 2026

Filter by care type
Magnolia Village
NH

Nursing Home Licensed facility providing 24/7 skilled nursing care for residents with complex, ongoing medical needs. Staffed by RNs, LPNs, and CNAs. Inspected and star-rated annually by CMS. Accepts Medicare (short-term rehab) and Medicaid (long-term care).

AL

Assisted Living A licensed, long-term care setting for seniors or individuals with disabilities who need help with daily activities — like bathing, dressing, and medication management — but not 24-hour skilled nursing. Offers housing, meals, and around-the-clock support while aiming to maximize resident independence.

Bowling Green
60
93.9%
+15%
2.56
-3%
-32%
0
8
4.0
0
58
-
37
Magnolia Village Health Center Llc
$7.4M
$2.5M
33.5%
185435
Edmonson Center
AL

Assisted Living A licensed, long-term care setting for seniors or individuals with disabilities who need help with daily activities — like bathing, dressing, and medication management — but not 24-hour skilled nursing. Offers housing, meals, and around-the-clock support while aiming to maximize resident independence.

NH

Nursing Home Licensed facility providing 24/7 skilled nursing care for residents with complex, ongoing medical needs. Staffed by RNs, LPNs, and CNAs. Inspected and star-rated annually by CMS. Accepts Medicare (short-term rehab) and Medicaid (long-term care).

Brownsville
86
85.2%
+5%
3.47
-29%
-8%
0
11
5.5
3
72
-
43
Edmonson Health Center Llc
$10.5M
$3.1M
29.8%
185401
Bowling Green Nursing and Rehabilitation Center
NH

Nursing Home Licensed facility providing 24/7 skilled nursing care for residents with complex, ongoing medical needs. Staffed by RNs, LPNs, and CNAs. Inspected and star-rated annually by CMS. Accepts Medicare (short-term rehab) and Medicaid (long-term care).

AL

Assisted Living A licensed, long-term care setting for seniors or individuals with disabilities who need help with daily activities — like bathing, dressing, and medication management — but not 24-hour skilled nursing. Offers housing, meals, and around-the-clock support while aiming to maximize resident independence.

Bowling Green
66
84.2%
+4%
3.15
+9%
-16%
0
8
2.0
0
57
-
52
Raymer, Natalie
$6.2M
$2.8M
44.5%
185224

Places of interest near Edmonson Center

Address 25.2 miles from city center — 16.06 miles to nearest hospital (Dr. Bradley Moore, MD, OBGYN)

Calculate Travel Distance to Edmonson Center

Add your location

Address

Staffing Data (Q2 2025)

This data corresponds to Q2 2025 and is based on CMS Payroll-Based Journal.

Total staff 94
Employees 89
Contractors 5
Staff to resident ratio 1.31:1
25% worse than Kentucky average

Kentucky average ratio: 1.75:1

Avg staff/day 34
Average shift 8.9 hours
5% better than Kentucky average

Kentucky average: 8.5 hours

Total staff hours (quarter) 27,617
Nursing staff breakdown
Registered Nurse

Manages medical care and health needs.

Total count 7
Average shift length Info Average shift length. Calculated as total hours divided by days worked and average staff per day. 9.5 hours

No contractors work on this role.

Licensed Practical Nurse

Assists with medical care and medications.

Total count 16
Average shift length Info Average shift length. Calculated as total hours divided by days worked and average staff per day. 10.1 hours

This role is partially covered by contractors.

Certified Nursing Assistant

Helps with daily care and mobility.

Total count 40
Average shift length Info Average shift length. Calculated as total hours divided by days worked and average staff per day. 9.2 hours

No contractors work on this role.

Contractor staffing

Total hours from contractors

1%

278 contractor hours this quarter

Medical Director: 2 Licensed Practical Nurse: 1 Occupational Therapy Aide: 1 Occupational Therapy Assistant: 1
Staff by category
Certified Nursing Assistant4004013,53991100%9.2
Licensed Practical Nurse151164,70191100%10.1
Clinical Nurse Specialist4041,7526673%8
Registered Nurse7071,6188998%9.5
Other Dietary Services Staff20299691100%8.4
Medication Aide/Technician3039468189%10.4
RN Director of Nursing2027306268%8
Qualified Social Worker3035617380%6.6
Speech Language Pathologist2025546369%6.3
Dental Services Staff1015036369%8
Nurse Practitioner1014645864%8
Administrator2024085156%8
Physical Therapy Aide1013825358%7.2
Physical Therapy Assistant3031943336%5.3
Respiratory Therapy Technician3031453134%4.2
Occupational Therapy Aide011911112%8.3
Occupational Therapy Assistant0112833%9.2
Medical Director022633%1
40 Certified Nursing Assistant
% of Days 100%
16 Licensed Practical Nurse
% of Days 100%
4 Clinical Nurse Specialist
% of Days 73%
7 Registered Nurse
% of Days 98%
2 Other Dietary Services Staff
% of Days 100%
3 Medication Aide/Technician
% of Days 89%
2 RN Director of Nursing
% of Days 68%
3 Qualified Social Worker
% of Days 80%
2 Speech Language Pathologist
% of Days 69%
1 Dental Services Staff
% of Days 69%
1 Nurse Practitioner
% of Days 64%
2 Administrator
% of Days 56%
1 Physical Therapy Aide
% of Days 58%
3 Physical Therapy Assistant
% of Days 36%
3 Respiratory Therapy Technician
% of Days 34%
1 Occupational Therapy Aide
% of Days 12%
1 Occupational Therapy Assistant
% of Days 3%
2 Medical Director
% of Days 3%

Facility Characteristics

Source: CMS Long-Term Care Facility Characteristics (Data as of Jan 2026)

Total census
72 residents
Residents by payment source
Medicare
9 residents (12.5%)
Medicaid
55 residents (76.4%)
Private pay or other
8 residents (11.1%)
Programs & Services
Residents' Group

Residents meet regularly to discuss policies, care quality, and activities

Active Resident Council

Organized group of residents that meets regularly to discuss facility policies, quality of life, and activities.

Quality of care over time

These measures show how residents usually do over time at this home, based on health outcomes and preventive care.

High-risk clinical events score Info A composite score based on pressure ulcers, falls with injury, weight loss, walking ability decline, and activities of daily living decline. 11.5
10% worse than Kentucky average

Kentucky average: 10.5

Functional decline score Info A composite score based on activities of daily living decline, walking ability decline, and incontinence. 20.5
8% worse than Kentucky average

Kentucky average: 18.9

Long-stay resident measures
Above average Kentucky avg: 3.6 Info CMS star rating based on long-stay quality measure performance. 5 stars = significantly above average, 1 star = significantly below average.
Need for Help with Daily Activities Increased Info Percent of long-stay residents whose need for help with daily activities has increased 18.1%
8% worse than Kentucky average

Kentucky average: 16.8%

Walking Ability Worsened Info Percent of long-stay residents whose ability to move independently worsened 25.9%
32% worse than Kentucky average

Kentucky average: 19.6%

Low Risk Residents with Bowel/Bladder Incontinence Info Percent of low risk long-stay residents who lose control of their bowels or bladder 17.5%
15% better than Kentucky average

Kentucky average: 20.5%

Falls with Major Injury Info Percent of long-stay residents experiencing one or more falls with major injury 4.6%
23% worse than Kentucky average

Kentucky average: 3.8%

High Risk Residents with Pressure Ulcers Info Percent of long-stay high risk residents with pressure ulcers 3.6%
38% better than Kentucky average

Kentucky average: 5.8%

Urinary Tract Infection Info Percent of long-stay residents with a urinary tract infection 2.8%
50% worse than Kentucky average

Kentucky average: 1.9%

Lost Too Much Weight Info Percent of long-stay residents who lose too much weight 5.3%
21% better than Kentucky average

Kentucky average: 6.8%

Depressive Symptoms Info Percent of long-stay residents who have depressive symptoms 11.1%
22% better than Kentucky average

Kentucky average: 14.3%

Antipsychotic Use Info Percent of long-stay residents who received an antipsychotic medication 12.8%
18% better than Kentucky average

Kentucky average: 15.6%

Pneumococcal Vaccine Info Percent of long-stay residents assessed and appropriately given the pneumococcal vaccine 99.6%
6% better than Kentucky average

Kentucky average: 93.9%

Influenza Vaccine Info Percent of long-stay residents assessed and appropriately given the seasonal influenza vaccine 100.0%
In line with Kentucky average

Kentucky average: 96.2%

Hospitalizations per 1,000 days Info Number of hospitalizations per 1,000 long-stay resident days. 0.98
48% better than Kentucky average

Kentucky average: 1.87

ED visits per 1,000 days Info Number of outpatient emergency department visits per 1,000 long-stay resident days. 0.72
67% better than Kentucky average

Kentucky average: 2.19

Short-stay resident measures
Average Kentucky avg: 2.3 Info CMS star rating based on short-stay quality measure performance. 5 stars = much above average, 1 star = much below average.
Pneumococcal Vaccine Info Percent of short-stay residents assessed and appropriately given the pneumococcal vaccine 98.9%
18% better than Kentucky average

Kentucky average: 83.7%

Antipsychotic medication increase Info Percent of short-stay residents who newly received an antipsychotic medication 2.4%
24% worse than Kentucky average

Kentucky average: 1.9%

Influenza Vaccine Info Percent of short-stay residents assessed and appropriately given the seasonal influenza vaccine 97.8%
17% better than Kentucky average

Kentucky average: 83.6%

Re-hospitalized after SNF stay Info Percentage of short-stay residents who were re-hospitalized after their nursing home admission. 14.1%
42% better than Kentucky average

Kentucky average: 24.5%

Emergency department visits Info Percentage of short-stay residents who had an outpatient emergency department visit. 11.0%
21% better than Kentucky average

Kentucky average: 13.9%

Falls with major injury Info Percentage of SNF residents who experience falls with major injury during their stay. 0.0%
100% better than Kentucky average

Kentucky average: 0.8%

Ability to care for self at discharge Info Percentage of residents at or above expected ability to care for themselves at discharge. 37.9%
29% worse than Kentucky average

Kentucky average: 53.7%

Successful return to home or community Info Rate of successful return to home or community from a skilled nursing facility. 51.6%
In line with Kentucky average

Kentucky average: 50.6%

Guides for Better Senior Living

Care Cost Calculator: See Prices in Your Area

Nursing Home Data Explorer

Don’t Wait Too Long: 7 Red Flag Signs Your Parent Needs Assisted Living Now

The True Cost of Assisted Living in 2025 – And How Families Are Paying For It

Understanding Senior Living Costs: Pricing Models, Discounts & Financial Assistance

Financial Aid for Kentucky Seniors

Get financial aid guidance

Home and Community Based Waiver

Kentucky Medicaid HCB Waiver

Age 65+ or disabled, Kentucky resident, Medicaid-eligible, nursing home-level care need.

~$2,829/month (300% FBR, individual).

$2,000 (individual), $3,000 (couple).

Rural focus; waitlists possible.

Hart-Supported Living Program

KY Hart-Supported Living

Age 65+ or disabled, Kentucky resident.

No strict limit; prioritizes low-income.

Not applicable.

Competitive grants; limited availability.

Kentucky Homecare Program

Kentucky Homecare Program

Age 60+, Kentucky resident, at risk of nursing home placement, not eligible for Medicaid waivers.

No strict limit; prioritizes low-income (~$24,980/year individual).

Not assessed; need-based focus.

15 AAAs; rural focus; not in nursing homes.

Medicare Savings Program (MSP)

Kentucky Medicare Savings Program

Age 65+ or disabled, Kentucky resident, Medicare Part A/B.

~$2,510/month (QMB), ~$3,380/month (SLMB), ~$3,598/month (QI)—individual.

$9,430 (individual), $14,130 (couple).

Three tiers; no waitlist; auto Extra Help for Part D.

National Family Caregiver Support Program (NFCSP) Respite

Kentucky NFCSP Respite Care

Caregivers of 60+ needing care or 55+ caregivers of others; Kentucky resident; functional needs (2+ ADLs).

Prioritizes ~$24,980/year (individual); no strict cap.

Not assessed; need-based.

15 AAAs; prioritizes low-income, rural caregivers.

Kentucky Family Caregiver Program

Kentucky Family Caregiver Program

Grandparents (often 55+) as primary caregivers to grandchildren under 18, Kentucky resident, not on Kinship Care.

~$31,225/year (individual); varies by AAA.

Not strictly assessed; need-based.

Max $1,500/year; statewide via AAAs.

Senior Community Service Employment Program (SCSEP)

Kentucky SCSEP

Age 55+, unemployed, low-income, Kentucky resident.

~$1,983/month (125% FPL).

Not specified; income-focused.

Priority for veterans, rural residents.

VA Aid and Attendance (A&A) and Housebound Benefits

Kentucky VA Aid and Attendance/Housebound

Age 65+ or disabled veteran/spouse, Kentucky resident, wartime service, need for ADL help (A&A) or homebound.

Net income < ~$1,984/month (veteran with dependent, A&A); pension offsets income.

~$155,356 (net worth limit).

High veteran demand in rural areas.

Tour Icon
Planning a tour? Check our touring checklist.
Chat Icon
Thinking of living here? We can help you speak to a current resident