Explore Open Rooms

1 Contact details
2 What type of senior care service are you looking for?
3 What budget do you have in mind for senior care?
4 How soon do you need to find care?
5 Additional details

Thank you for your interest!

Our team will be in touch shortly to help with next steps.

Nursing Home

El Monte Convalescent Hospital

Nursing Home

El Monte Convalescent Hospital

4096 Easy St, El Monte, CA 91731 View map
Overview of El Monte Convalescent Hospital

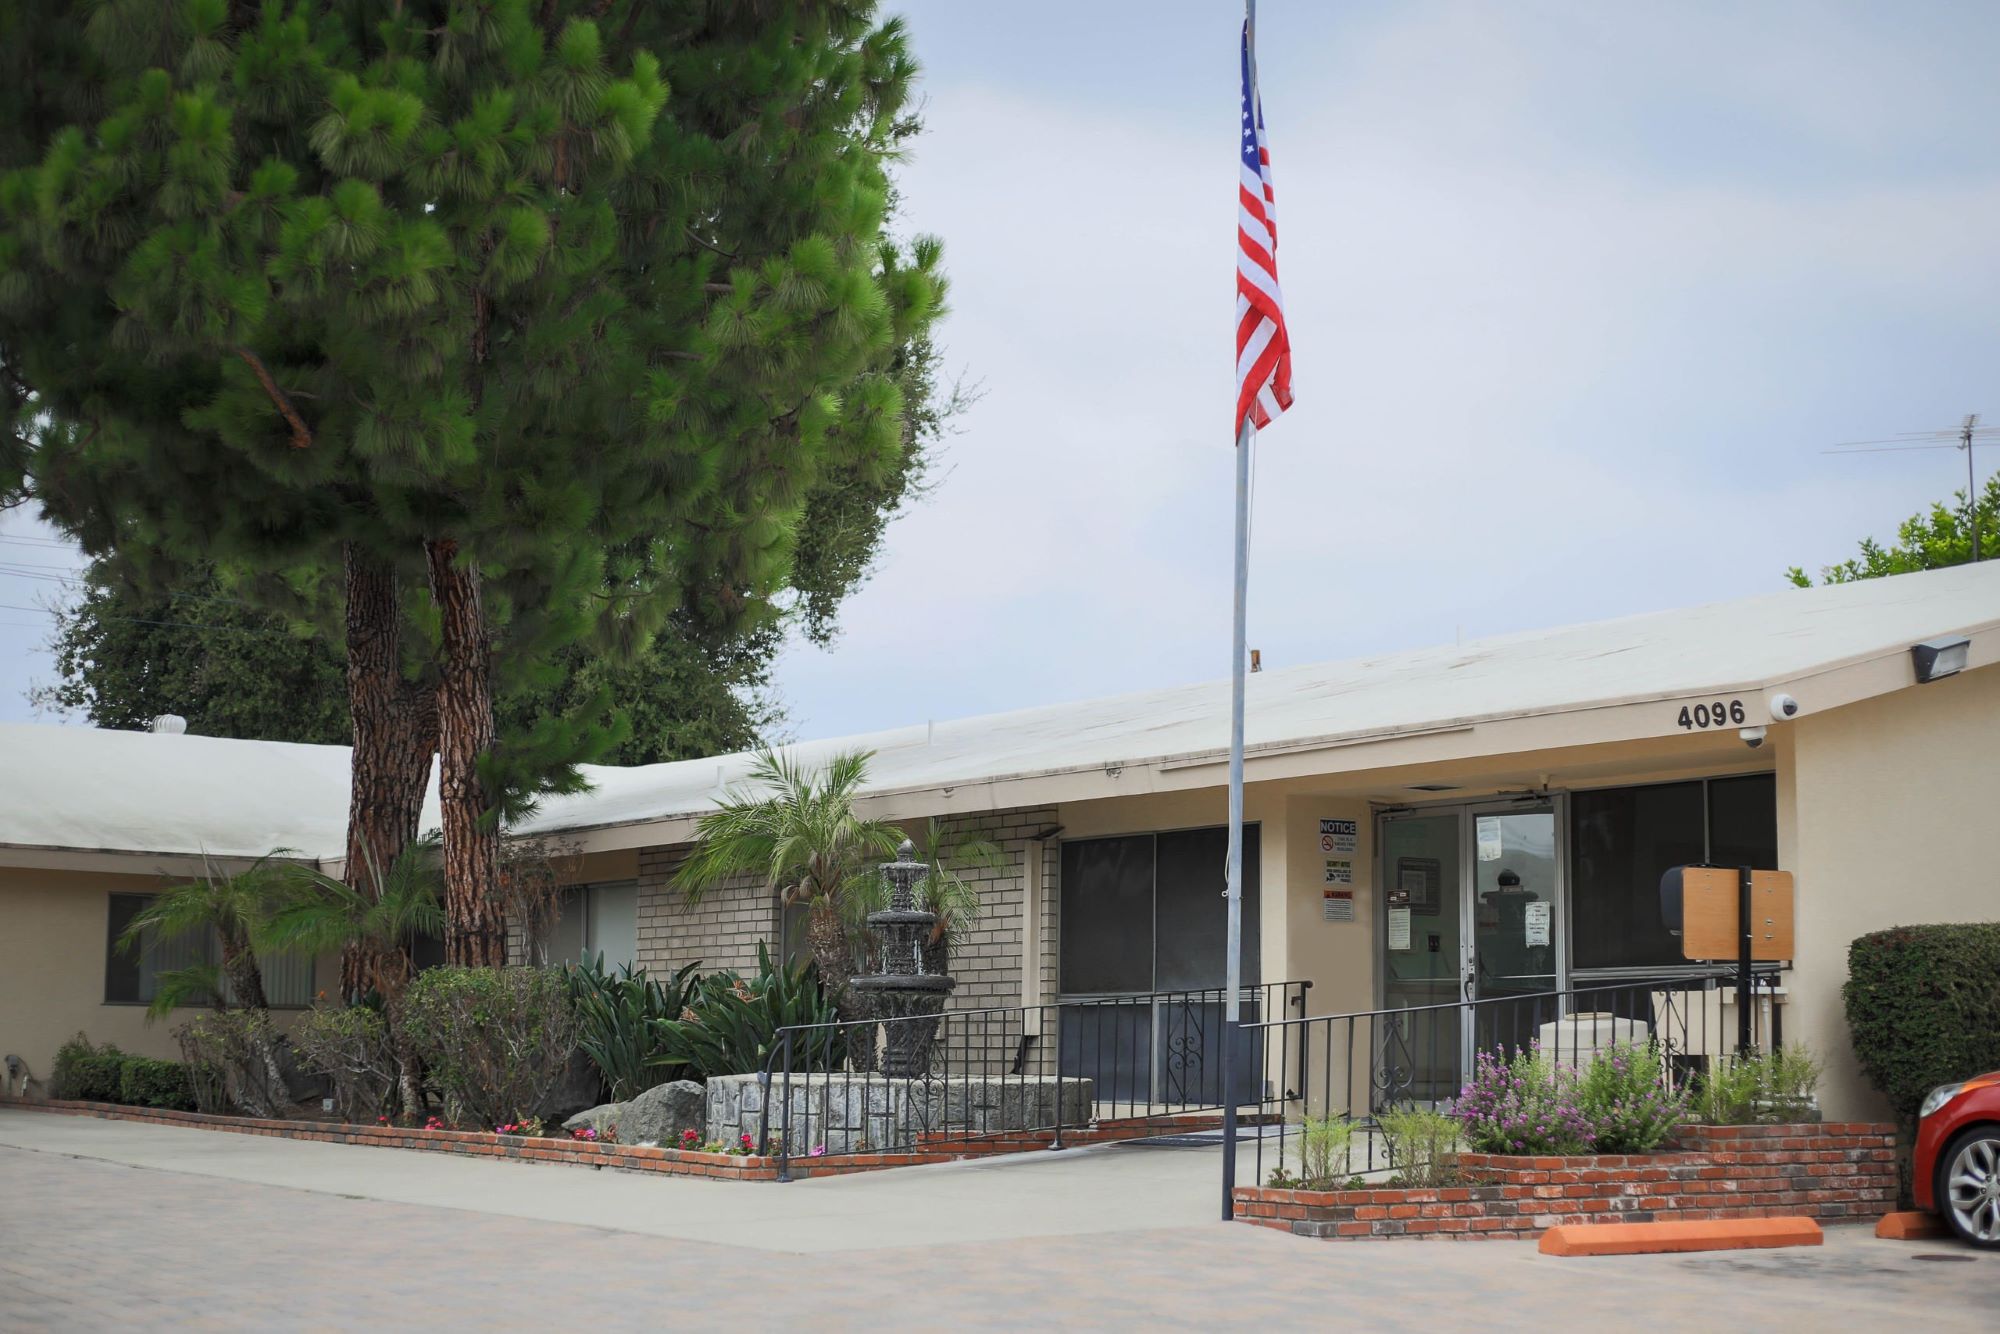
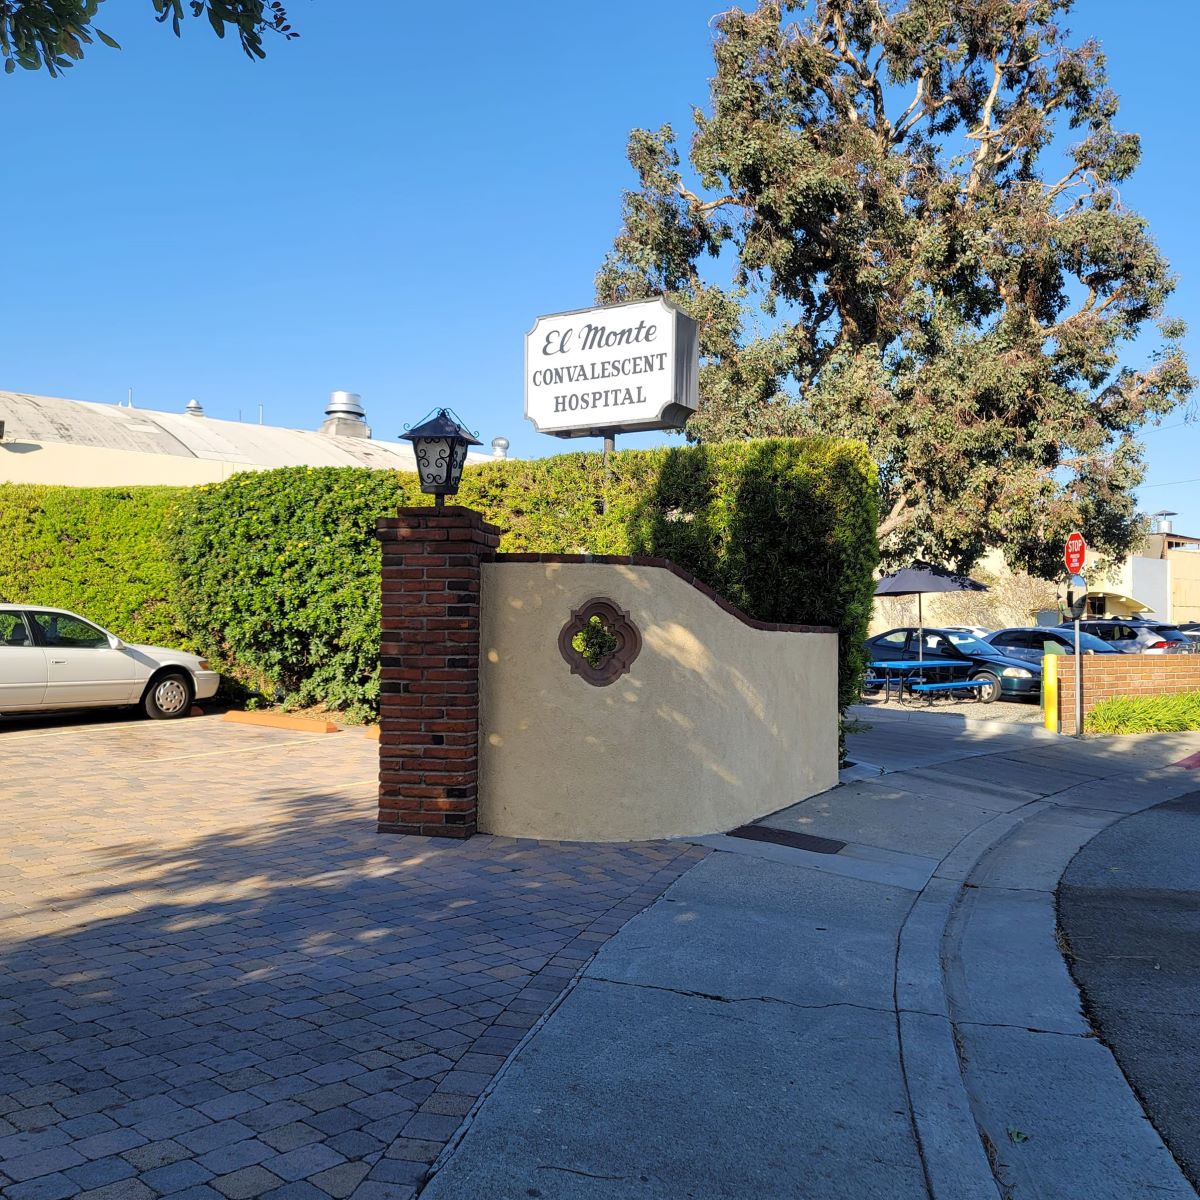
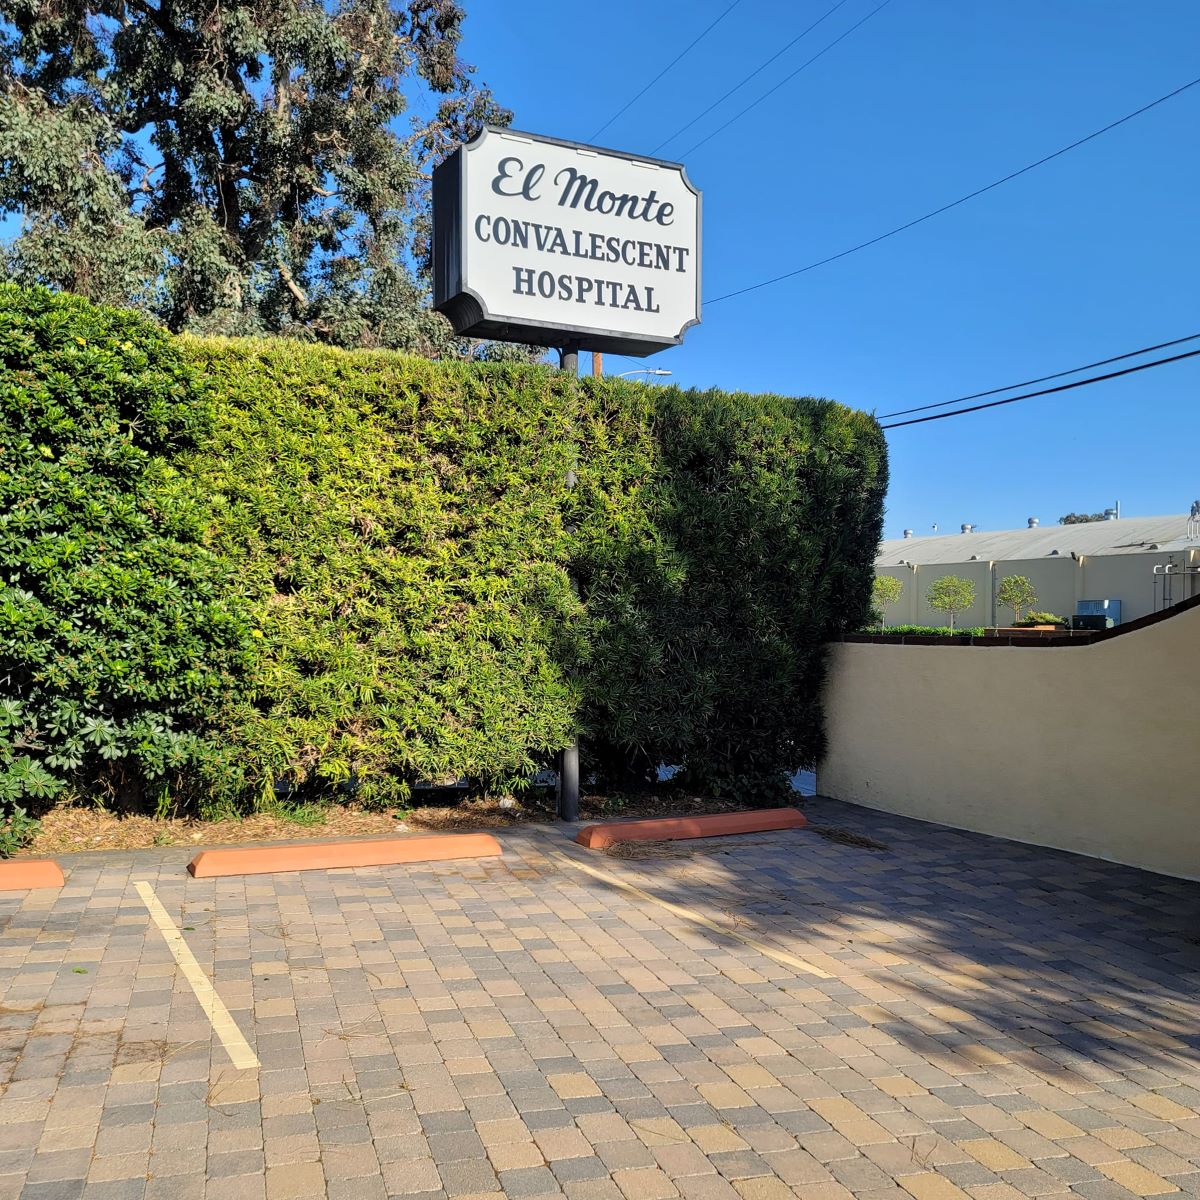
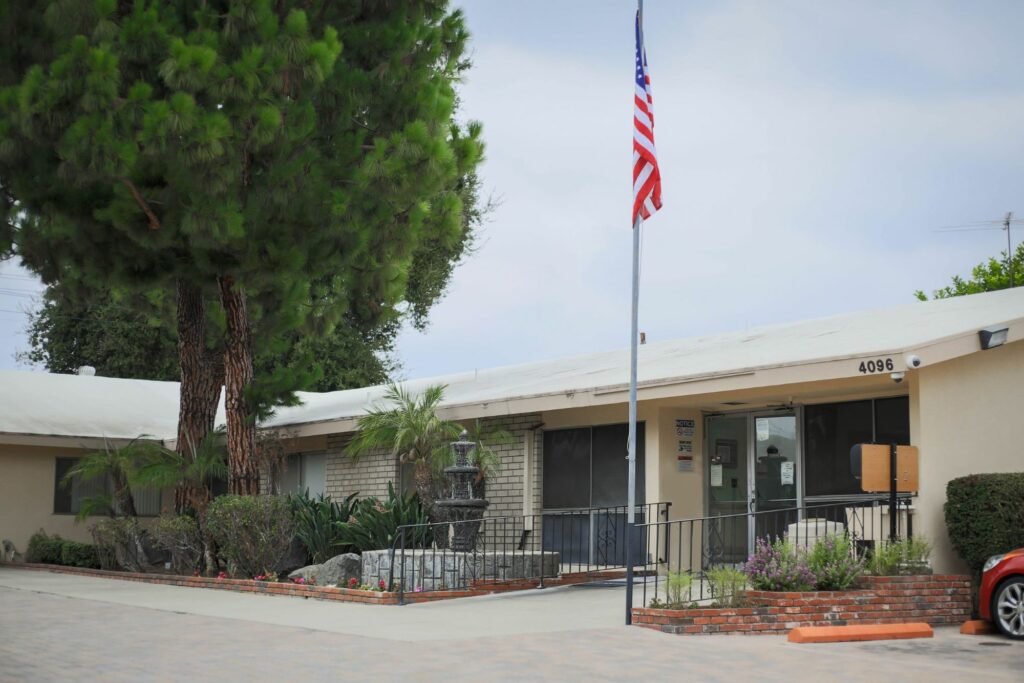
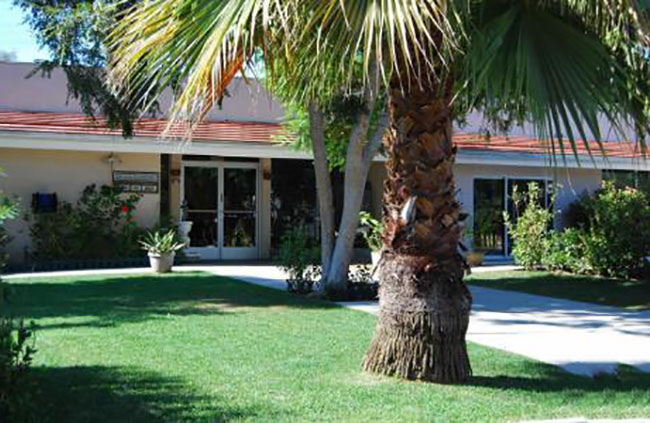
Nestled in El Monte, California, El Monte Convalescent Hospital is a compassionate, family-owned, and operated establishment that provides senior citizens with nursing, hospice programs, and healthcare services. This facility, boasting 93 beds, is dedicated to delivering skilled medical care 24/7 within a comfortable environment. Embracing diversity, El Monte Convalescent Hospital provides services without regard to religion, sexual orientation, or national origin.

Actively engaged, El Monte Convalescent Hospital offers a comprehensive range of services, including Physical Therapy, Occupational Therapy, Speech Therapy, a Wound Care Program, 24-hour RN Nursing Care, and a Hospice Program. Their multi-lingual staff, proficient in Spanish, Chinese, and Tagalog, ensures effective communication and understanding, fostering an environment where every resident receives personalized and culturally sensitive care. With a commitment to inclusivity, the facility maintains an open-door policy, encouraging family participation to achieve their goal of delivering the highest quality, compassionate healthcare to the communities they serve.

(626) 443-1351

Quality ratings

Measured by Centers for Medicare & Medicaid Services (CMS)

Overall rating Info The Overall CMS Rating combines results from health inspections, staffing levels and quality measures. Health inspections carry the most weight. Staffing and quality scores can increase or decrease the final rating based on performance compared to state and national standards.
1/5
California average: 3.1/5
Health Inspection Info Based on the results of the facility's three most recent standard inspections and any complaint investigations. CMS reviews the number, scope, and severity of deficiencies, with more recent findings weighted more heavily.
1/5
California average: 2.8/5
Staffing Info Measures average nursing staff hours per resident per day, including Registered Nurses (RNs) and total nursing staff. Ratings are adjusted based on the level of care residents require and are compared to state and national benchmarks.
2/5
California average: 3.1/5
Quality Measures Info Based on clinical and physical health indicators reported to CMS, such as hospital readmissions, falls, pressure ulcers, and improvements in mobility. These measures reflect how well residents' health needs are being managed.
3/5
California average: 4.1/5

Nursing care per resident

Info This shows how many total hours of nursing staff time are available per resident each day. Higher numbers usually mean more staff support.
3h 56m per day

This home provides 7% less nursing time per resident than the California average.

California average: 4h 13m per day

Capacity and availability

Smaller home

May offer a more intimate, personalized care environment.

Total beds 93

This home usually has availability

Lower occupancy suggests more openings may be available.

Lower demand than the California average
Occupancy rate 65.2%
Residents per day (avg) 93
Occupancy rate
65.2%
Residents per day (avg)
93

Who this home usually serves

TYPE OF STAY

Mostly long-term care residents

Most residents stay for extended periods and receive ongoing daily care.

Might be optimal for
Long-term daily care Ongoing support needs

Breakdown by payment type

Medicare

14% of new residents, usually for short-term rehab.

Typical stay 3 - 4 months

Private pay

19% of new residents, often for short stays.

Typical stay 28 days

Medicaid

67% of new residents, often for long-term daily care.

Typical stay 9 - 10 months

Finances and operations

Privately-owned community
Home revenue
$3.5M
Profit
$803.9K
Privately-owned community
Home revenue
$3,475,457.00
Profit
$803,883.00
Payroll costs Info The portion of the home's budget spent on staff, including nurses, caregivers, and other employees who support care and operations.
$1.2M
33.8% of revenue
Other operating costs Info All remaining costs needed to run the home, such as food, utilities, building maintenance, supplies and administrative expenses.
$1.5M
Total costs $2.7M

Types of Care at El Monte Convalescent Hospital

Nursing Home
Contact El Monte Convalescent Hospital

Health Inspection History

Inspections
Total health inspections 14

California average 12.5


Last Health inspection on Aug 2025

Total health citations 75

California average 50.2

Citations per inspection
5.36

California average 4.65


Health citations are formal notices following inspections when they fail to comply with safety and care standards.

54 of 75 citations resulted from standard inspections; and 21 of 75 resulted from complaint investigations.

Breakdown of citation severity (last 3 years)
Critical Health citations More info 0
100% better than California average

California average: 0.4


Serious Health citations More info 2
100% worse than California average

California average: 1

0 critical citations More info California average: 0.4

2 serious citations More info California average: 1

73 moderate citations More info California average: 47.2

0 minor citations More info California average: 1.5
Citations history (last 3 years)
Quality of Care moderate citation Info Issues related to how well residents receive appropriate treatment and support for their medical and daily care needs. Aug 13, 2025
Corrected

Quality of Care moderate citation Info Issues related to how well residents receive appropriate treatment and support for their medical and daily care needs. May 22, 2025
Corrected

Care Planning moderate citation Info Issues related to creating and updating personalized care plans for residents based on their needs and conditions. May 22, 2025
Corrected

Care Planning moderate citation Info Issues related to creating and updating personalized care plans for residents based on their needs and conditions. May 01, 2025
Corrected

Compare Nursing Homes around California The information below is reported by the California Department of Social Services and Department of Public Health.

5 facilities compared · CMS & CA Dept. of Health data · Updated Apr 2026

El Monte Convalescent Hospital
AL

Assisted Living A licensed, long-term care setting for seniors or individuals with disabilities who need help with daily activities — like bathing, dressing, and medication management — but not 24-hour skilled nursing. Offers housing, meals, and around-the-clock support while aiming to maximize resident independence.

HC

Home Care Professional care delivered in the person's own home — from companionship and errands to skilled nursing and therapy. Allows seniors to age in place. Medicare covers skilled home health when medically necessary.

IL

Independent Living Lifestyle-focused communities for older adults offering dining, activities, and transportation with minimal personal care. Best for active, independent seniors who want community without medical support.

NH

Nursing Home Licensed facility providing 24/7 skilled nursing care for residents with complex, ongoing medical needs. Staffed by RNs, LPNs, and CNAs. Inspected and star-rated annually by CMS. Accepts Medicare (short-term rehab) and Medicaid (long-term care).

El Monte
93
65.2%
-23%
3.93
-58%
-7%
3
75
2
93
56
Ahm Trust
$2,6M
$1,2M
44.8%
55202
A & J Assisted Living
-
NH

Nursing Home Licensed facility providing 24/7 skilled nursing care for residents with complex, ongoing medical needs. Staffed by RNs, LPNs, and CNAs. Inspected and star-rated annually by CMS. Accepts Medicare (short-term rehab) and Medicaid (long-term care).

AL

Assisted Living A licensed, long-term care setting for seniors or individuals with disabilities who need help with daily activities — like bathing, dressing, and medication management — but not 24-hour skilled nursing. Offers housing, meals, and around-the-clock support while aiming to maximize resident independence.

-
53
-
-
-
-
-
-
-
-
0
0
0
-
-
-
-
-
-
-
A1 Del Monte Stockton
-
NH

Nursing Home Licensed facility providing 24/7 skilled nursing care for residents with complex, ongoing medical needs. Staffed by RNs, LPNs, and CNAs. Inspected and star-rated annually by CMS. Accepts Medicare (short-term rehab) and Medicaid (long-term care).

AL

Assisted Living A licensed, long-term care setting for seniors or individuals with disabilities who need help with daily activities — like bathing, dressing, and medication management — but not 24-hour skilled nursing. Offers housing, meals, and around-the-clock support while aiming to maximize resident independence.

-
158
-
-
-
-
-
-
-
-
0
0
0
-
-
-
-
-
-
-
Aaa Kindness Care II
-
NH

Nursing Home Licensed facility providing 24/7 skilled nursing care for residents with complex, ongoing medical needs. Staffed by RNs, LPNs, and CNAs. Inspected and star-rated annually by CMS. Accepts Medicare (short-term rehab) and Medicaid (long-term care).

AL

Assisted Living A licensed, long-term care setting for seniors or individuals with disabilities who need help with daily activities — like bathing, dressing, and medication management — but not 24-hour skilled nursing. Offers housing, meals, and around-the-clock support while aiming to maximize resident independence.

-
32
-
-
-
-
-
-
-
-
0
0
0
-
-
-
-
-
-
-
Abbey Road Villa
-
NH

Nursing Home Licensed facility providing 24/7 skilled nursing care for residents with complex, ongoing medical needs. Staffed by RNs, LPNs, and CNAs. Inspected and star-rated annually by CMS. Accepts Medicare (short-term rehab) and Medicaid (long-term care).

AL

Assisted Living A licensed, long-term care setting for seniors or individuals with disabilities who need help with daily activities — like bathing, dressing, and medication management — but not 24-hour skilled nursing. Offers housing, meals, and around-the-clock support while aiming to maximize resident independence.

-
78
-
-
-
-
-
-
-
-
0
0
0
-
-
-
-
-
-
-

Places of interest near El Monte Convalescent Hospital

Address 2.4 miles from city center — 3.65 miles to nearest hospital (Garfield Medical Center)
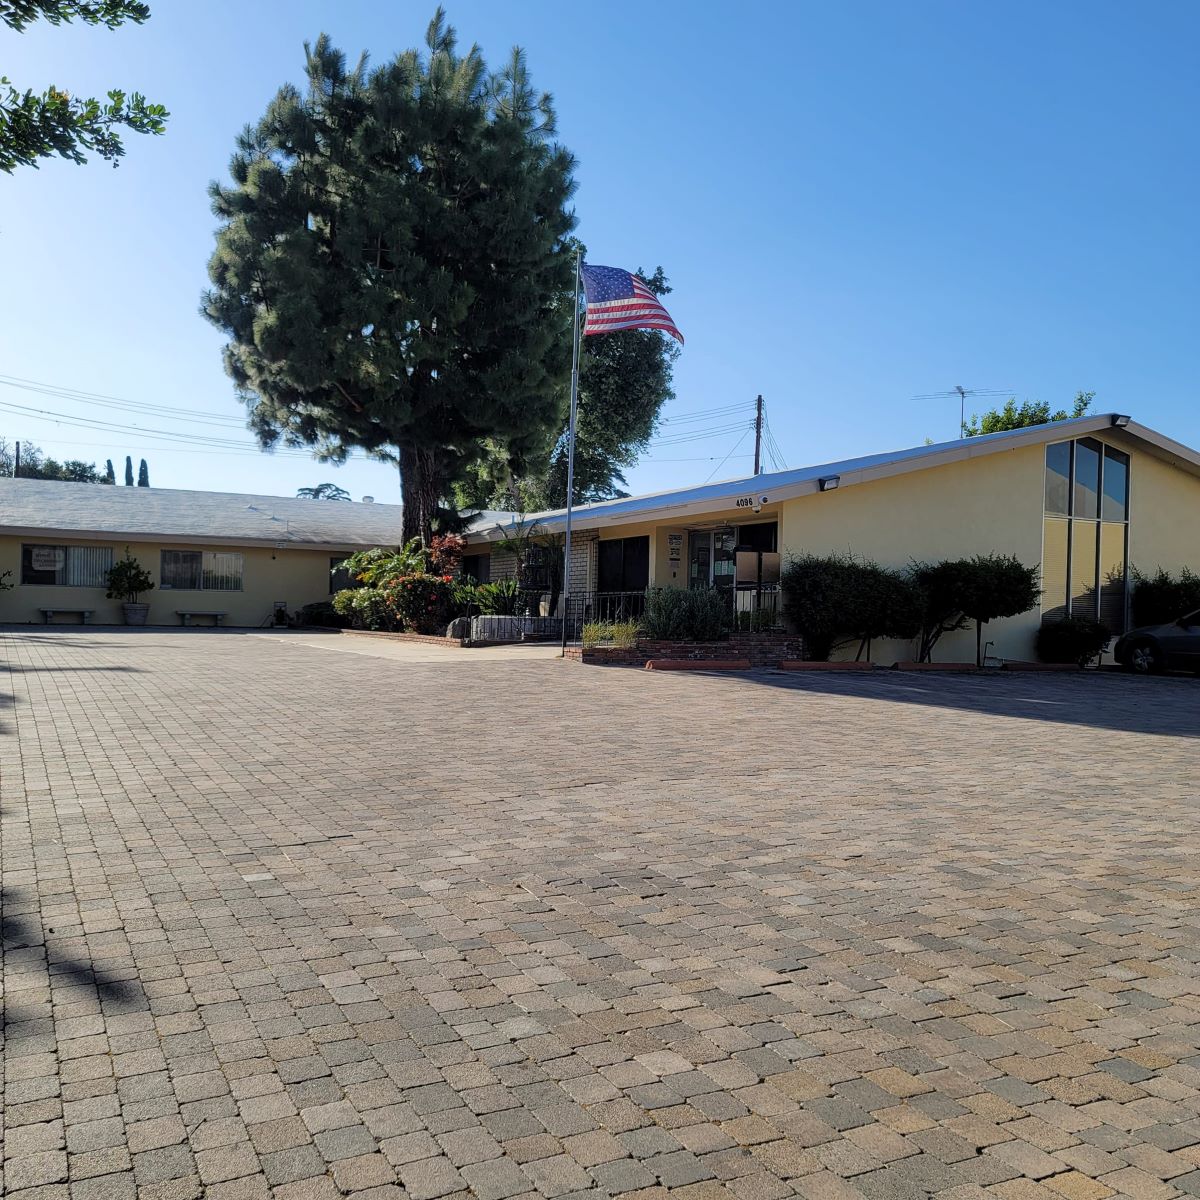
Address 4096 Easy St, El Monte, CA 91731

Calculate Travel Distance to El Monte Convalescent Hospital

Add your location

Address

Staffing Data (Q2 2025)

This data corresponds to Q2 2025 and is based on CMS Payroll-Based Journal.

Total staff 138
Employees 133
Contractors 5
Staff to resident ratio 1.44:1
1437400% better than California average

California average ratio: 0.00:1

Avg staff/day 66
Average shift 7.6 hours
0% compared with California average

California average: 7.7 hours

Total staff hours (quarter) 45,831
Nursing staff breakdown
Registered Nurse

Manages medical care and health needs.

Total count 5
Average shift length Info Average shift length. Calculated as total hours divided by days worked and average staff per day. 8.5 hours

No contractors work on this role.

Licensed Practical Nurse

Assists with medical care and medications.

Total count 27
Average shift length Info Average shift length. Calculated as total hours divided by days worked and average staff per day. 7.7 hours

No contractors work on this role.

Certified Nursing Assistant

Helps with daily care and mobility.

Total count 72
Average shift length Info Average shift length. Calculated as total hours divided by days worked and average staff per day. 7.7 hours

This role is partially covered by contractors.

Contractor staffing

Total hours from contractors

0.4%

181 contractor hours this quarter

Certified Nursing Assistant: 3 RN Director of Nursing: 1 Clinical Nurse Specialist: 1
Staff by category
Certified Nursing Assistant 69 3 72 24,501 91 100% 7.7
Licensed Practical Nurse 27 0 27 7,640 91 100% 7.7
Registered Nurse 5 0 5 1,720 91 100% 8.5
RN Director of Nursing 4 1 5 1,699 81 89% 8.1
Physical Therapy Aide 5 0 5 1,697 80 88% 6.8
Dental Services Staff 3 0 3 1,485 83 91% 8.4
Administrator 4 0 4 1,472 79 87% 7.6
Other Dietary Services Staff 3 0 3 1,415 91 100% 8
Speech Language Pathologist 3 0 3 1,091 77 85% 7.7
Respiratory Therapy Technician 2 0 2 693 77 85% 7.1
Clinical Nurse Specialist 1 1 2 563 63 69% 7.7
Dietitian 1 0 1 538 66 73% 8.2
Nurse Practitioner 1 0 1 512 64 70% 8
Physical Therapy Assistant 3 0 3 390 82 90% 3.3
Qualified Social Worker 1 0 1 383 57 63% 6.7
Physical Therapist 1 0 1 32 5 5% 6.4
72 Certified Nursing Assistant
% of Days 100%
27 Licensed Practical Nurse
% of Days 100%
5 Registered Nurse
% of Days 100%
5 RN Director of Nursing
% of Days 89%
5 Physical Therapy Aide
% of Days 88%
3 Dental Services Staff
% of Days 91%
4 Administrator
% of Days 87%
3 Other Dietary Services Staff
% of Days 100%
3 Speech Language Pathologist
% of Days 85%
2 Respiratory Therapy Technician
% of Days 85%
2 Clinical Nurse Specialist
% of Days 69%
1 Dietitian
% of Days 73%
1 Nurse Practitioner
% of Days 70%
3 Physical Therapy Assistant
% of Days 90%
1 Qualified Social Worker
% of Days 63%
1 Physical Therapist
% of Days 5%

Facility Characteristics

Source: CMS Long-Term Care Facility Characteristics (Data as of Jan 2026)

Total census
96 residents
Residents by payment source
Medicare
31 residents (32.3%)
Medicaid
50 residents (52.1%)
Private pay or other
15 residents (15.6%)
Programs & Services
Residents' Group

Residents meet regularly to discuss policies, care quality, and activities

Active Resident Council

Organized group of residents that meets regularly to discuss facility policies, quality of life, and activities.

Quality of care over time

These measures show how residents usually do over time at this home, based on health outcomes and preventive care.

High-risk clinical events score Info A composite score based on pressure ulcers, falls with injury, weight loss, walking ability decline, and activities of daily living decline. 7.1
6% worse than California average

California average: 6.6

Functional decline score Info A composite score based on activities of daily living decline, walking ability decline, and incontinence. 13.1
15% worse than California average

California average: 11.3

Long-stay resident measures
Need for Help with Daily Activities Increased Info Percent of long-stay residents whose need for help with daily activities has increased 18.8%
70% worse than California average

California average: 11.1%

Walking Ability Worsened Info Percent of long-stay residents whose ability to move independently worsened 10.1%
16% better than California average

California average: 12.0%

Low Risk Residents with Bowel/Bladder Incontinence Info Percent of low risk long-stay residents who lose control of their bowels or bladder 10.4%
8% better than California average

California average: 11.3%

Falls with Major Injury Info Percent of long-stay residents experiencing one or more falls with major injury 0.0%
100% better than California average

California average: 1.7%

High Risk Residents with Pressure Ulcers Info Percent of long-stay high risk residents with pressure ulcers 4.3%
14% better than California average

California average: 5.0%

Urinary Tract Infection Info Percent of long-stay residents with a urinary tract infection 0.4%
71% better than California average

California average: 1.2%

Lost Too Much Weight Info Percent of long-stay residents who lose too much weight 2.2%
47% better than California average

California average: 4.2%

Depressive Symptoms Info Percent of long-stay residents who have depressive symptoms 14.7%
119% worse than California average

California average: 6.7%

Antipsychotic Use Info Percent of long-stay residents who received an antipsychotic medication 21.1%
109% worse than California average

California average: 10.1%

Pneumococcal Vaccine Info Percent of long-stay residents assessed and appropriately given the pneumococcal vaccine 100.0%
In line with California average

California average: 98.5%

Influenza Vaccine Info Percent of long-stay residents assessed and appropriately given the seasonal influenza vaccine 100.0%
In line with California average

California average: 98.2%

Short-stay resident measures
Pneumococcal Vaccine Info Percent of short-stay residents assessed and appropriately given the pneumococcal vaccine 97.0%
In line with California average

California average: 94.0%

Antipsychotic medication increase Info Percent of short-stay residents who newly received an antipsychotic medication 3.3%
128% worse than California average

California average: 1.5%

Influenza Vaccine Info Percent of short-stay residents assessed and appropriately given the seasonal influenza vaccine 89.8%
In line with California average

California average: 93.2%

Penalties and fines

Federal penalties imposed by CMS for regulatory violations, including civil money penalties (fines) and denials of payment for new Medicare/Medicaid admissions.

Source: CMS Penalties Database (Data as of Jan 2026)

Total fines amount $14K
75% lower than California average

California average: $55K

Number of fines 3
27% more fines than California average

California average: 2.4

Payment Denials Info Serious action where Medicare and/or Medicaid temporarily stops payments for new residents until issues are fixed. 0
100% fewer payment denials than California average

California average: 0.5

Fines amount comparison
This facility $14K
California average $55K
Penalty History

Penalties are imposed by CMS for violations of federal nursing home regulations.

Civil Money Penalty Info Fines imposed for noncompliance, which can be assessed per day or per instance of violation. Aug 5, 2024
$9K
Civil Money Penalty Info Fines imposed for noncompliance, which can be assessed per day or per instance of violation. Jun 26, 2023
$2K
Civil Money Penalty Info Fines imposed for noncompliance, which can be assessed per day or per instance of violation. Jun 5, 2023
$3K

Last updated: Jan 2026

Guides for Better Senior Living

Care Cost Calculator: See Prices in Your Area

Nursing Home Data Explorer

Don’t Wait Too Long: 7 Red Flag Signs Your Parent Needs Assisted Living Now

The True Cost of Assisted Living in 2025 – And How Families Are Paying For It

Understanding Senior Living Costs: Pricing Models, Discounts & Financial Assistance

Financial Aid for California Seniors

Get financial aid guidance

Multipurpose Senior Services Program

MSSP (Medi-Cal Waiver)

Age 65+, California resident, Medi-Cal eligible, nursing home risk.

~$2,829/month (300% FBR, individual).

$2,000 (individual), $3,000 (couple).

County-managed; waitlists possible.

In-Home Supportive Services (IHSS)

California IHSS

Age 65+, California resident, Medicaid-eligible or low-income.

~$1,732/month (individual, Medi-Cal threshold).

$2,000 (individual).

Can hire family as caregivers.

Multipurpose Senior Services Program (MSSP)

CA MSSP

Age 65+, California resident, Medi-Cal-eligible, nursing home-eligible but community-capable.

~$2,829/month (300% FBR, individual).

$2,000 (individual).

Available in 38 counties; waitlists common.

Property Tax Postponement Program (PTP)

CA PTP

Age 62+, California resident, own and live in home, 40% equity.

~$51,500/year (household, adjusted annually).

Equity-based; no strict asset cap.

Deferred taxes accrue interest (5% as of 2024); repaid upon sale/death.

Assisted Living Waiver (ALW)

CA ALW

Age 65+ or disabled, California resident, Medi-Cal-eligible, nursing home-eligible.

~$2,829/month (300% FBR, individual).

$2,000 (individual).

Available in 15 counties (e.g., LA, Sacramento); waitlists common.

California CARES Program

CA CARES

Caregivers of California residents 60+ needing help with 3+ daily activities; no caregiver age limit.

No strict limit; cost-sharing above ~$2,500/month threshold.

Not applicable; need-based.

High demand in urban areas; complements IHSS respite.

Low-Income Home Energy Assistance Program (LIHEAP)

CA LIHEAP

Age 60+ priority, California resident, low-income, utility/heating need.

~$2,510/month (200% of poverty level, individual).

Not applicable; income-focused.

High demand in inland/coastal extremes; weatherization capped at $5,000/home.

Tour Icon
Planning a tour? Check our touring checklist.
Chat Icon
Thinking of living here? We can help you speak to a current resident