Total health inspections
22
Illinois average 10.4
Last Health inspection on Sep 2025

We arrange tours, appointments, and even moving support so you don’t have to
Thank you for your interest!
Our team will be in touch shortly to help with next steps.

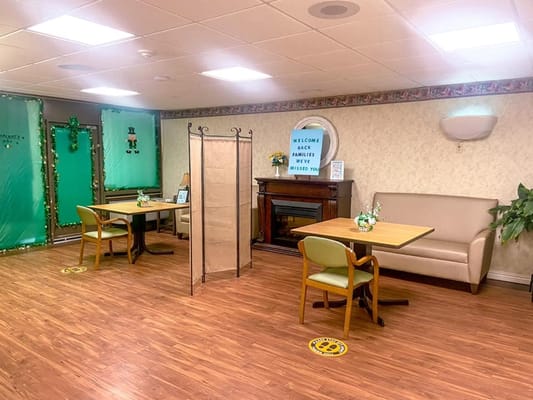
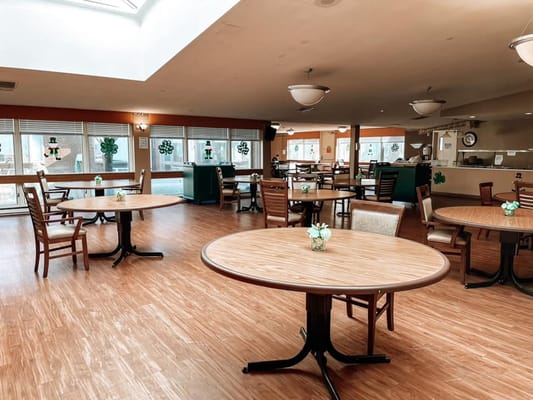


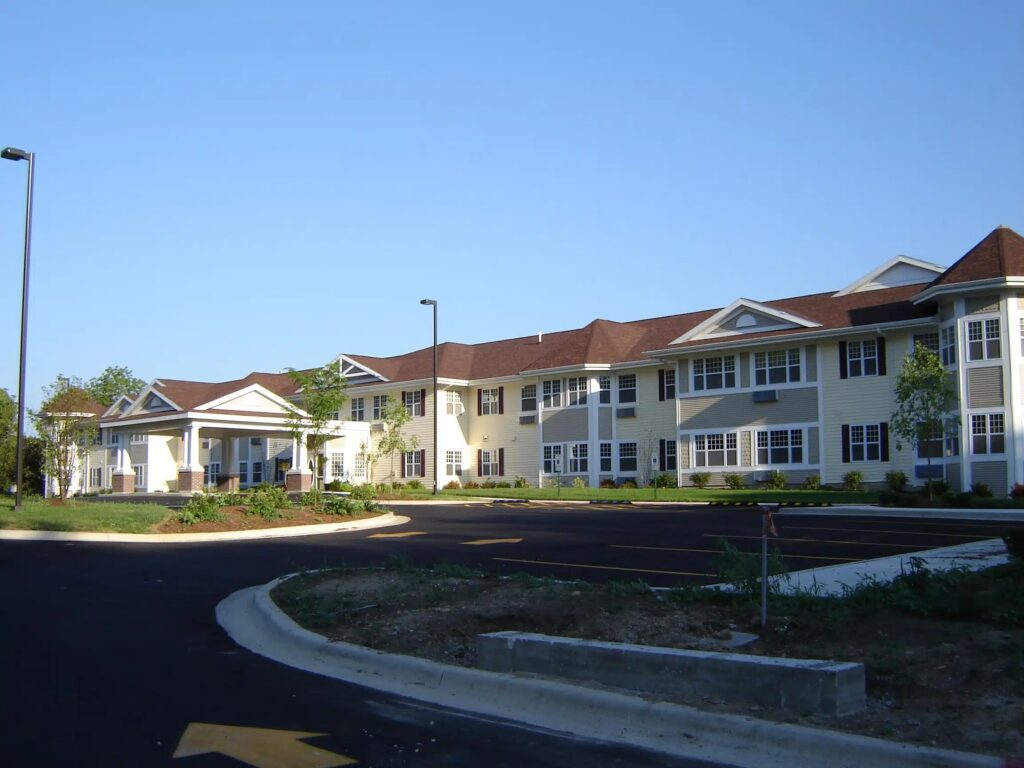
Experience exceptional care at Fair Havens Senior Living, a one-of-a-kind community in Decatur, IL, offering a wide range of care options. These include independent living, dementia care, rehabilitation, long-term care, and hospice. Residents can keep their peace of mind with a kind and highly trained team helping with their needs.
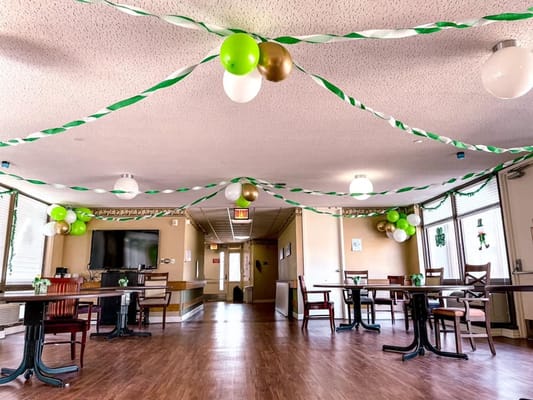
Enriching activities and engaging programs are also conducted to keep residents active and socially connected. Mealtimes foster comfort and satisfy dietary needs with delicious and healthy dining options. Residents are guaranteed to thrive in their golden years, especially with its comprehensive care options and state-of-the-art amenities.
Candy Cane serves as the Administrator at Fair Havens Senior Living, overseeing the community's operations and ensuring a welcoming environment for residents. Candy is the primary contact for the community and is dedicated to providing exceptional care and service to all residents and their families.
Offers a balance of services and community atmosphere.
Lower occupancy suggests more openings may be available.
Most residents typically stay for a few weeks or months before returning home or moving on.
46% of new residents, usually for short-term rehab.
32% of new residents, often for short stays.
22% of new residents, often for long-term daily care.
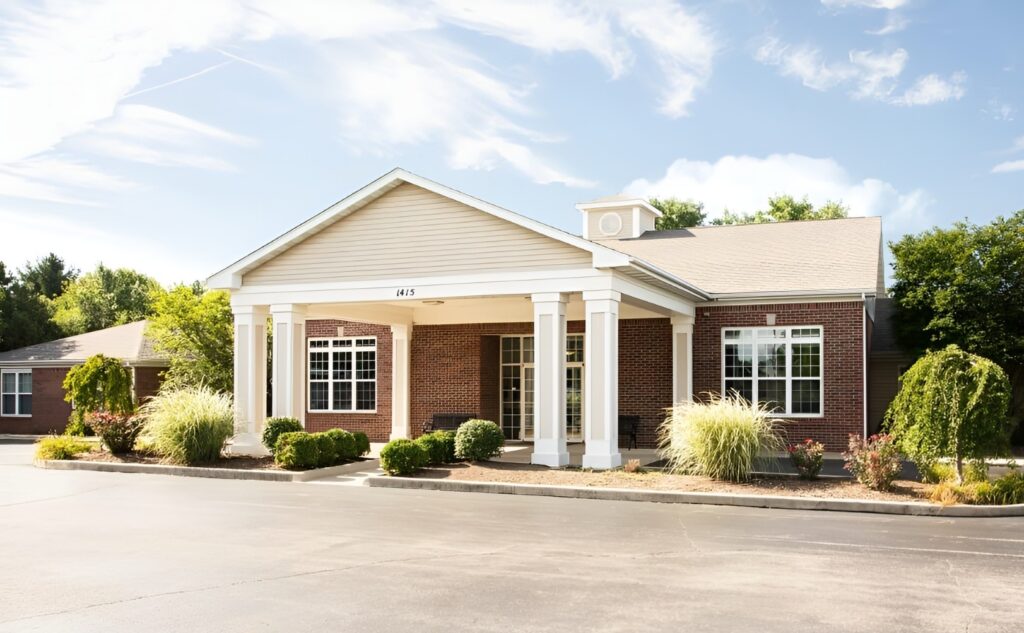
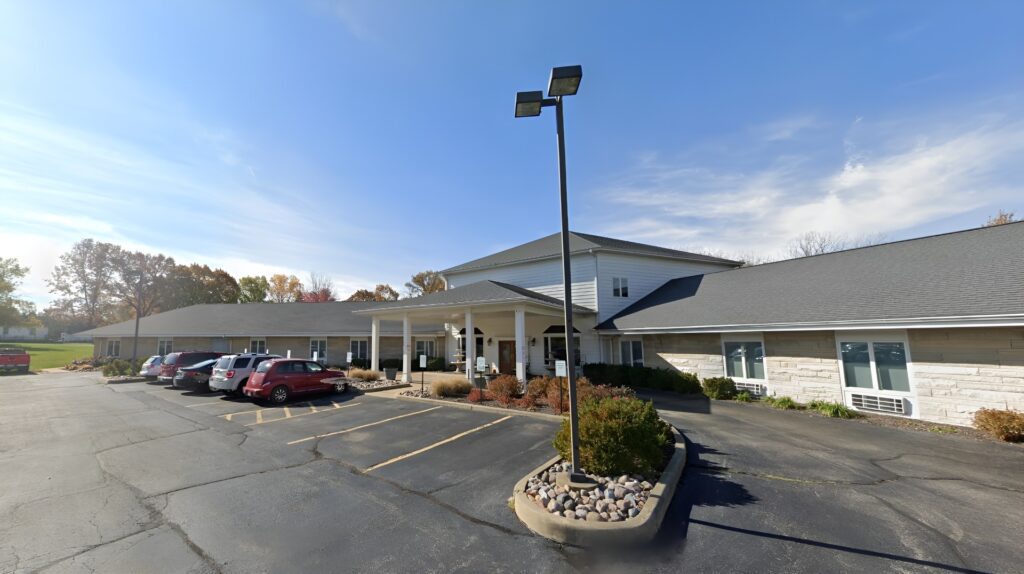
Building Type: Single-story

On-site Medical Care and Health Services
Illinois average 10.4
Last Health inspection on Sep 2025
Illinois average 36.8
Illinois average 3.68
Health citations are formal notices following inspections when they fail to comply with safety and care standards.
36 of 90 citations resulted from standard inspections; and 54 of 90 resulted from complaint investigations.
Illinois average: 0.7
Illinois average: 3.6
Data sourced from CMS Health Deficiencies reports. Citation severity codes range from A (least serious) to L (most serious). Immediate Jeopardy (J-L) citations indicate situations where the facility's noncompliance has placed residents at risk of death or serious harm.
Assisted Living A licensed, long-term care setting for seniors or individuals with disabilities who need help with daily activities — like bathing, dressing, and medication management — but not 24-hour skilled nursing. Offers housing, meals, and around-the-clock support while aiming to maximize resident independence.
Independent Living Lifestyle-focused communities for older adults offering dining, activities, and transportation with minimal personal care. Best for active, independent seniors who want community without medical support.
Memory Care Secured, specialized care for people living with Alzheimer's or dementia. Staff trained in cognitive impairment, with higher staff-to-resident ratios and an environment designed to reduce confusion and wandering risk.
Nursing Home Licensed facility providing 24/7 skilled nursing care for residents with complex, ongoing medical needs. Staffed by RNs, LPNs, and CNAs. Inspected and star-rated annually by CMS. Accepts Medicare (short-term rehab) and Medicaid (long-term care).
Independent Living Lifestyle-focused communities for older adults offering dining, activities, and transportation with minimal personal care. Best for active, independent seniors who want community without medical support.
Assisted Living A licensed, long-term care setting for seniors or individuals with disabilities who need help with daily activities — like bathing, dressing, and medication management — but not 24-hour skilled nursing. Offers housing, meals, and around-the-clock support while aiming to maximize resident independence.
Independent Living Lifestyle-focused communities for older adults offering dining, activities, and transportation with minimal personal care. Best for active, independent seniors who want community without medical support.
Memory Care Secured, specialized care for people living with Alzheimer's or dementia. Staff trained in cognitive impairment, with higher staff-to-resident ratios and an environment designed to reduce confusion and wandering risk.
Independent Living Lifestyle-focused communities for older adults offering dining, activities, and transportation with minimal personal care. Best for active, independent seniors who want community without medical support.
Independent Living Lifestyle-focused communities for older adults offering dining, activities, and transportation with minimal personal care. Best for active, independent seniors who want community without medical support.
![]() 2.9 miles from city center
2.9 miles from city center
Add your location
This data corresponds to Q2 2025 and is based on CMS Payroll-Based Journal.
Illinois average ratio: 1.90:1
Illinois average: 7.6 hours
Manages medical care and health needs.
No contractors work on this role.
Assists with medical care and medications.
This role is partially covered by contractors.
Helps with daily care and mobility.
No contractors work on this role.
Total hours from contractors
2,878 contractor hours this quarter
| Certified Nursing Assistant | 69 | 0 | 69 | 19,778 | 91 | 100% | 7.4 |
| Licensed Practical Nurse | 22 | 2 | 24 | 7,581 | 91 | 100% | 9.2 |
| Registered Nurse | 9 | 0 | 9 | 1,630 | 89 | 98% | 7.2 |
| Physical Therapy Aide | 0 | 3 | 3 | 950 | 67 | 74% | 7.4 |
| Physical Therapy Assistant | 0 | 1 | 1 | 595 | 65 | 71% | 9.2 |
| Respiratory Therapy Technician | 0 | 3 | 3 | 522 | 62 | 68% | 8.3 |
| Speech Language Pathologist | 0 | 3 | 3 | 513 | 68 | 75% | 6 |
| Nurse Practitioner | 1 | 0 | 1 | 375 | 47 | 52% | 8 |
| Administrator | 1 | 0 | 1 | 360 | 45 | 49% | 8 |
| Mental Health Service Worker | 1 | 0 | 1 | 268 | 33 | 36% | 8.1 |
| Qualified Social Worker | 0 | 2 | 2 | 141 | 38 | 42% | 3.7 |
| Occupational Therapy Aide | 0 | 2 | 2 | 69 | 14 | 15% | 4.6 |
| Other Dietary Services Staff | 4 | 0 | 4 | 68 | 9 | 10% | 5.6 |
| Medical Director | 0 | 1 | 1 | 44 | 9 | 10% | 4.8 |
| Dietitian | 1 | 0 | 1 | 30 | 4 | 4% | 7.5 |
| Occupational Therapy Assistant | 0 | 1 | 1 | 13 | 3 | 3% | 4.3 |
Source: CMS Long-Term Care Facility Characteristics (Data as of Jan 2026)
Residents meet regularly to discuss policies, care quality, and activities
Organized group of residents that meets regularly to discuss facility policies, quality of life, and activities.
Data sourced from CMS Long-Term Care Facility Characteristics quarterly report. Payer mix reflects the current resident census by primary payment source.
These measures show how residents usually do over time at this home, based on health outcomes and preventive care.
Illinois average: 9.7
Illinois average: 18.6
Illinois average: 15.5%
Illinois average: 18.4%
Illinois average: 21.6%
Illinois average: 3.4%
Illinois average: 5.3%
Illinois average: 1.8%
Illinois average: 6.5%
Illinois average: 48.1%
Illinois average: 20.2%
Illinois average: 89.2%
Illinois average: 91.6%
Illinois average: 68.3%
Illinois average: 2.3%
Illinois average: 63.0%
Quality measures are calculated from Minimum Data Set (MDS) assessments. For most measures, lower percentages indicate better care quality.
Federal penalties imposed by CMS for regulatory violations, including civil money penalties (fines) and denials of payment for new Medicare/Medicaid admissions.
Source: CMS Penalties Database (Data as of Jan 2026)
Illinois average: $143K
Illinois average: 3.0
Illinois average: 1.1
Penalties are imposed by CMS for violations of federal nursing home regulations.
Last updated: Jan 2026
Historical financial and operational data for Fair Havens Senior Living based on CMS SNF Cost Reports.
Loading trend charts...
Care Cost Calculator: See Prices in Your Area
Nursing Home Data Explorer
Don’t Wait Too Long: 7 Red Flag Signs Your Parent Needs Assisted Living Now
The True Cost of Assisted Living in 2025 – And How Families Are Paying For It
Understanding Senior Living Costs: Pricing Models, Discounts & Financial Assistance

Touring a community? Use this expert-backed checklist to stay organized, ask the right questions, and find the perfect fit.
We'll send you a PDF version of the touring checklist.