GlenBrook Health Center

Nursing Home
Overview of Glenbrook Health Center

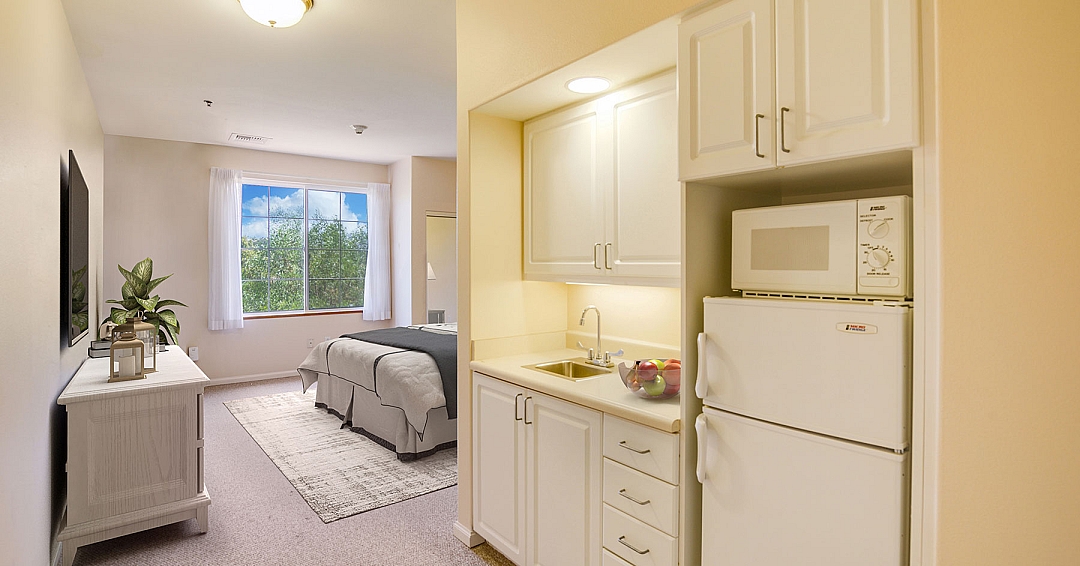
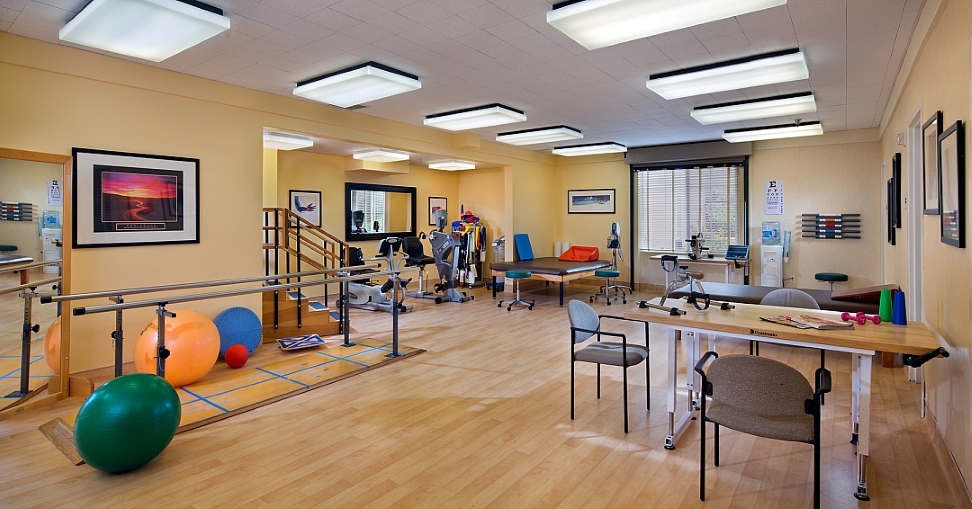
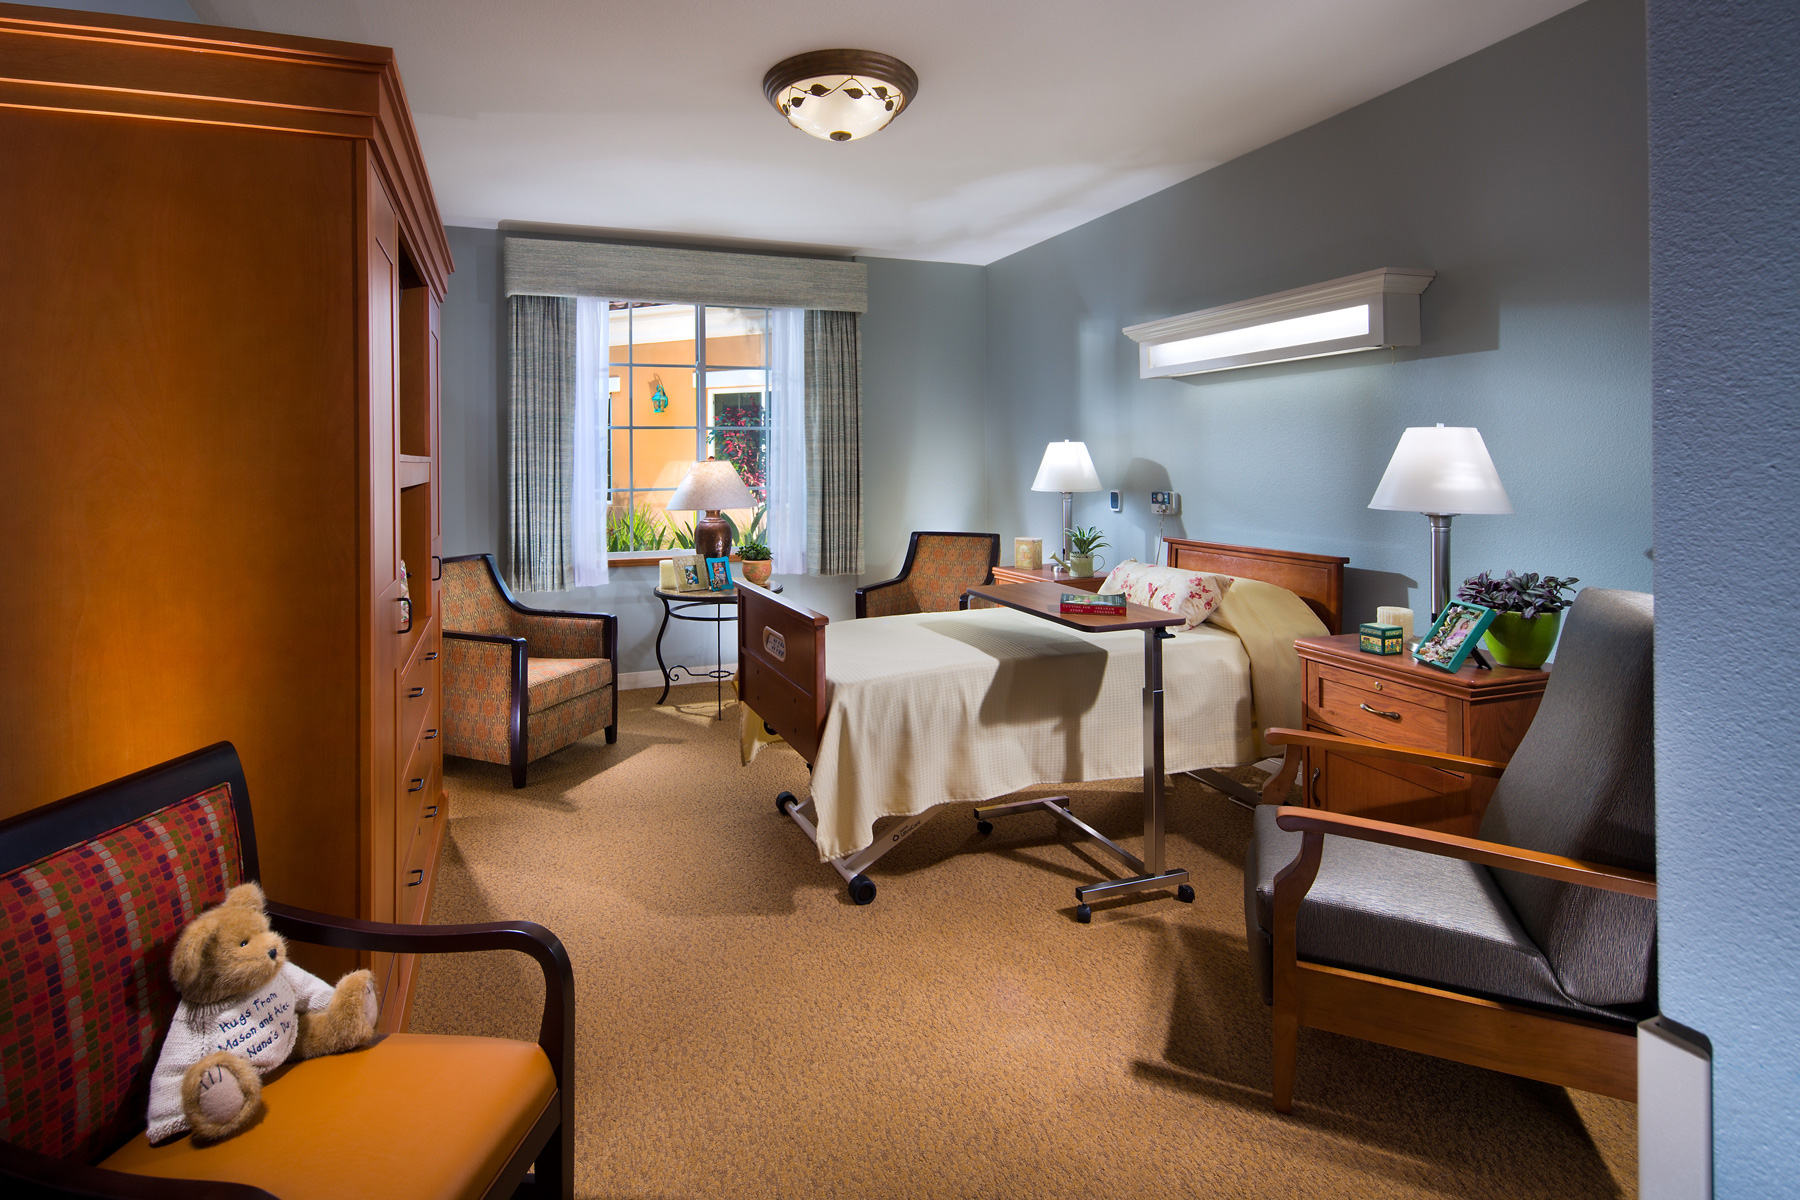
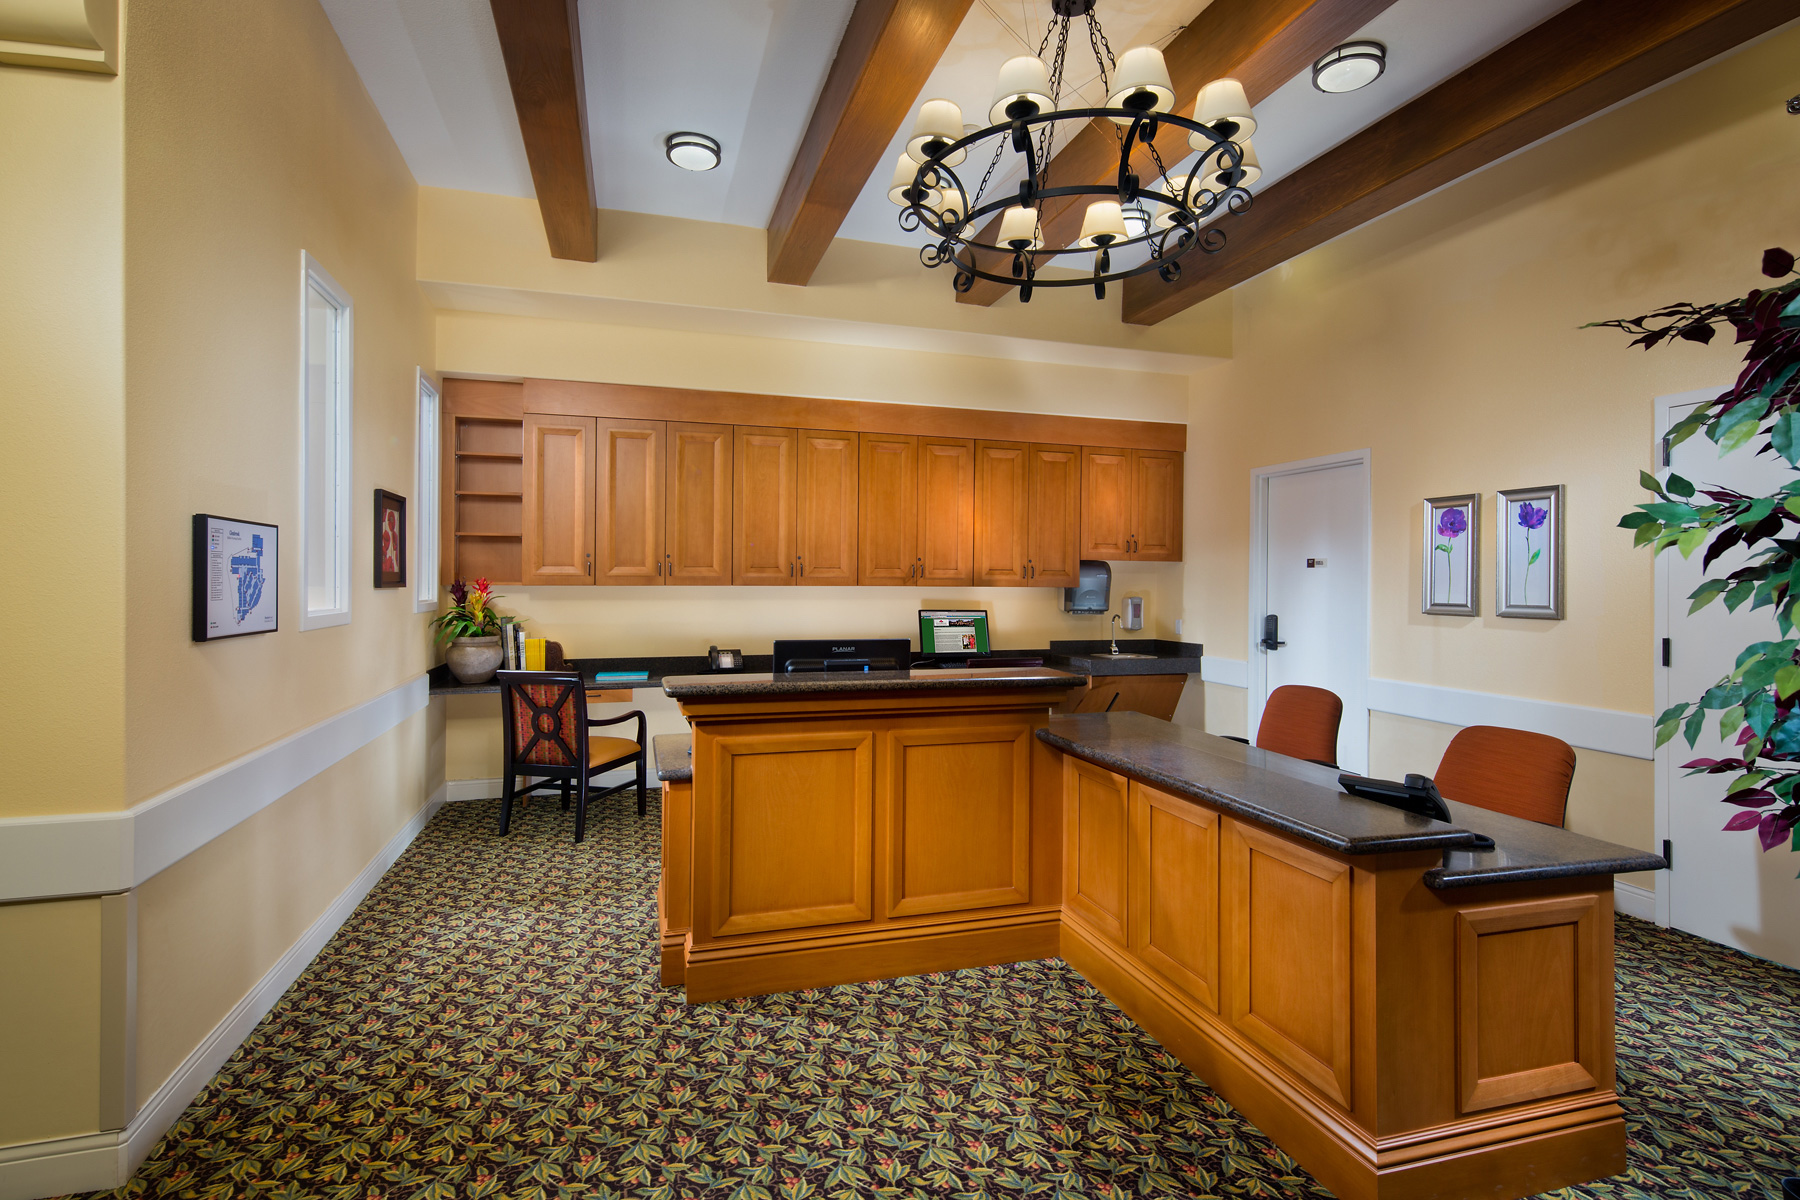
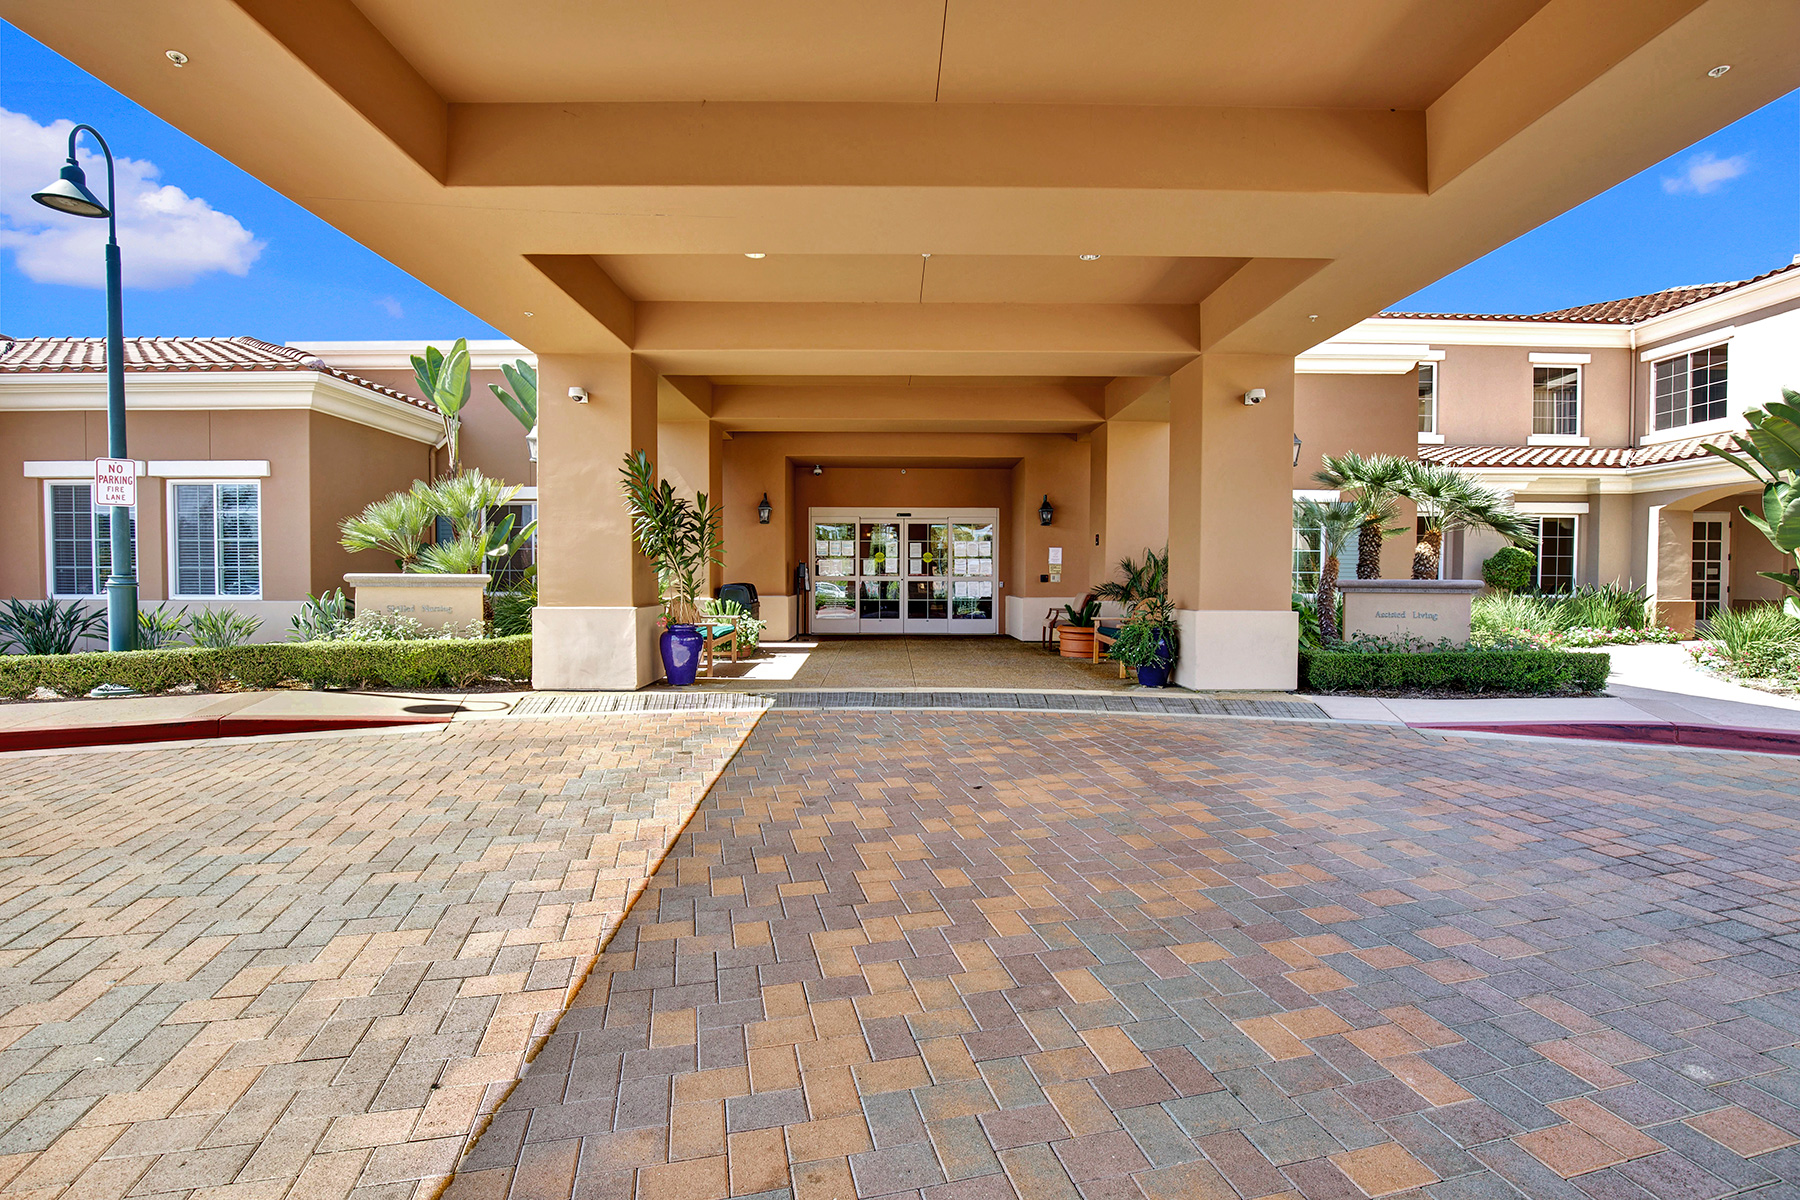
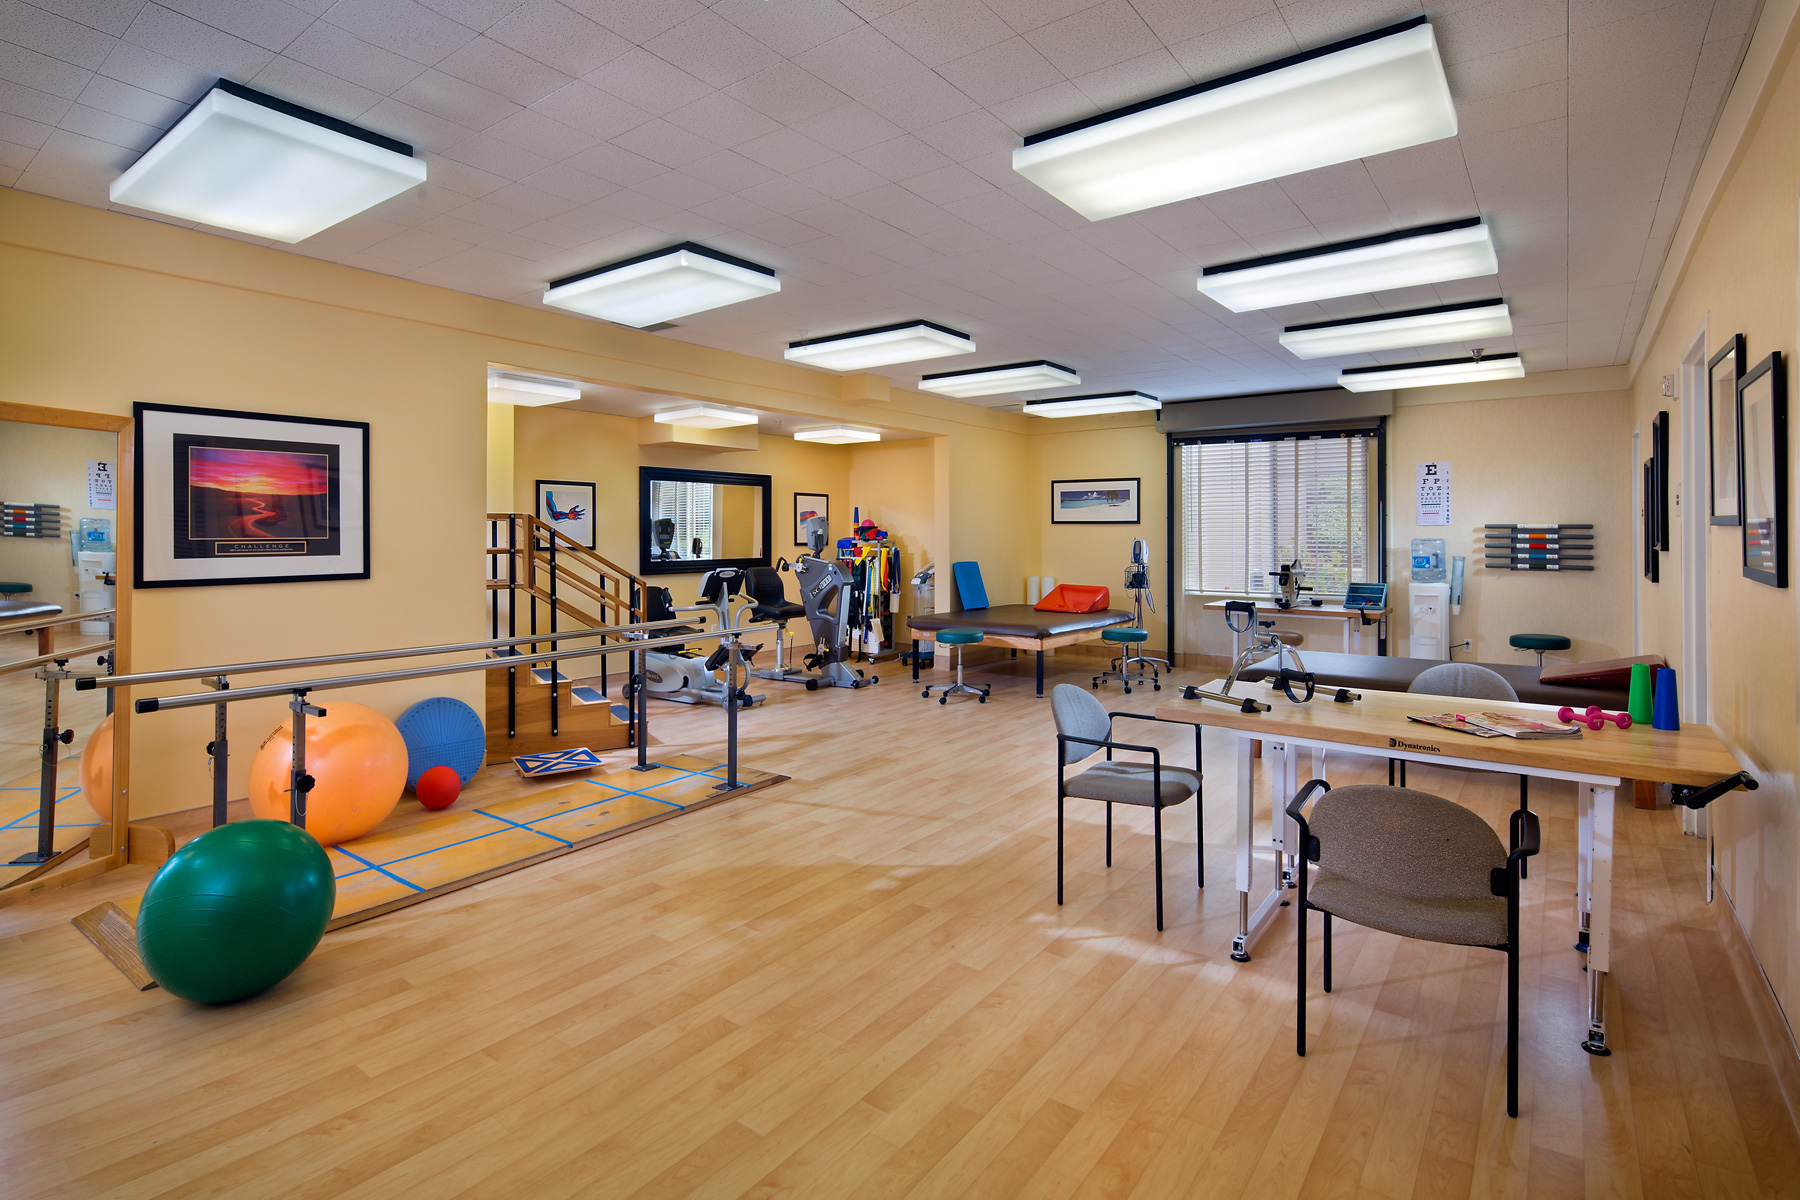
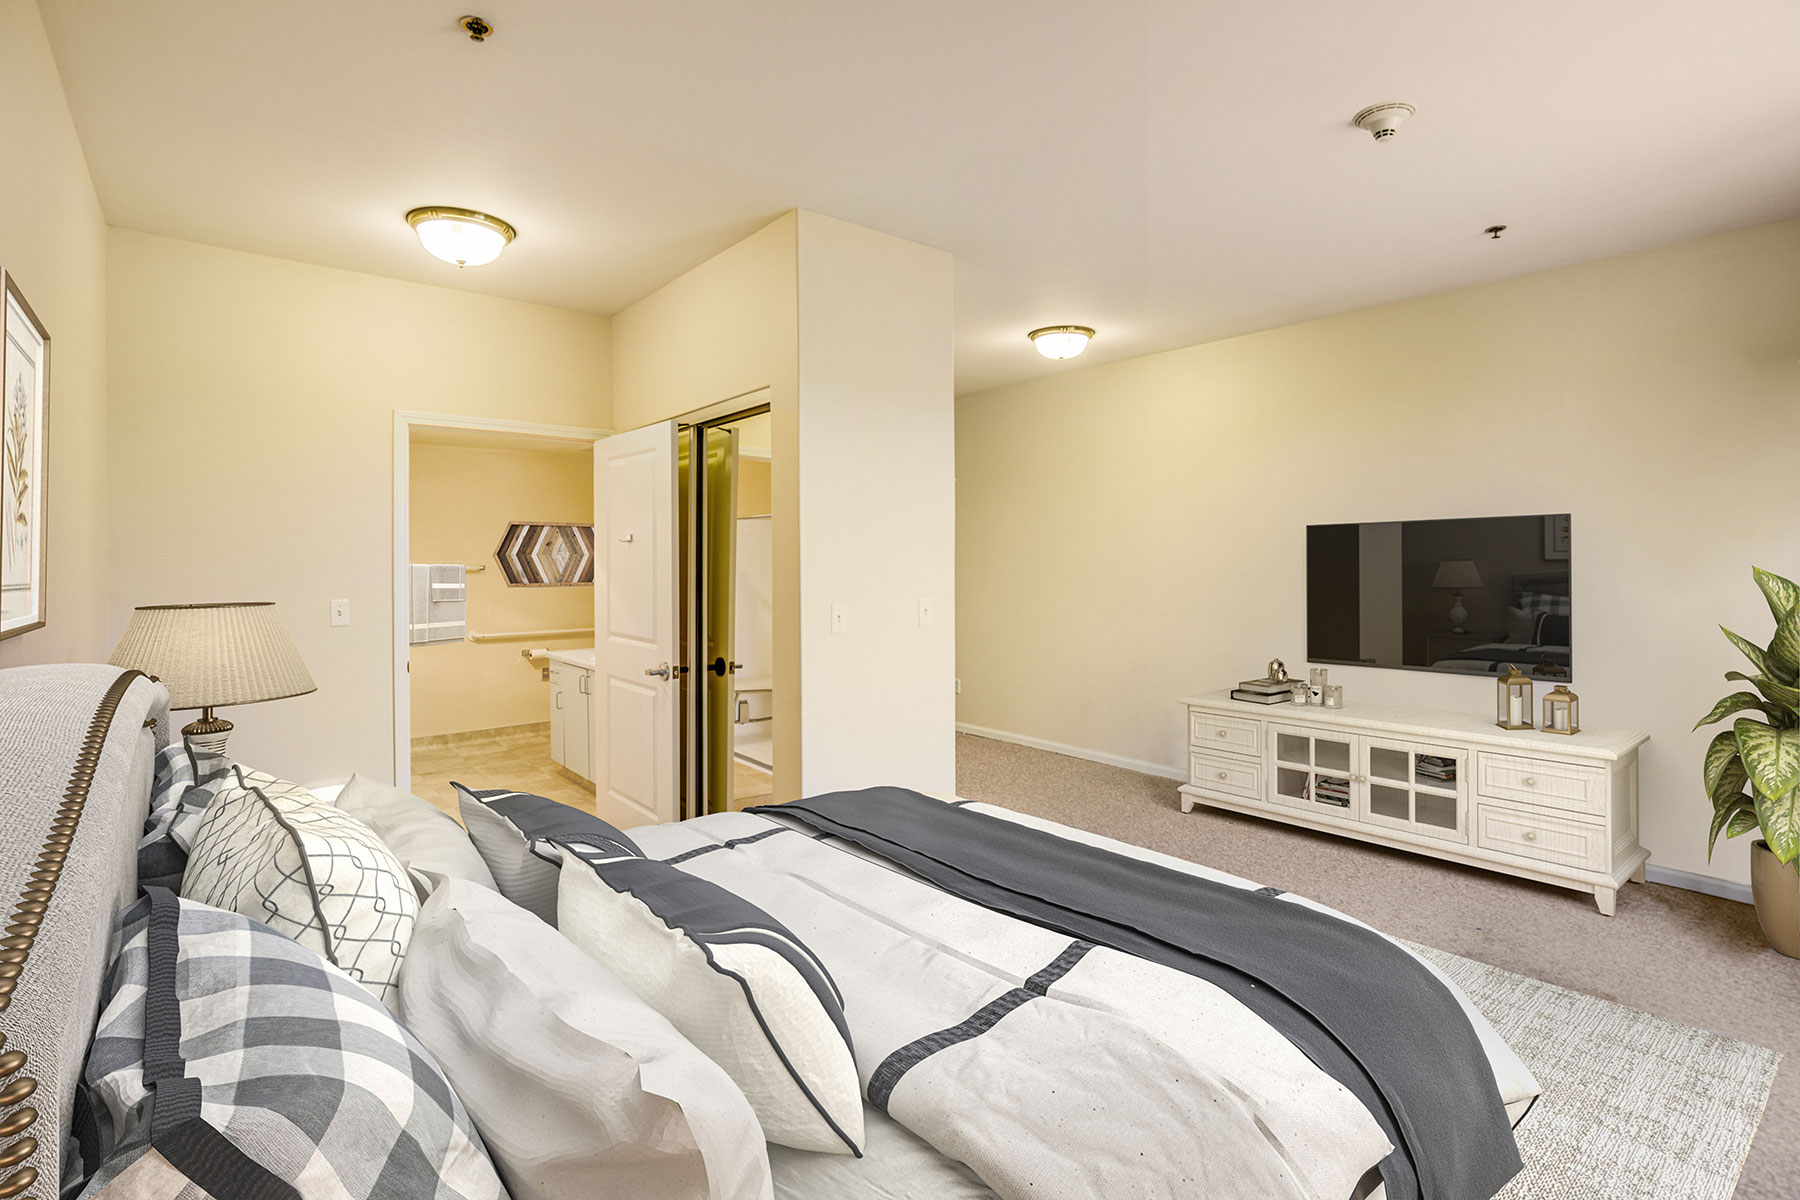
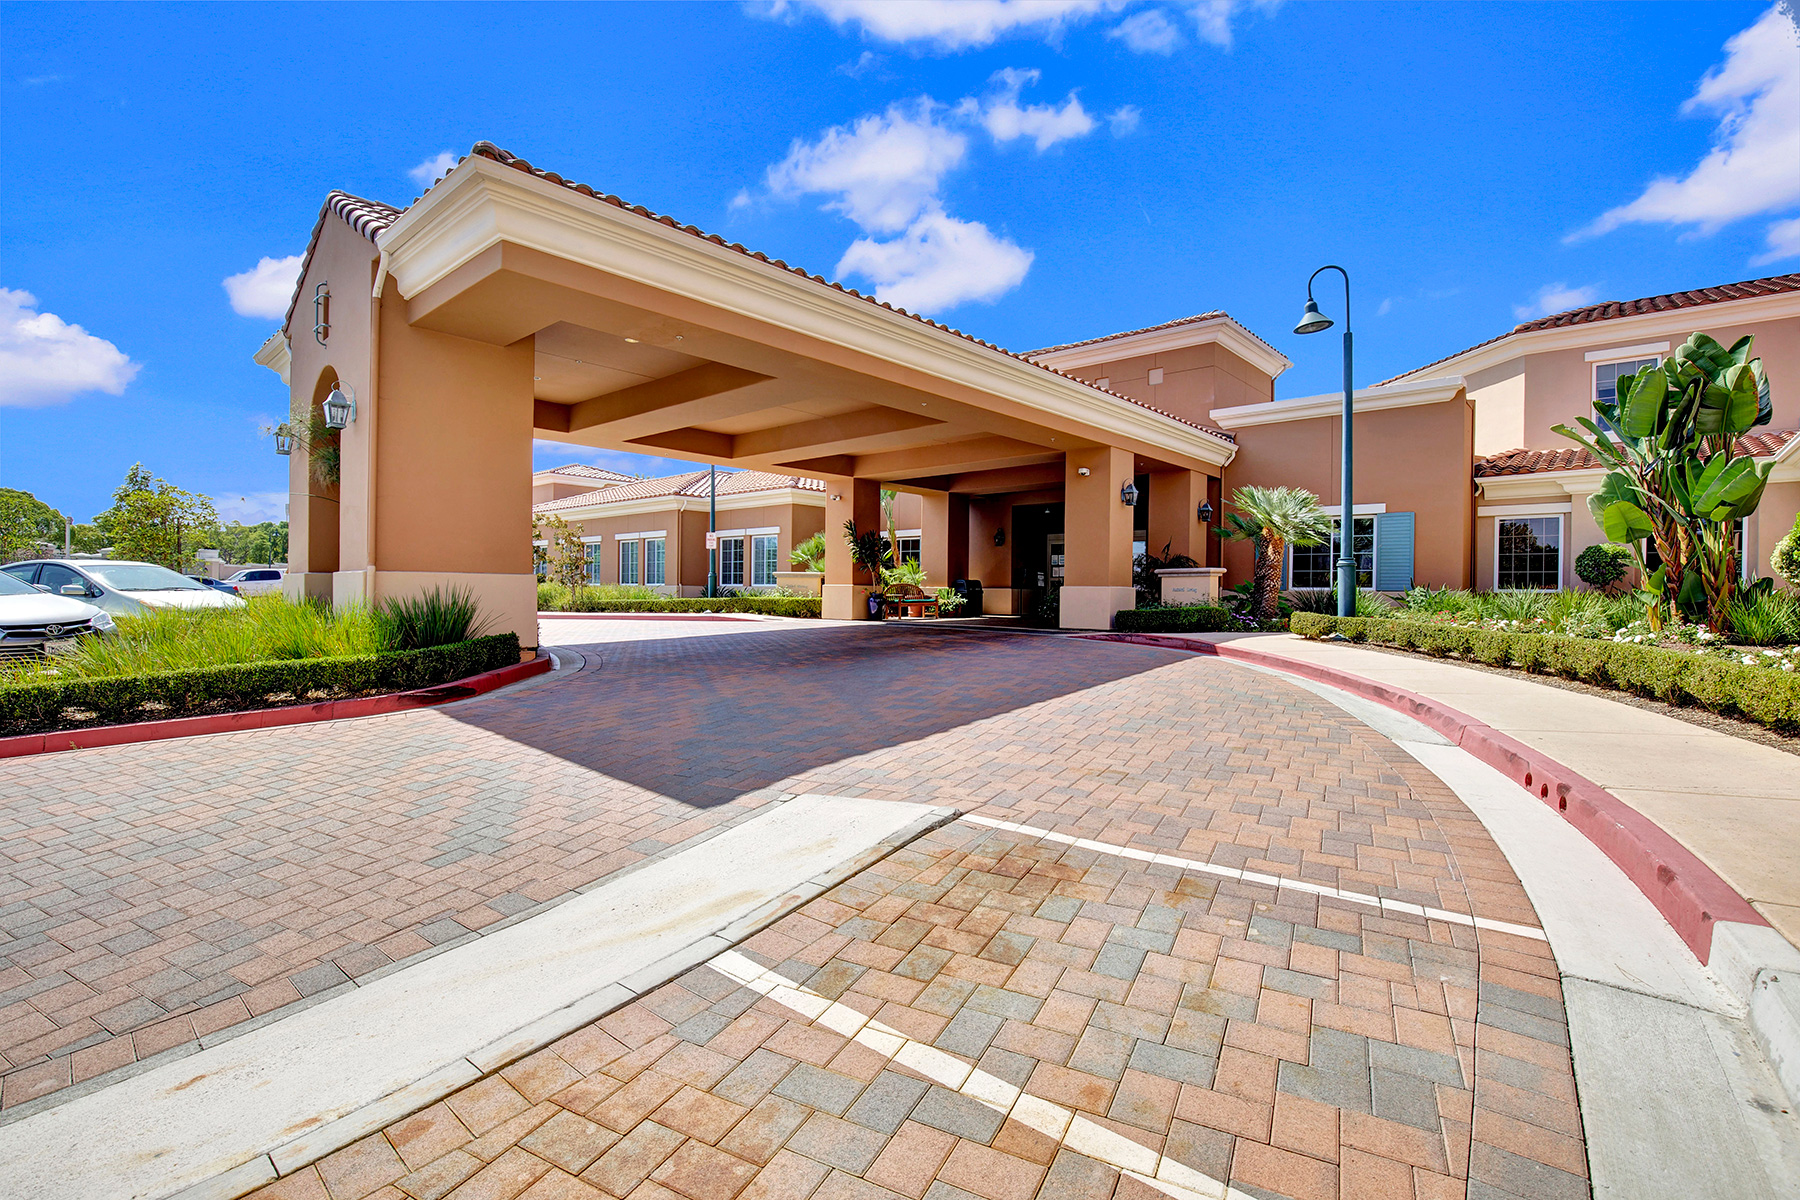
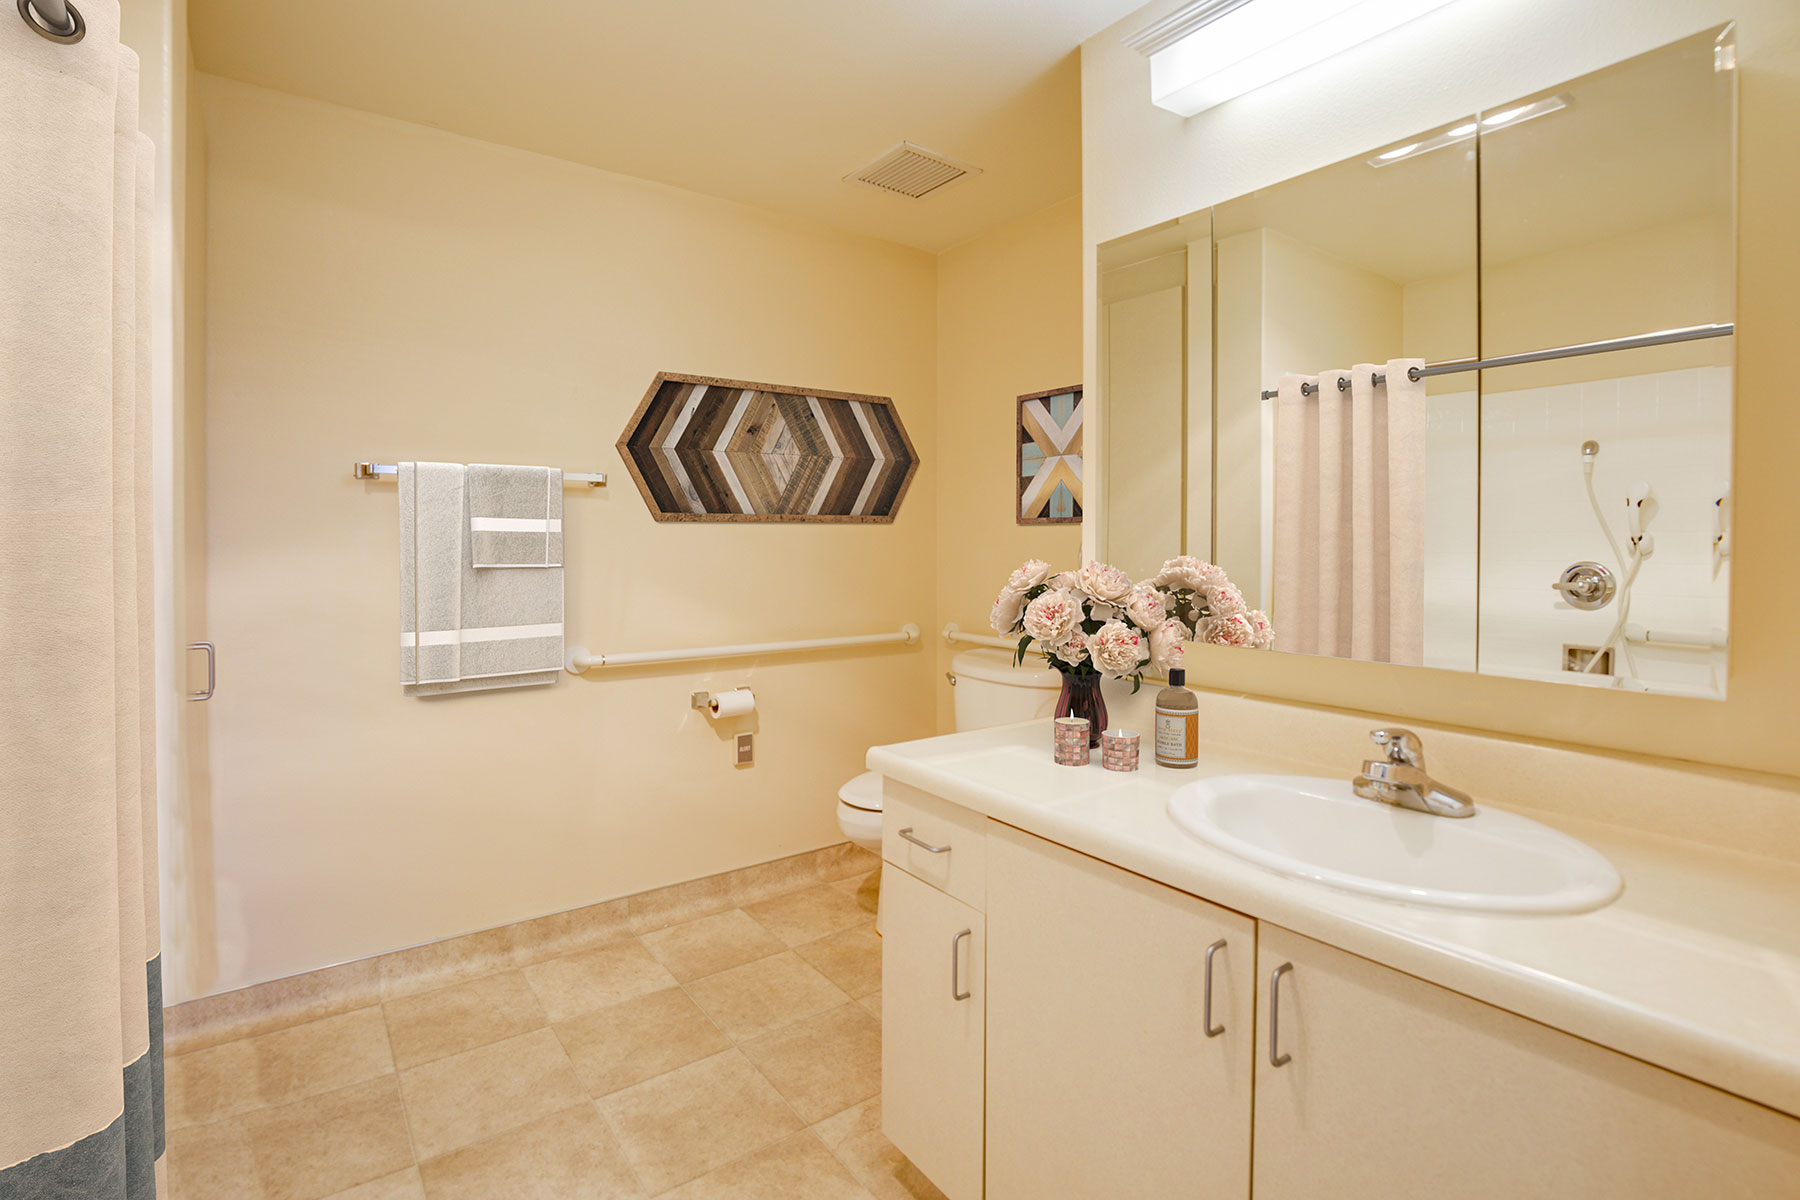
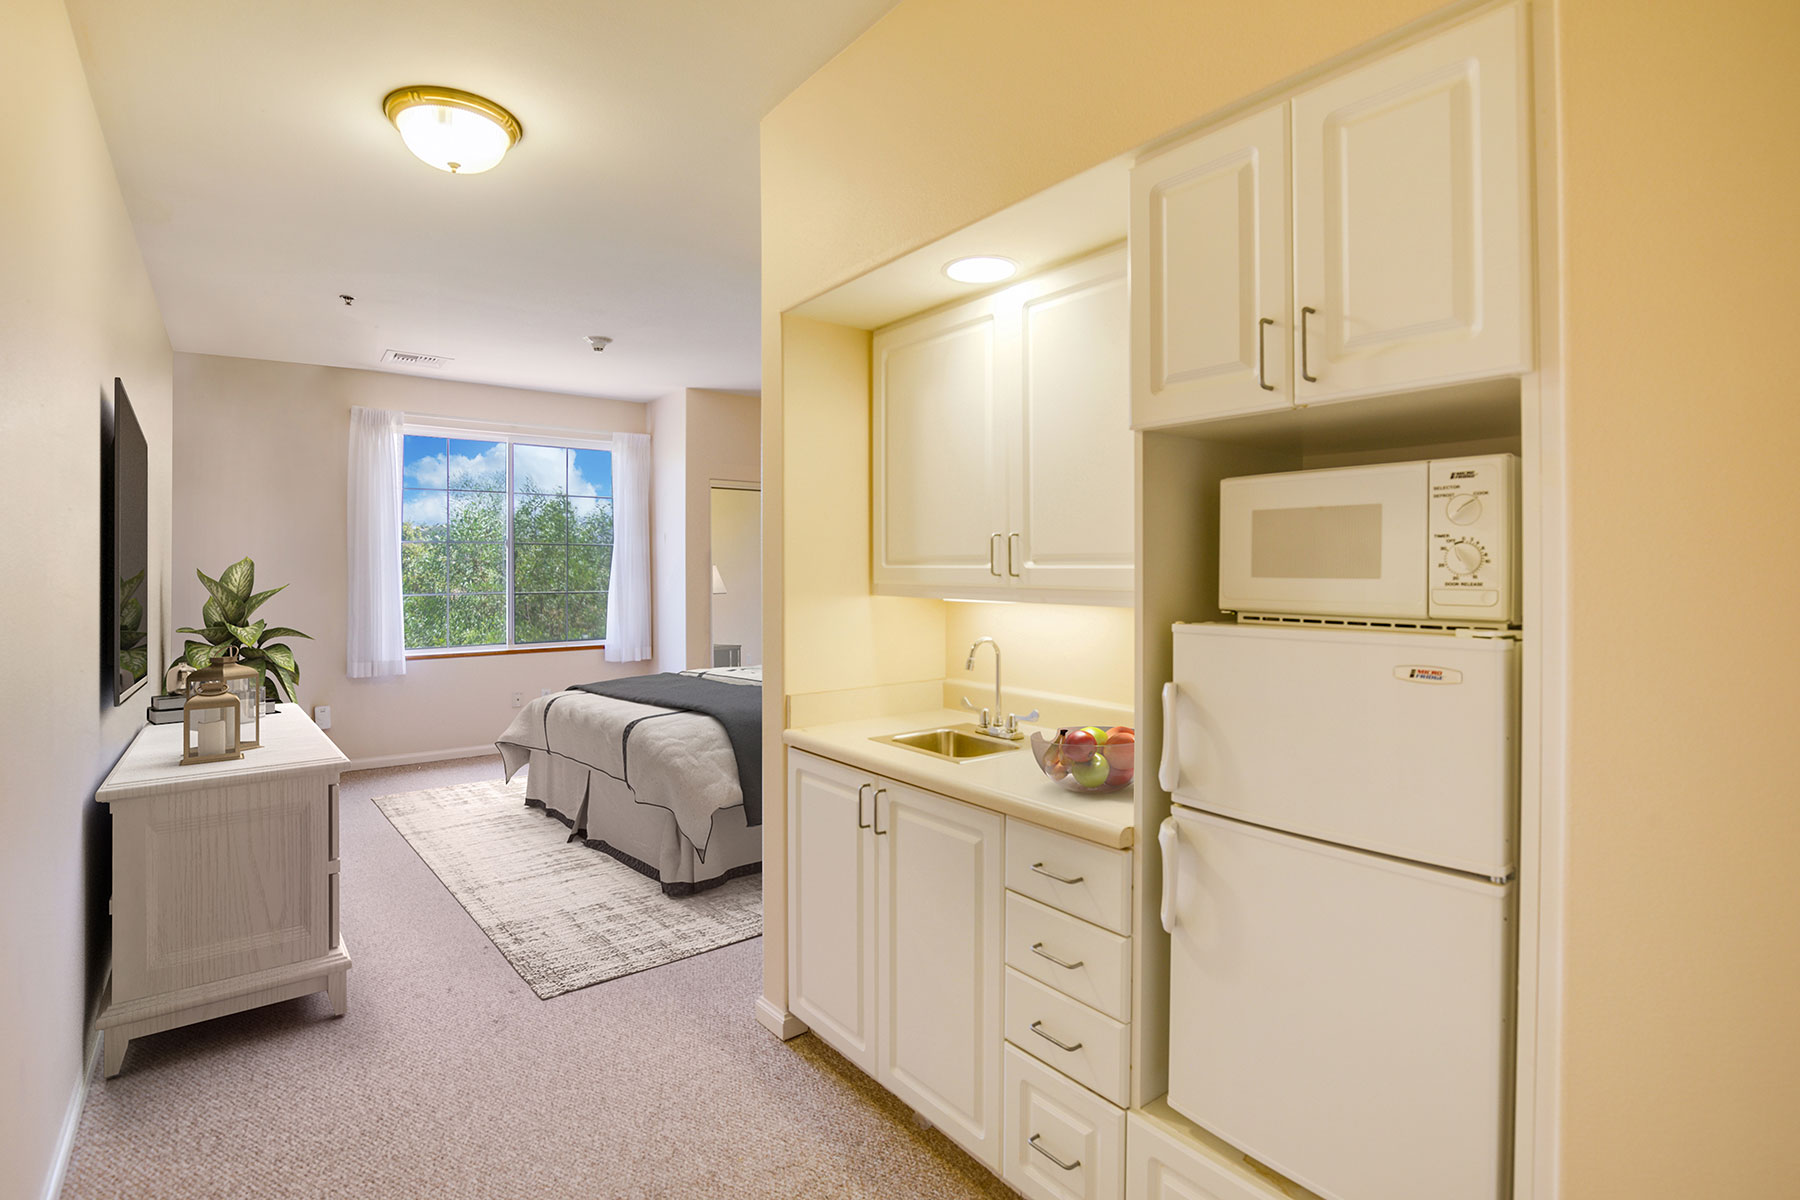
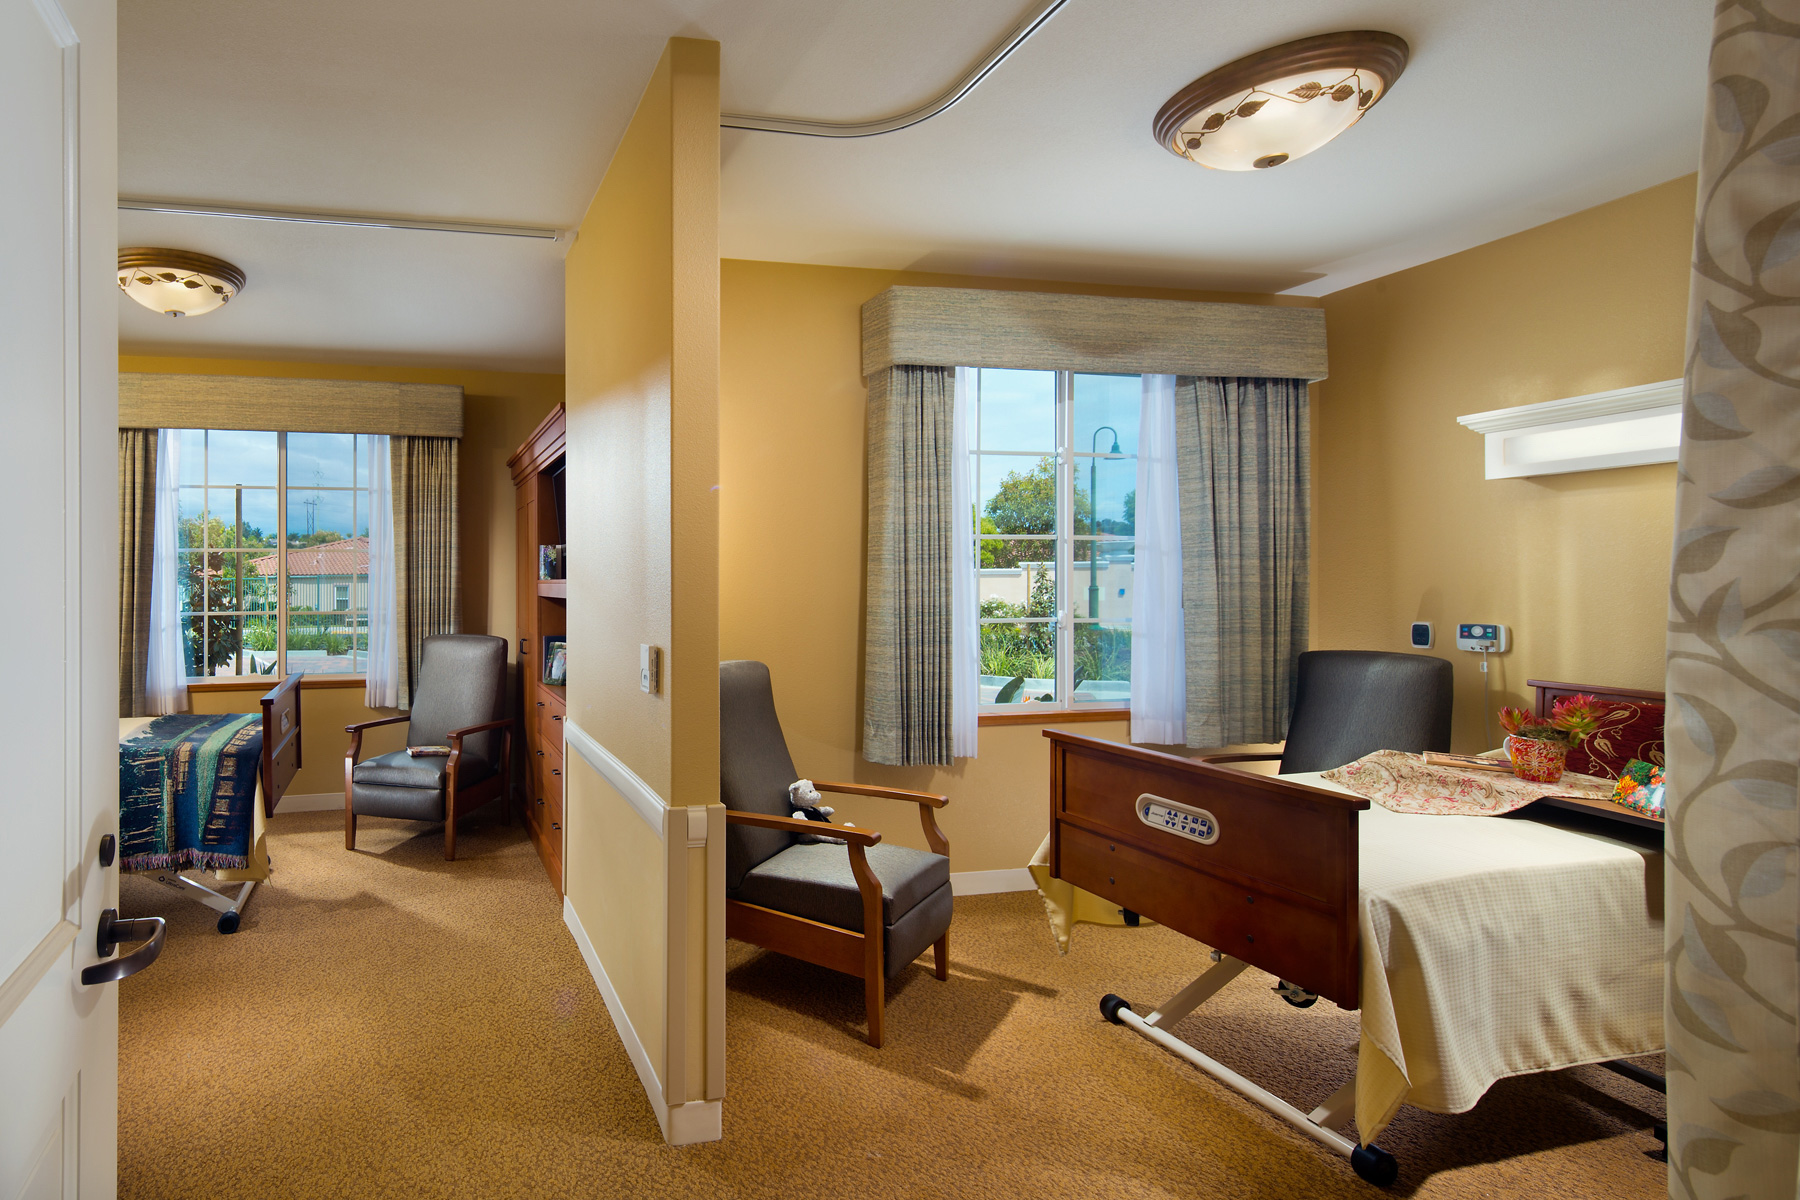
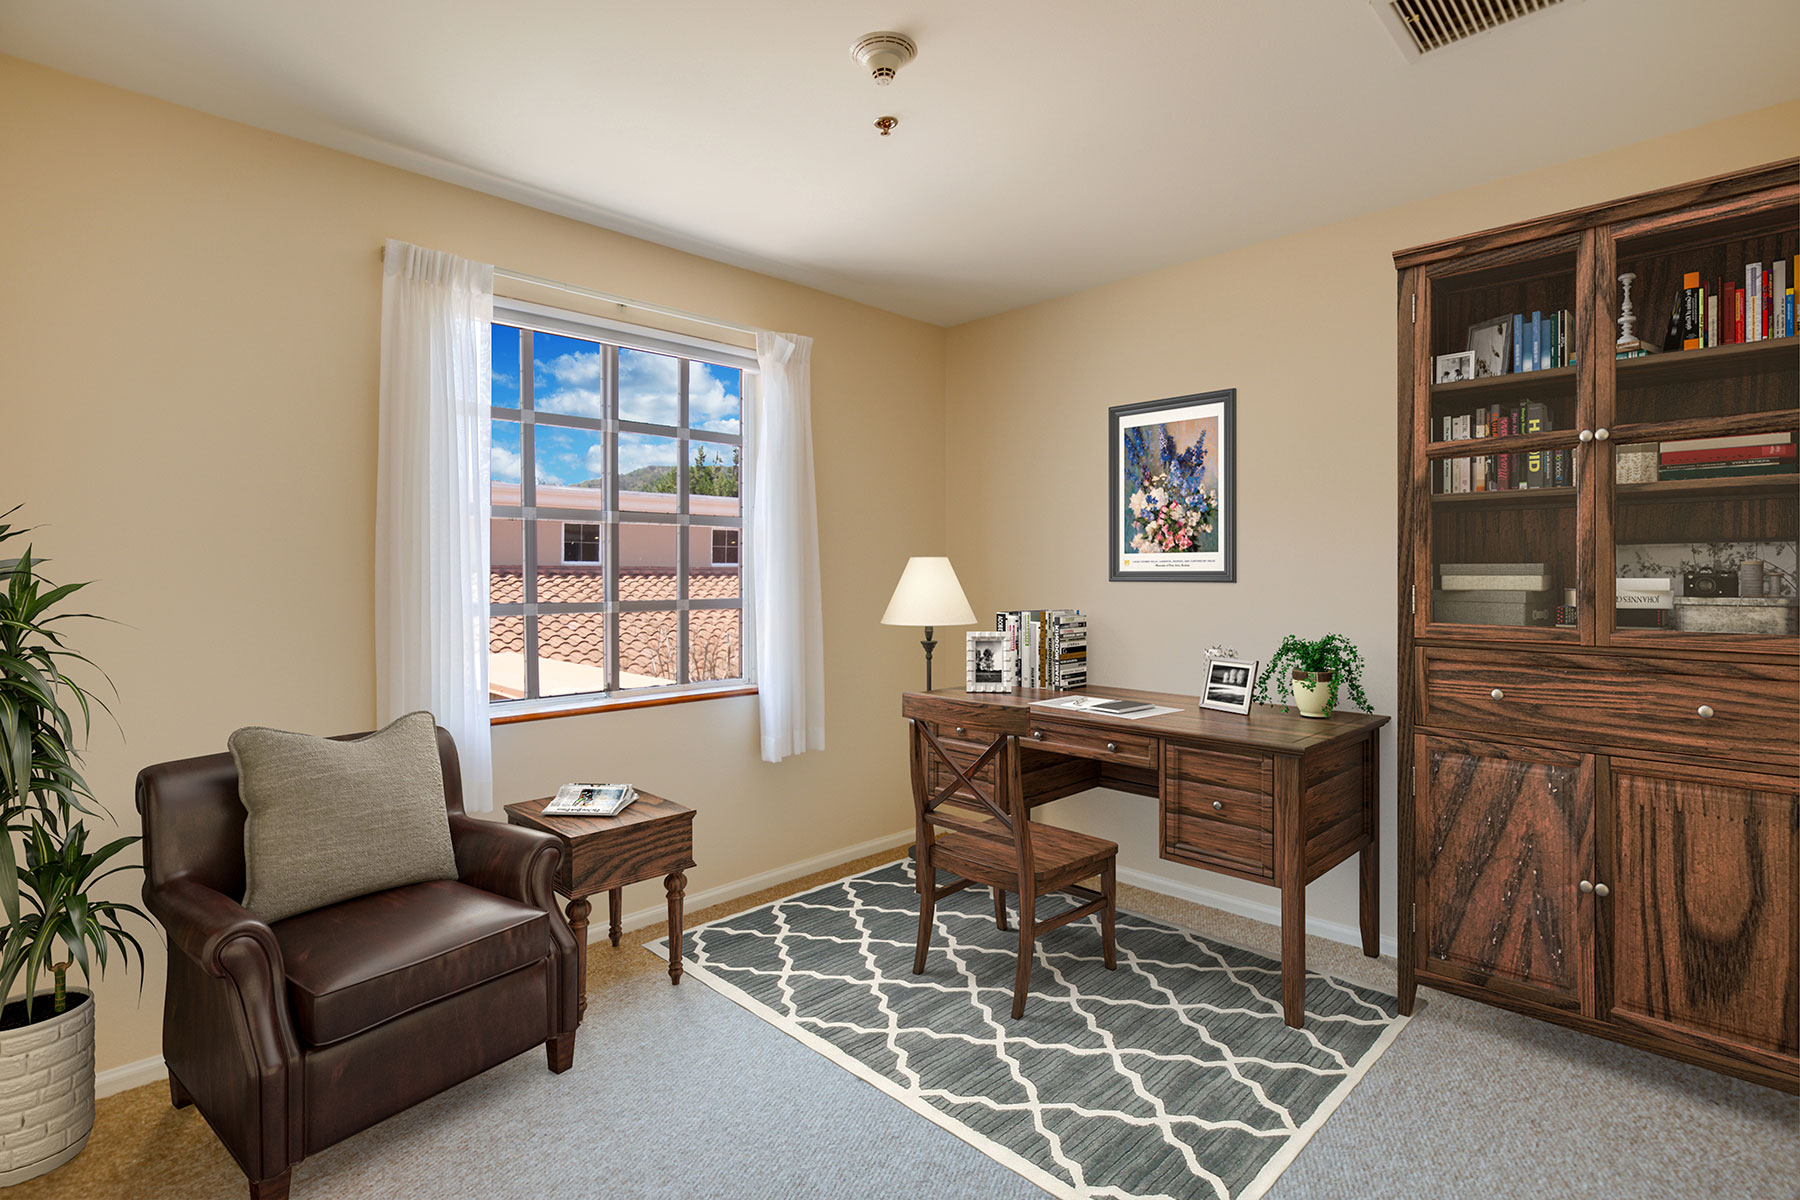
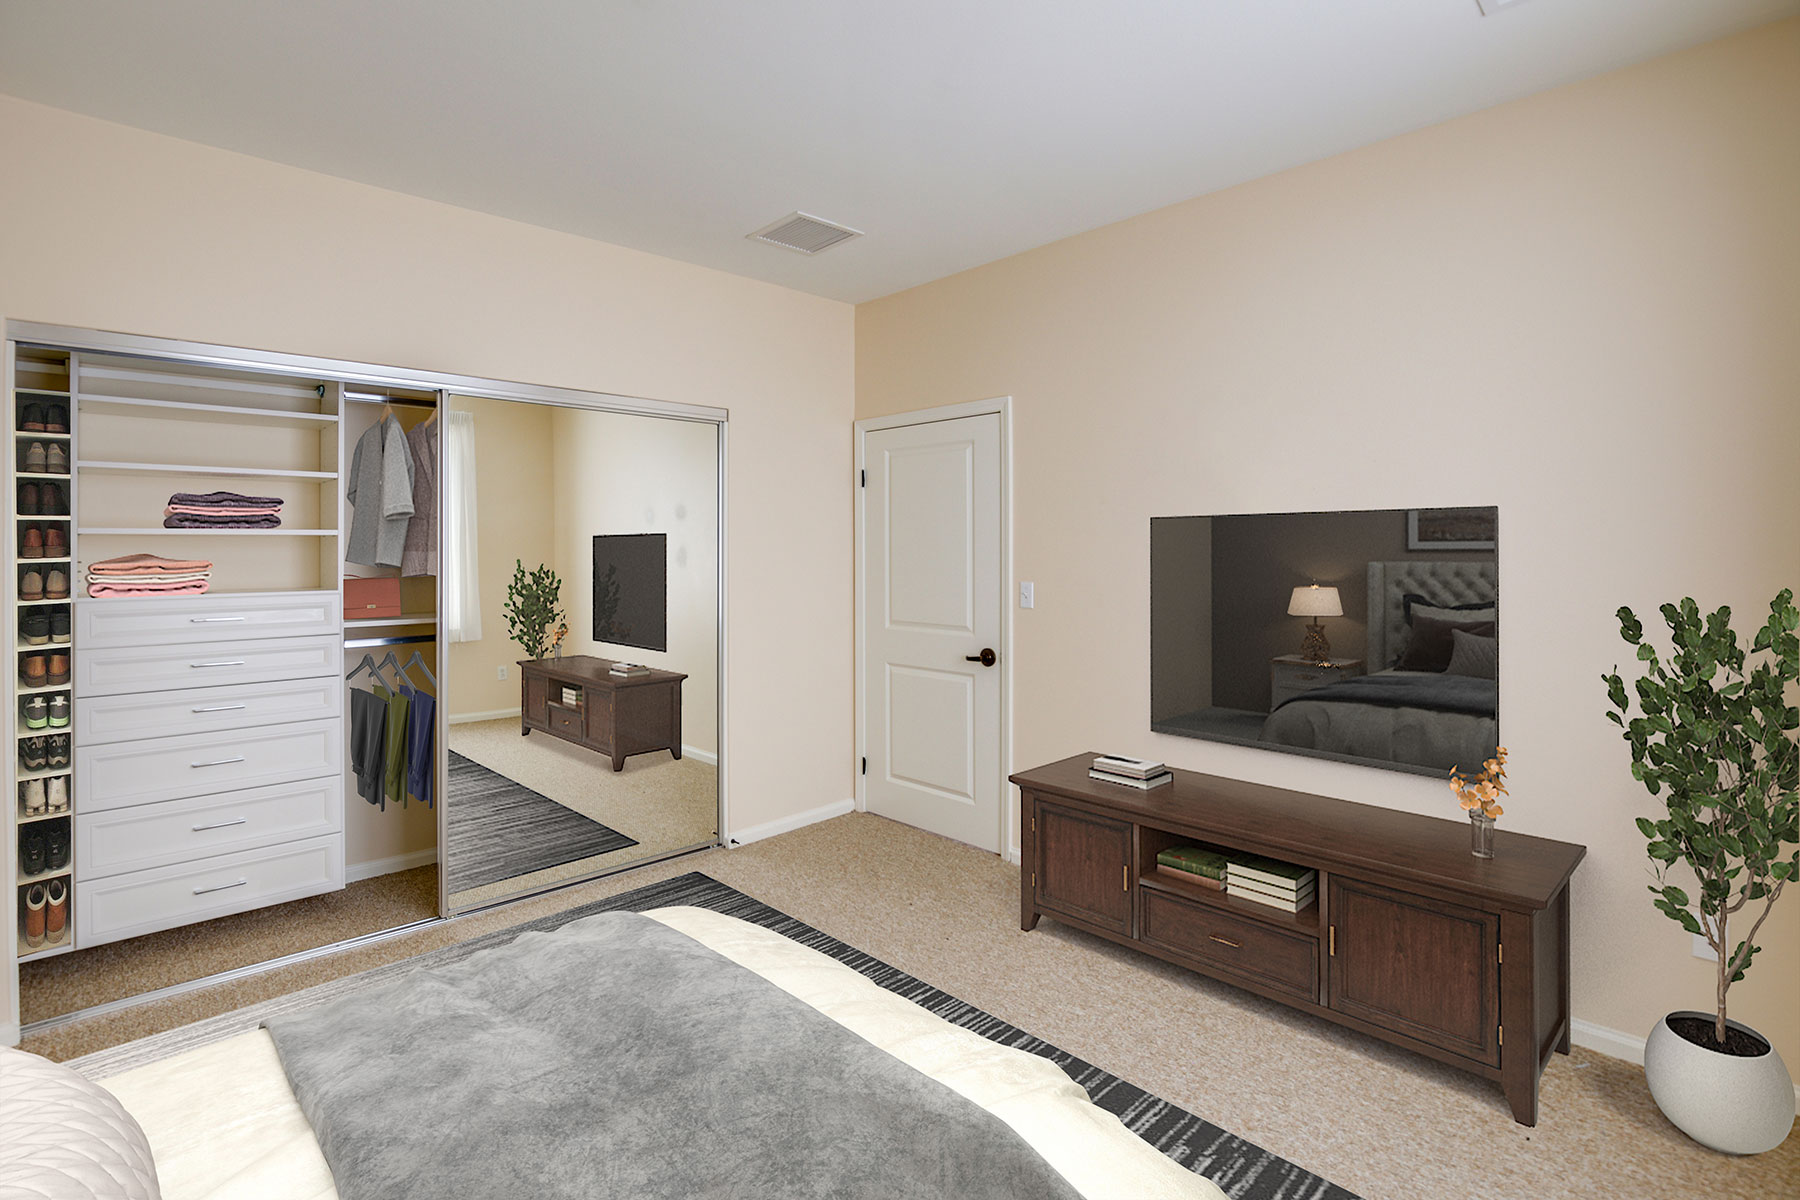
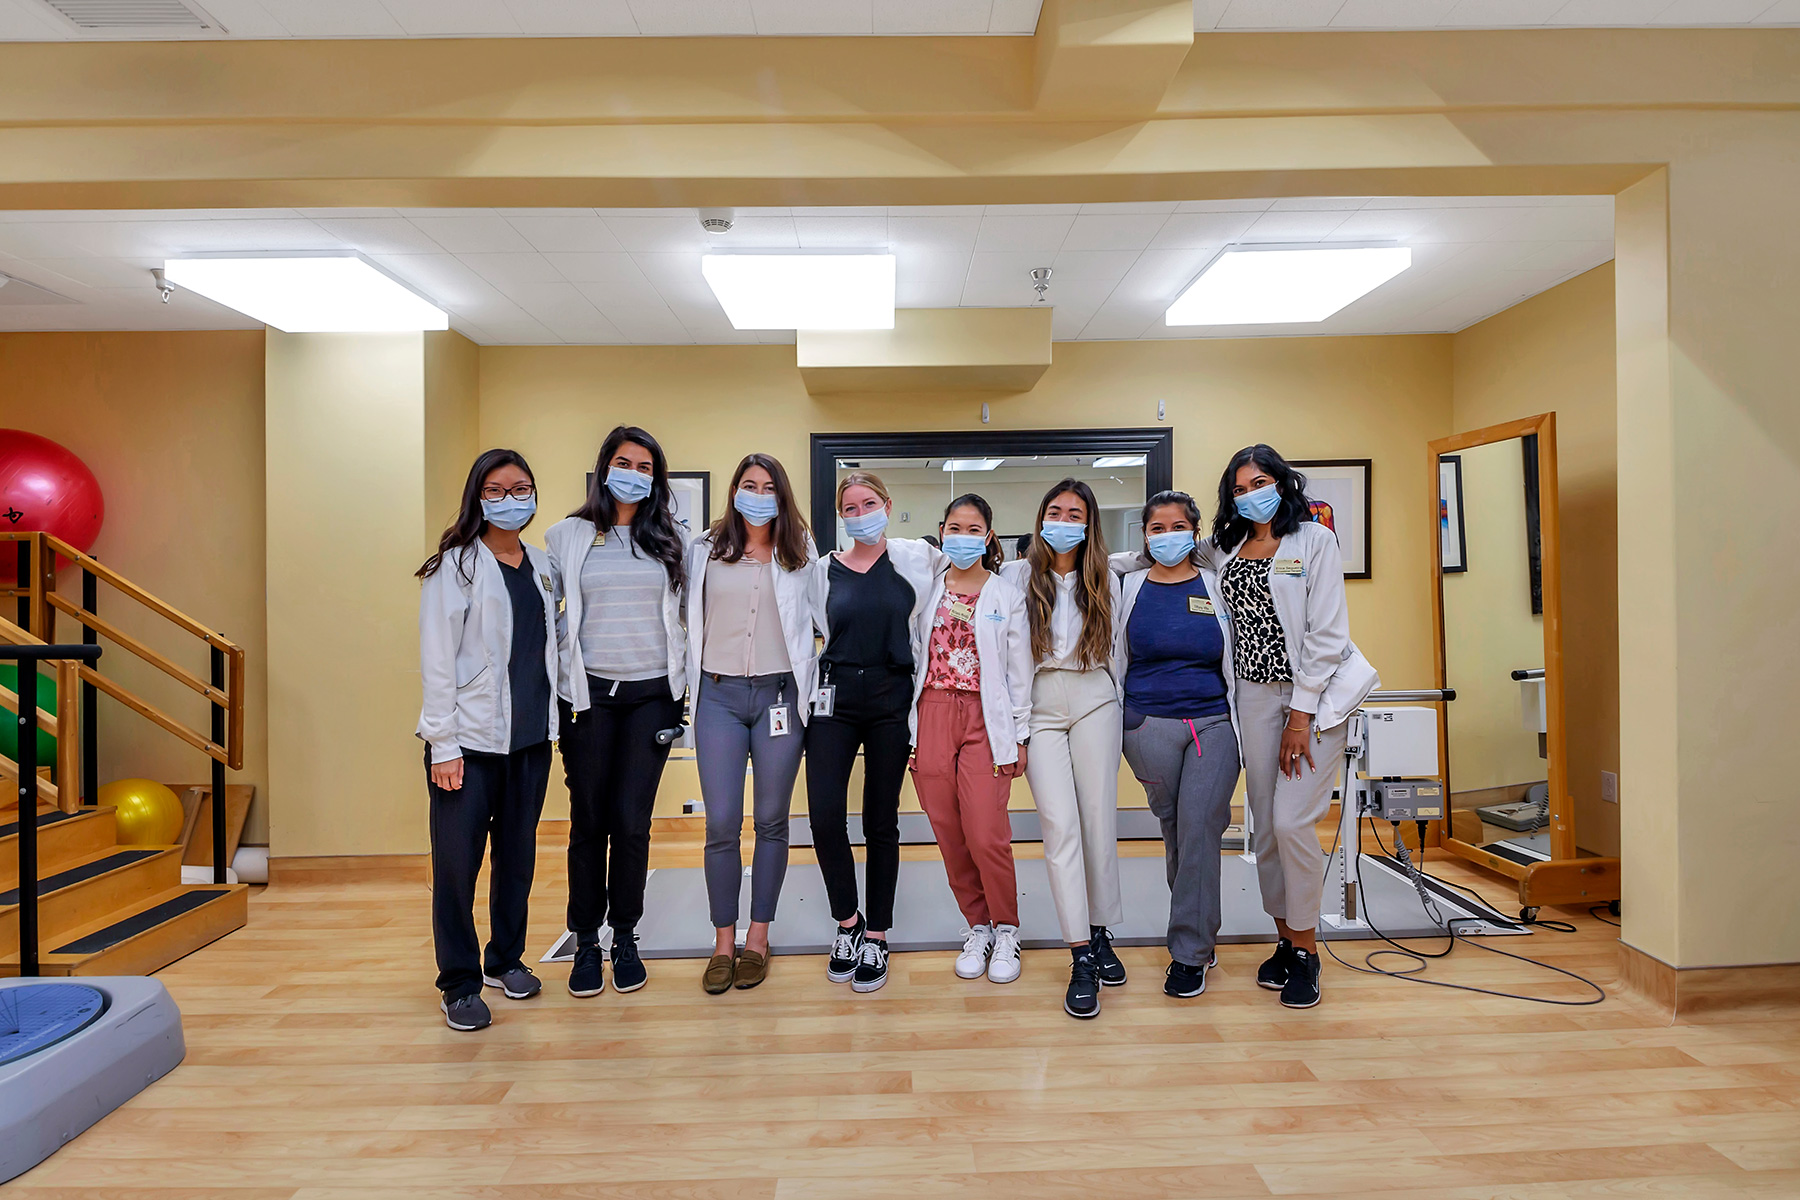
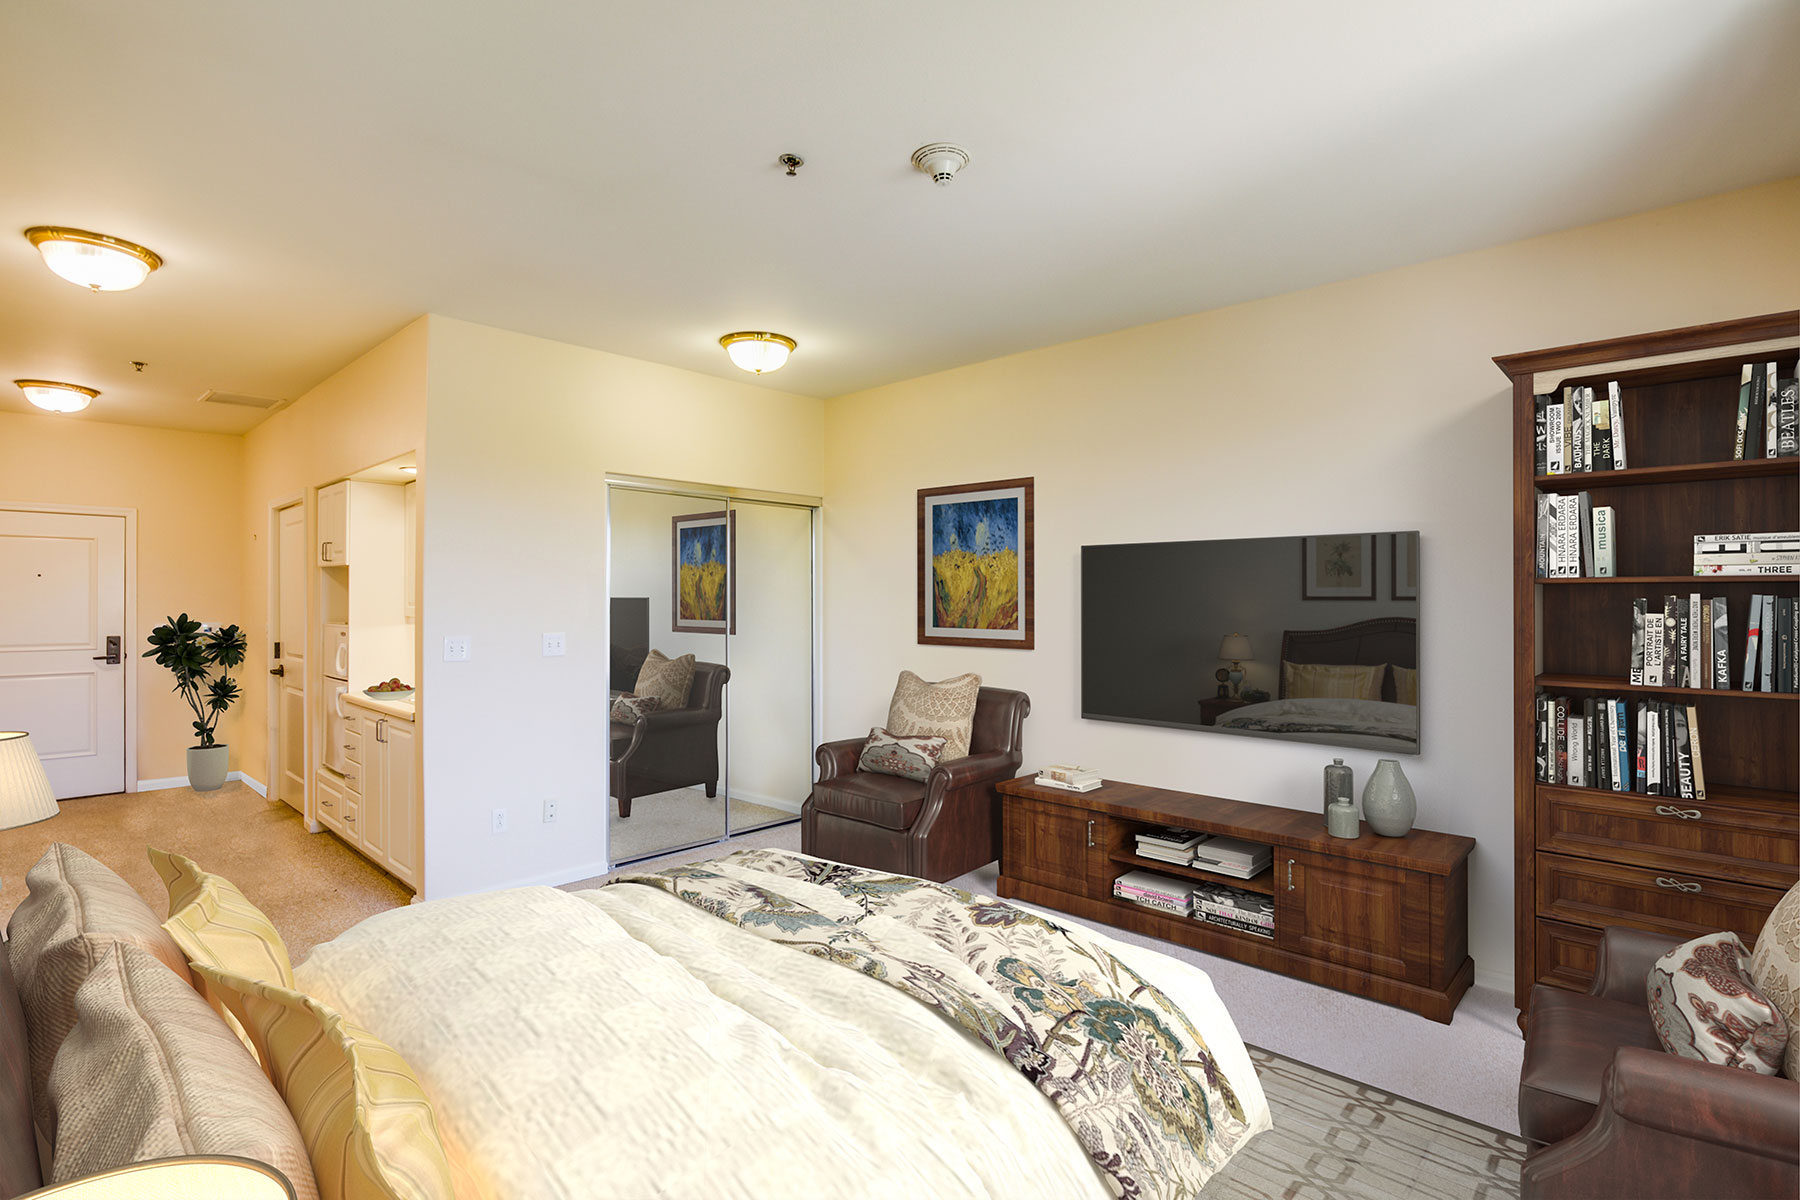
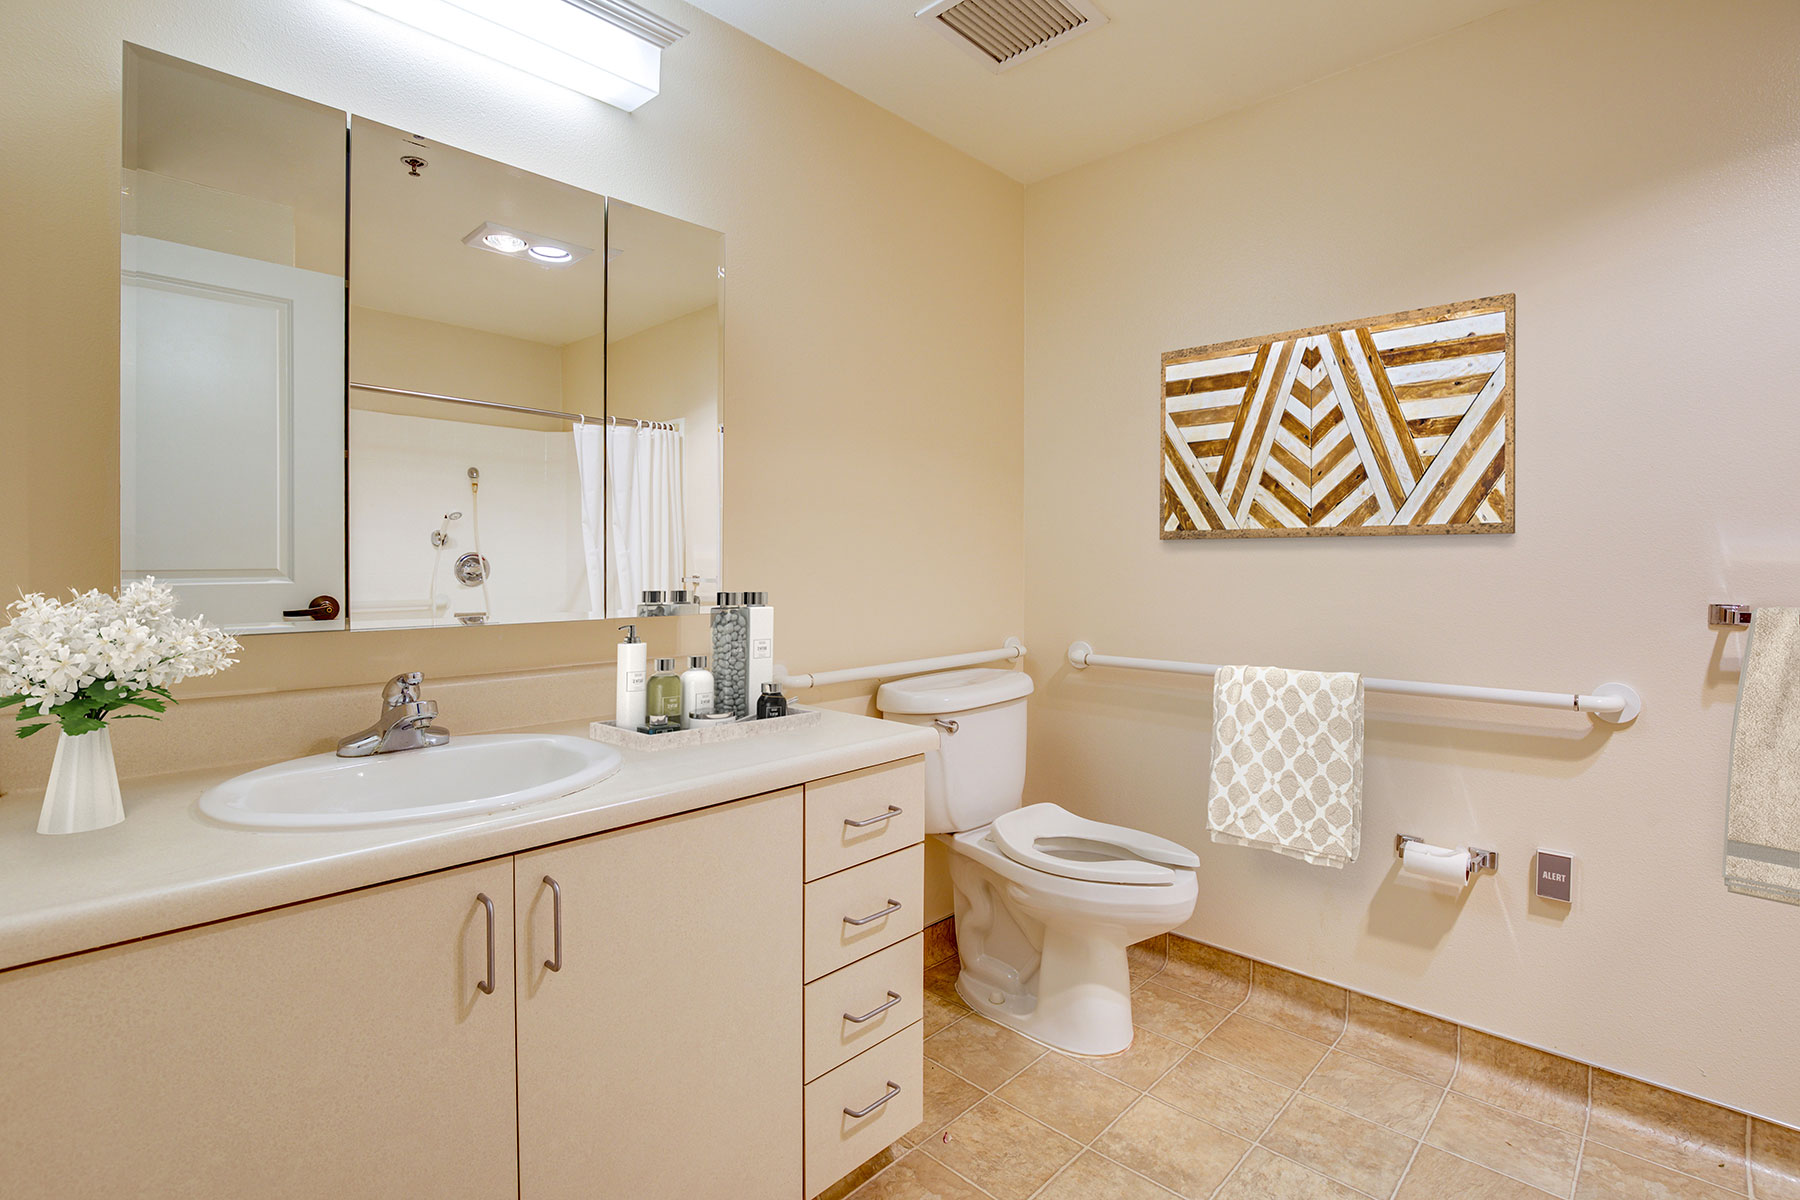
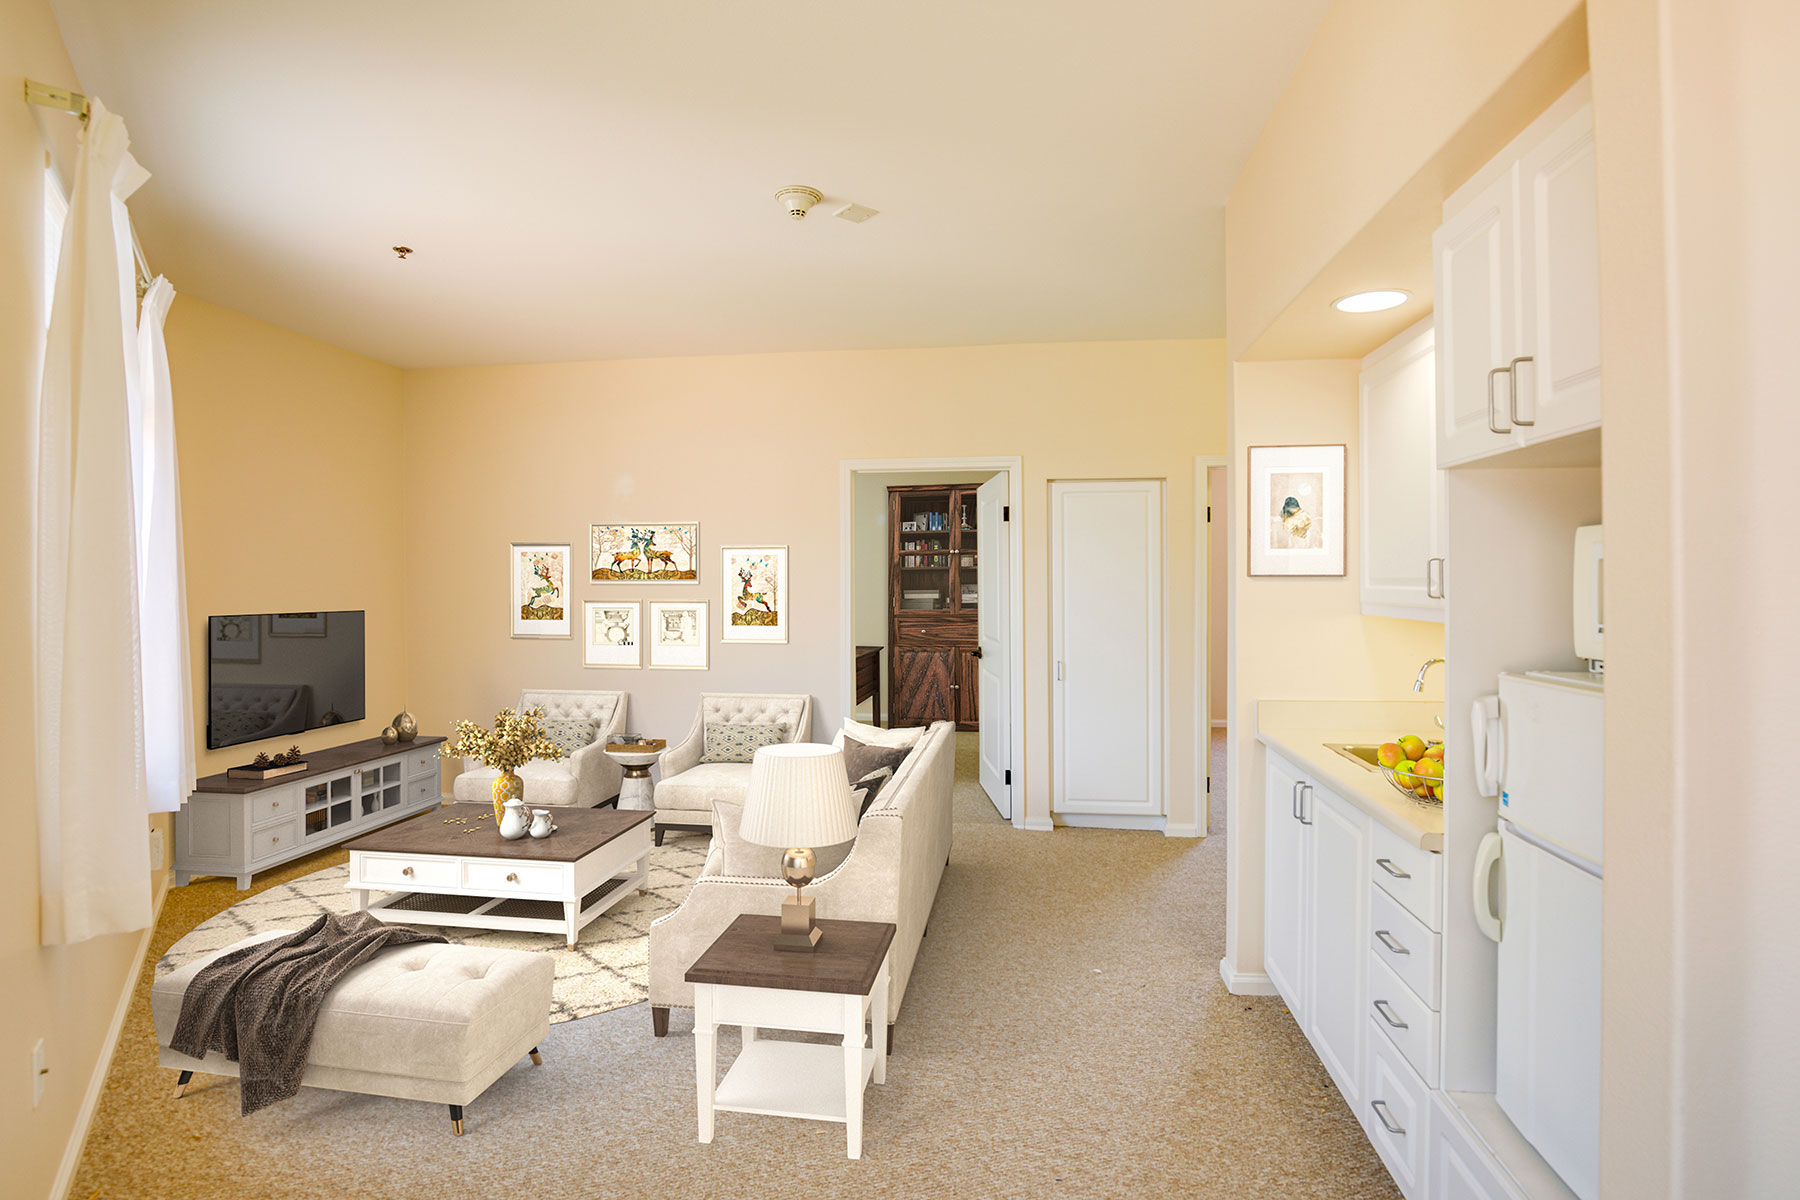
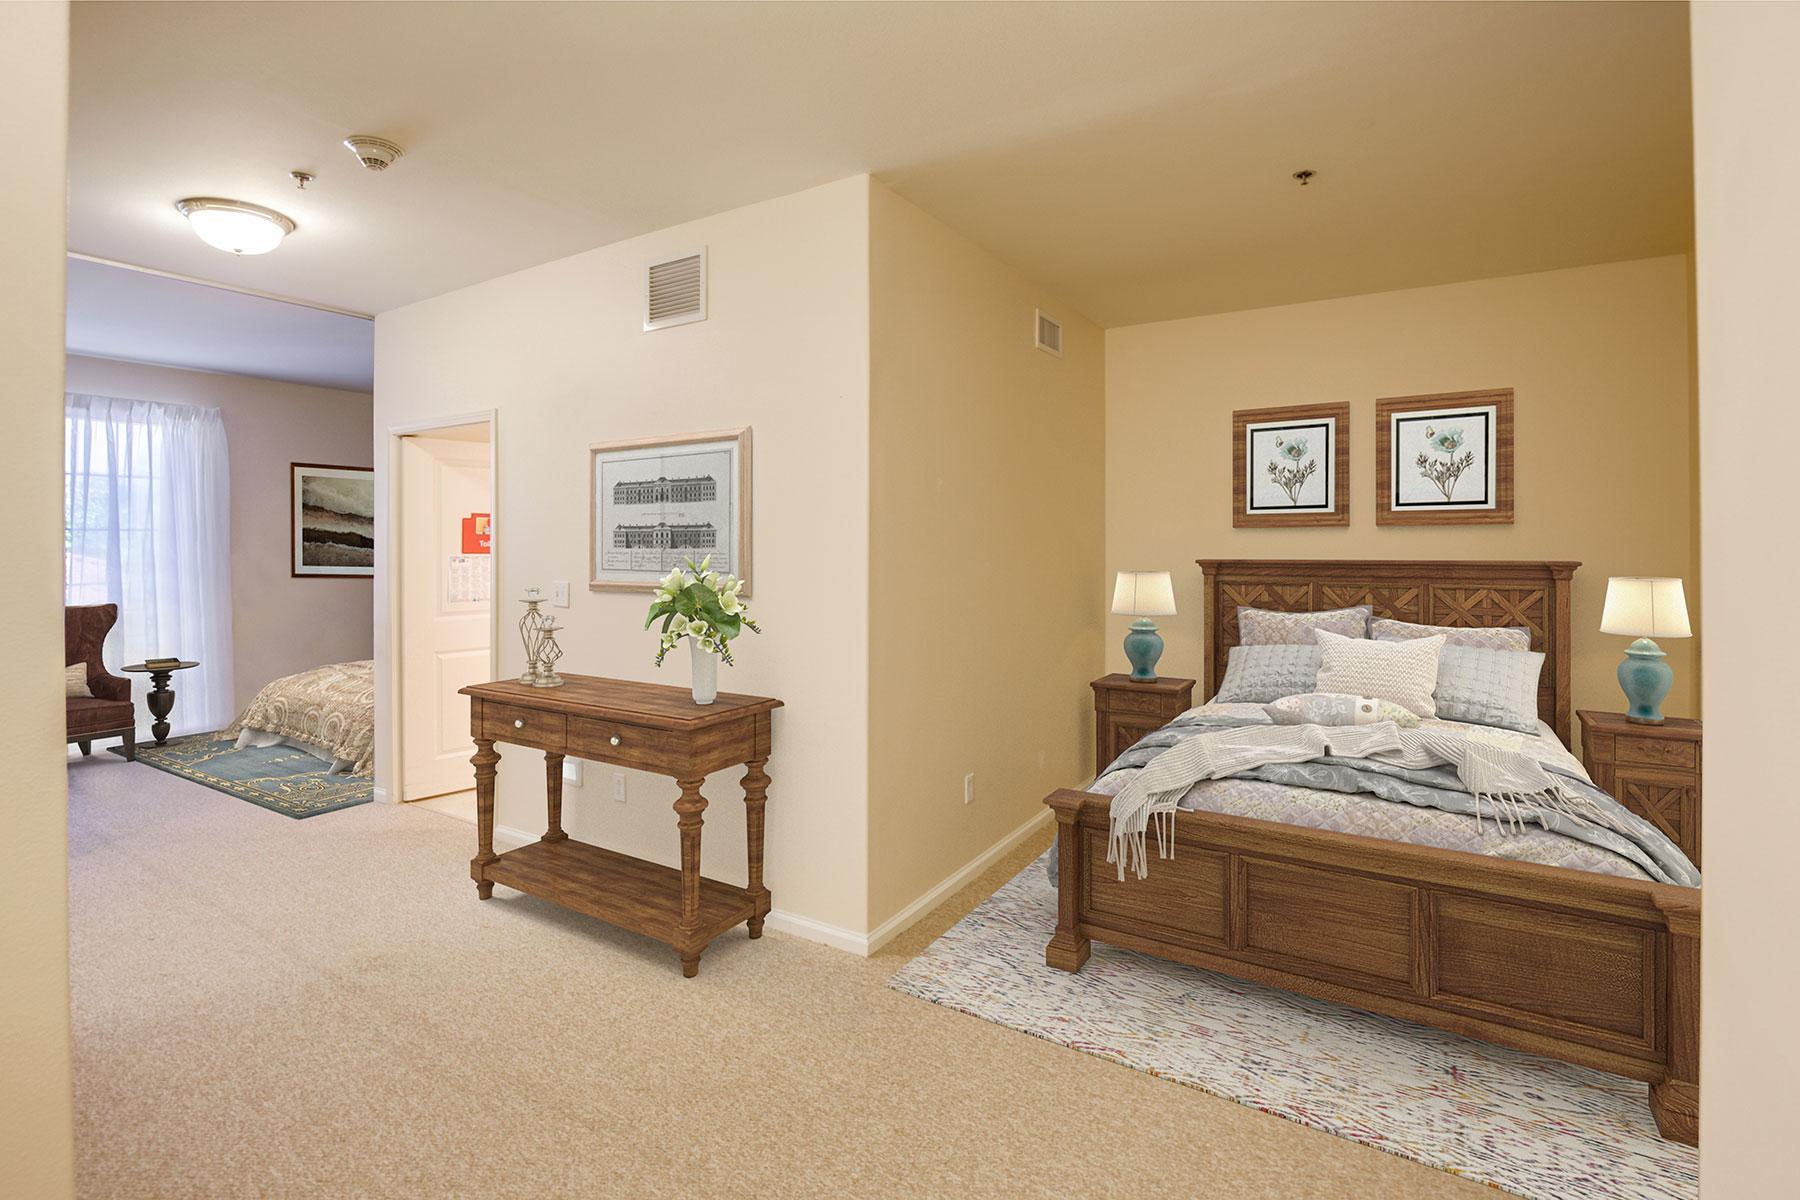
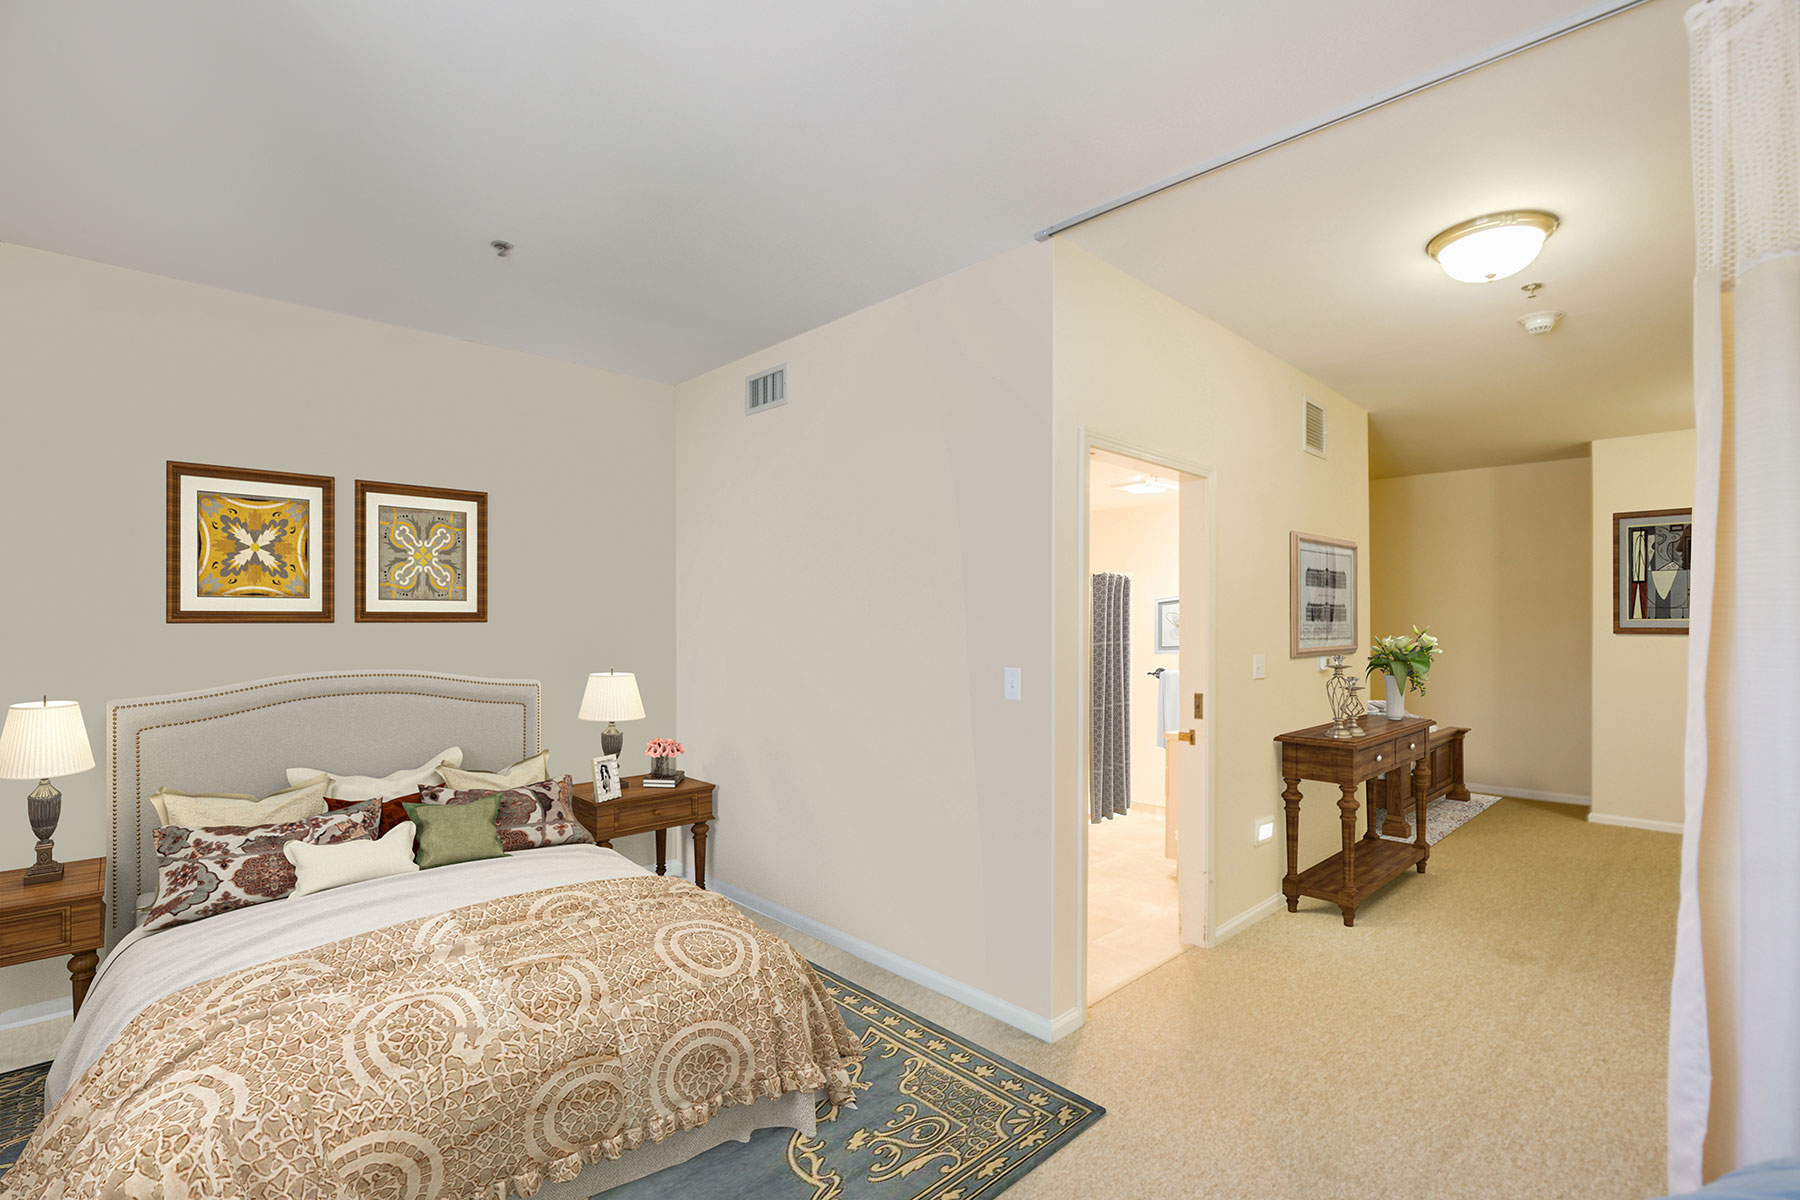
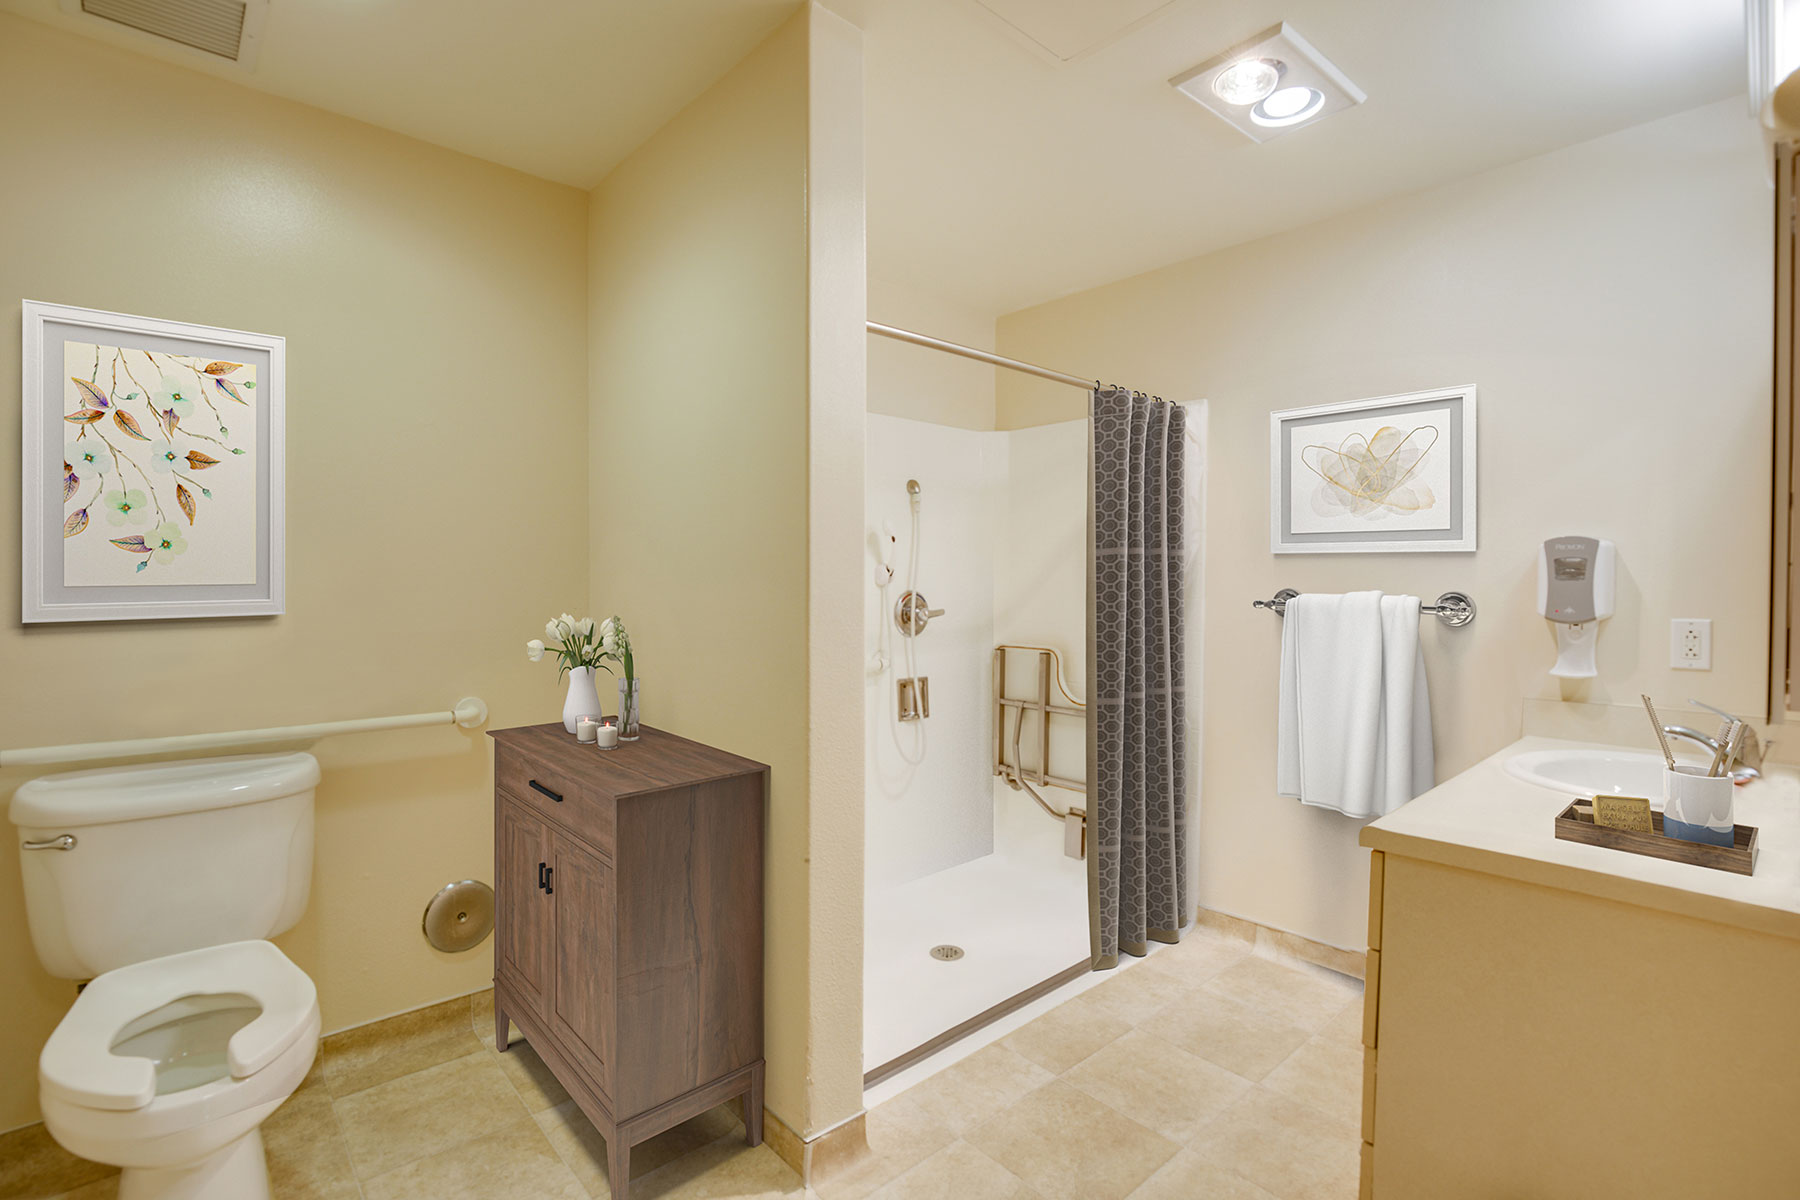
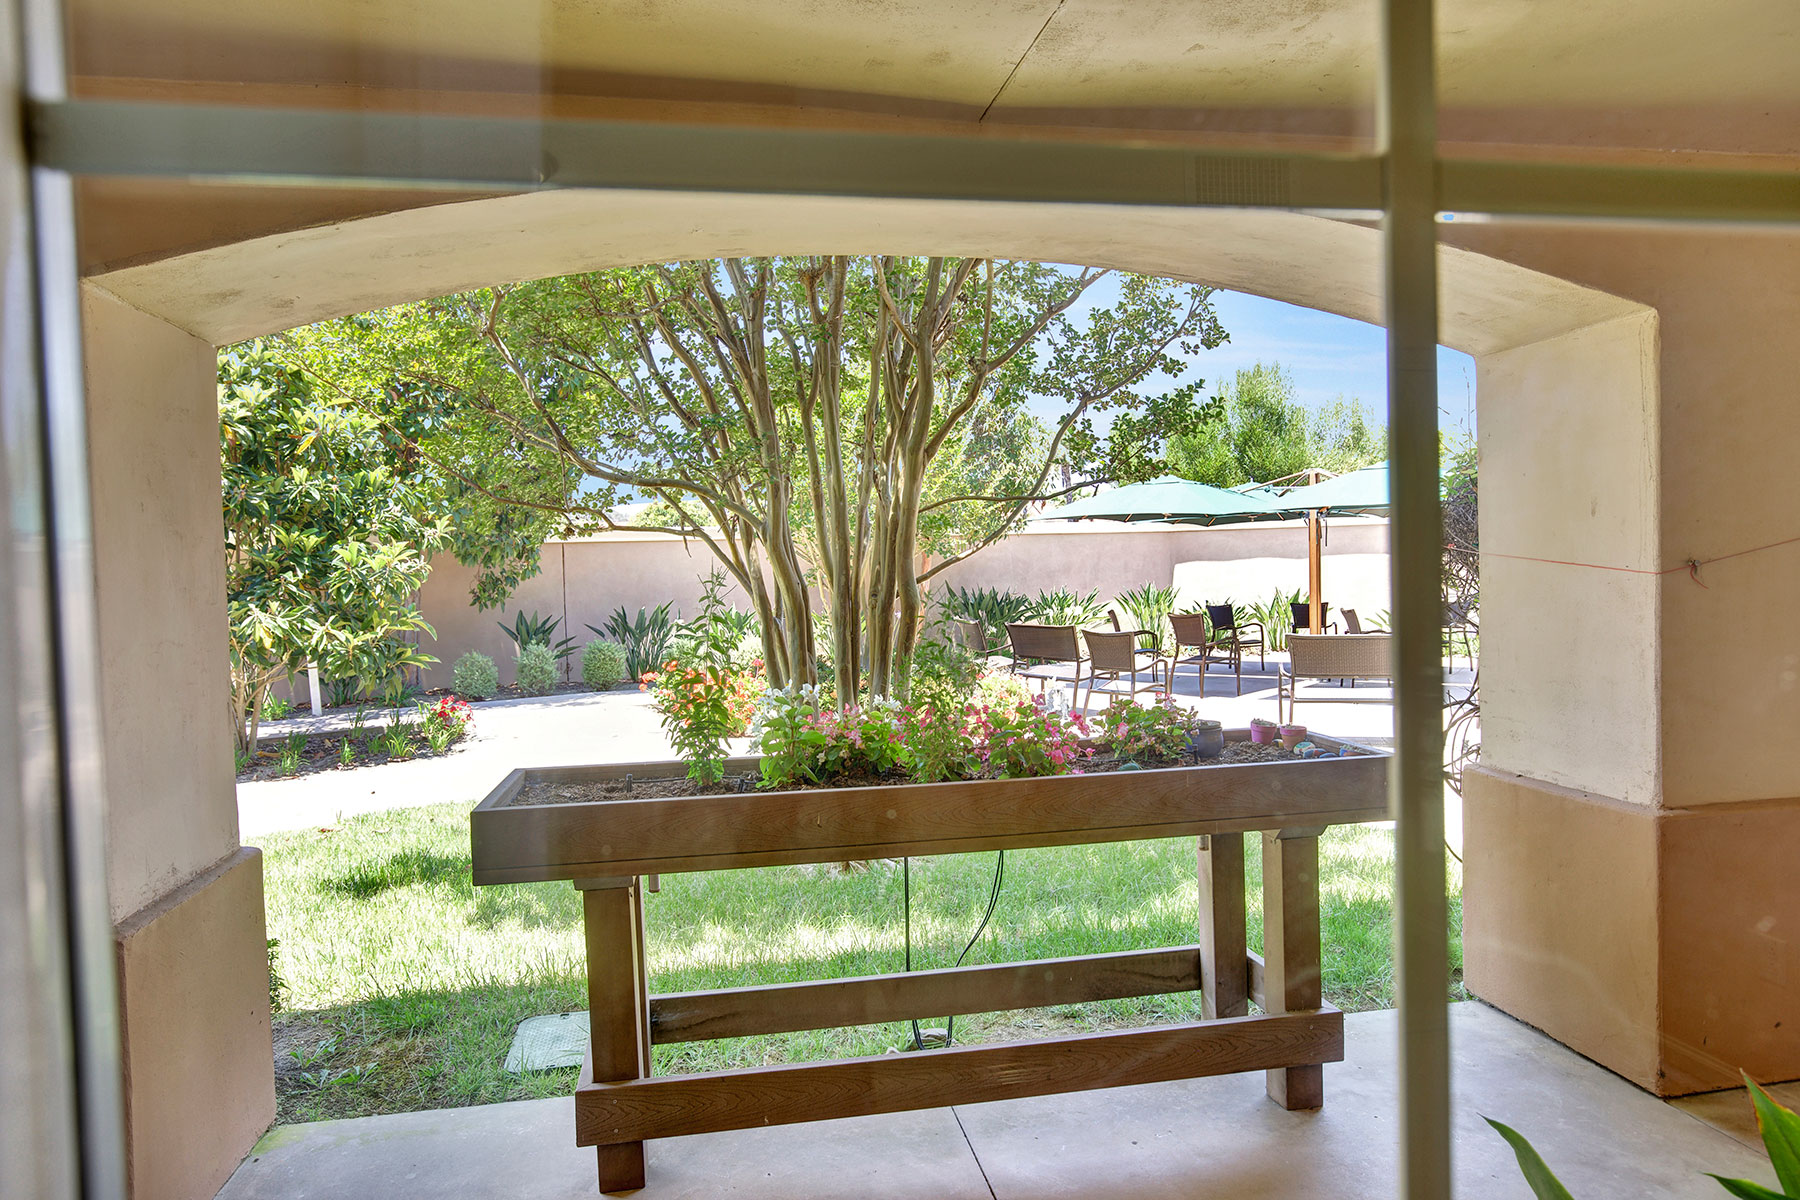
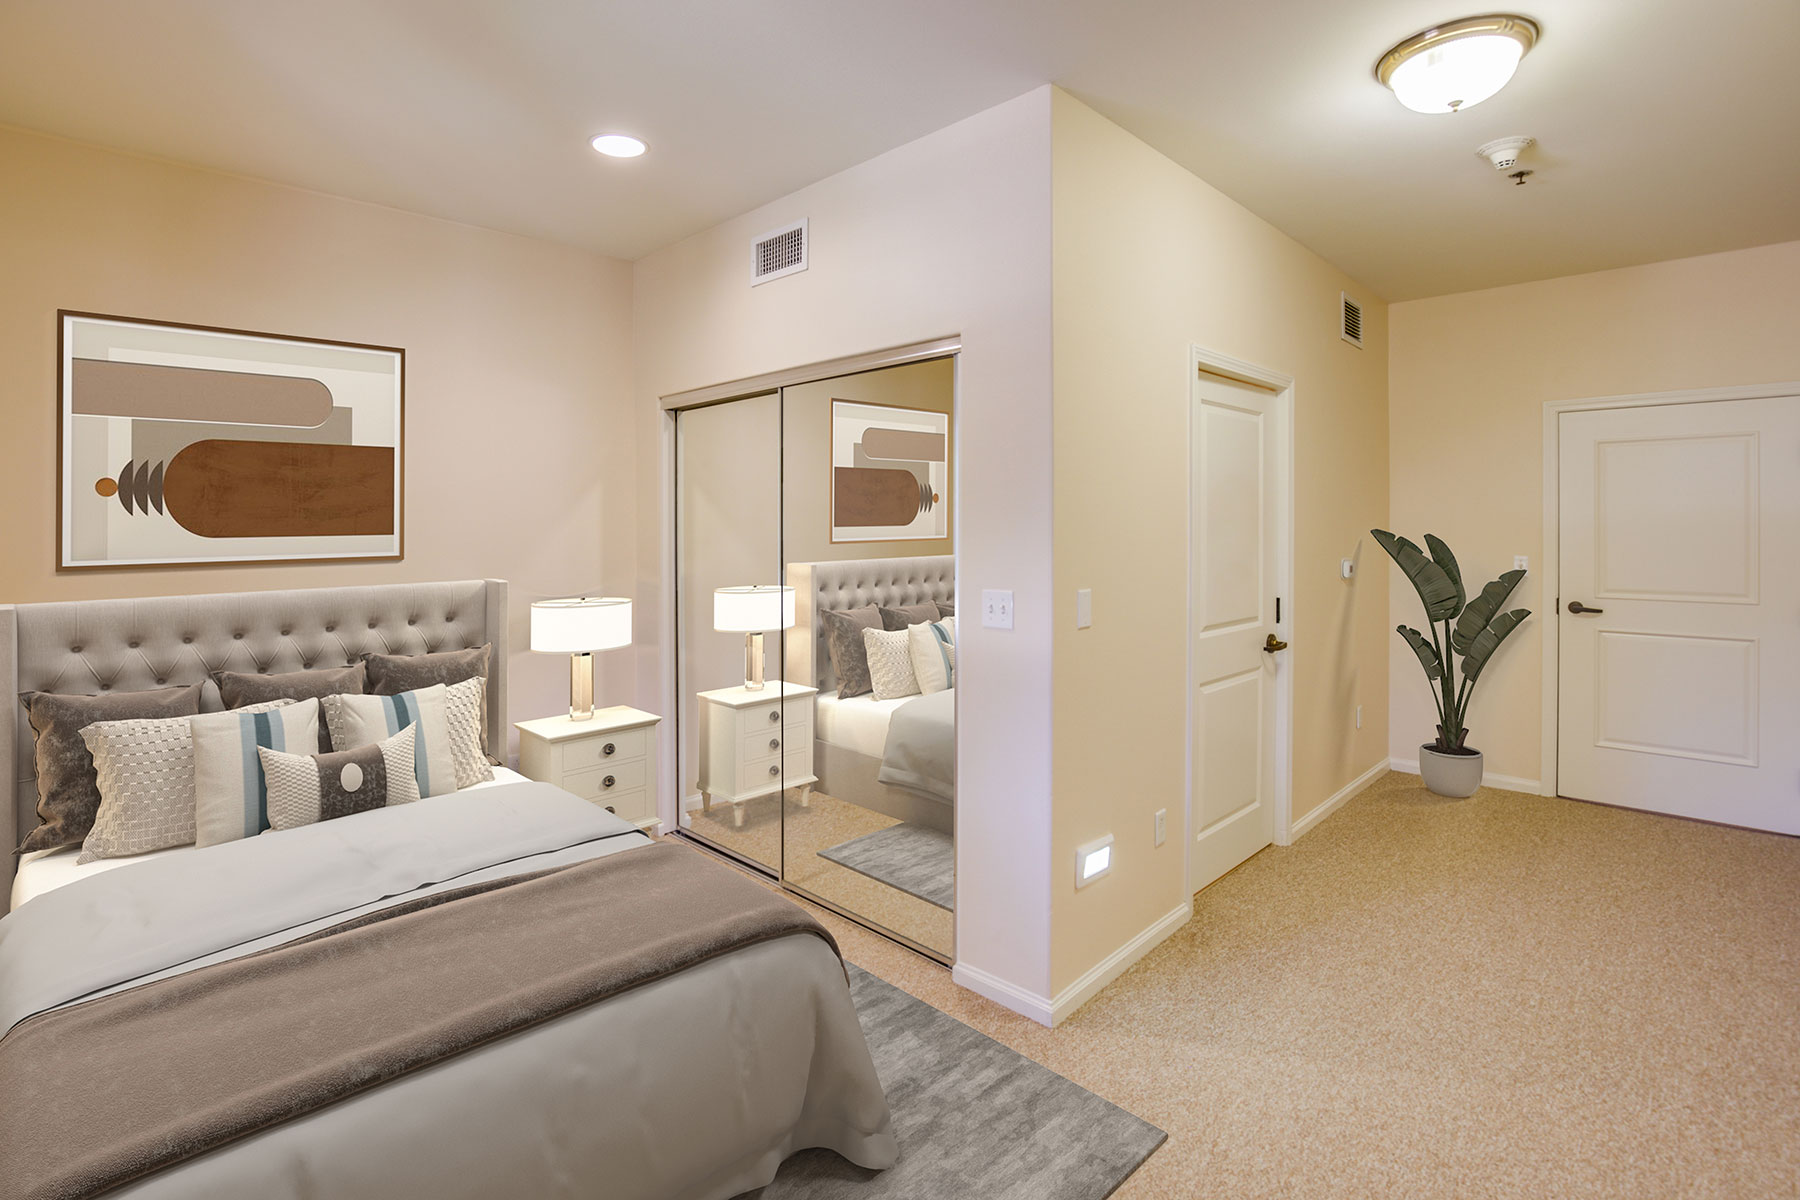
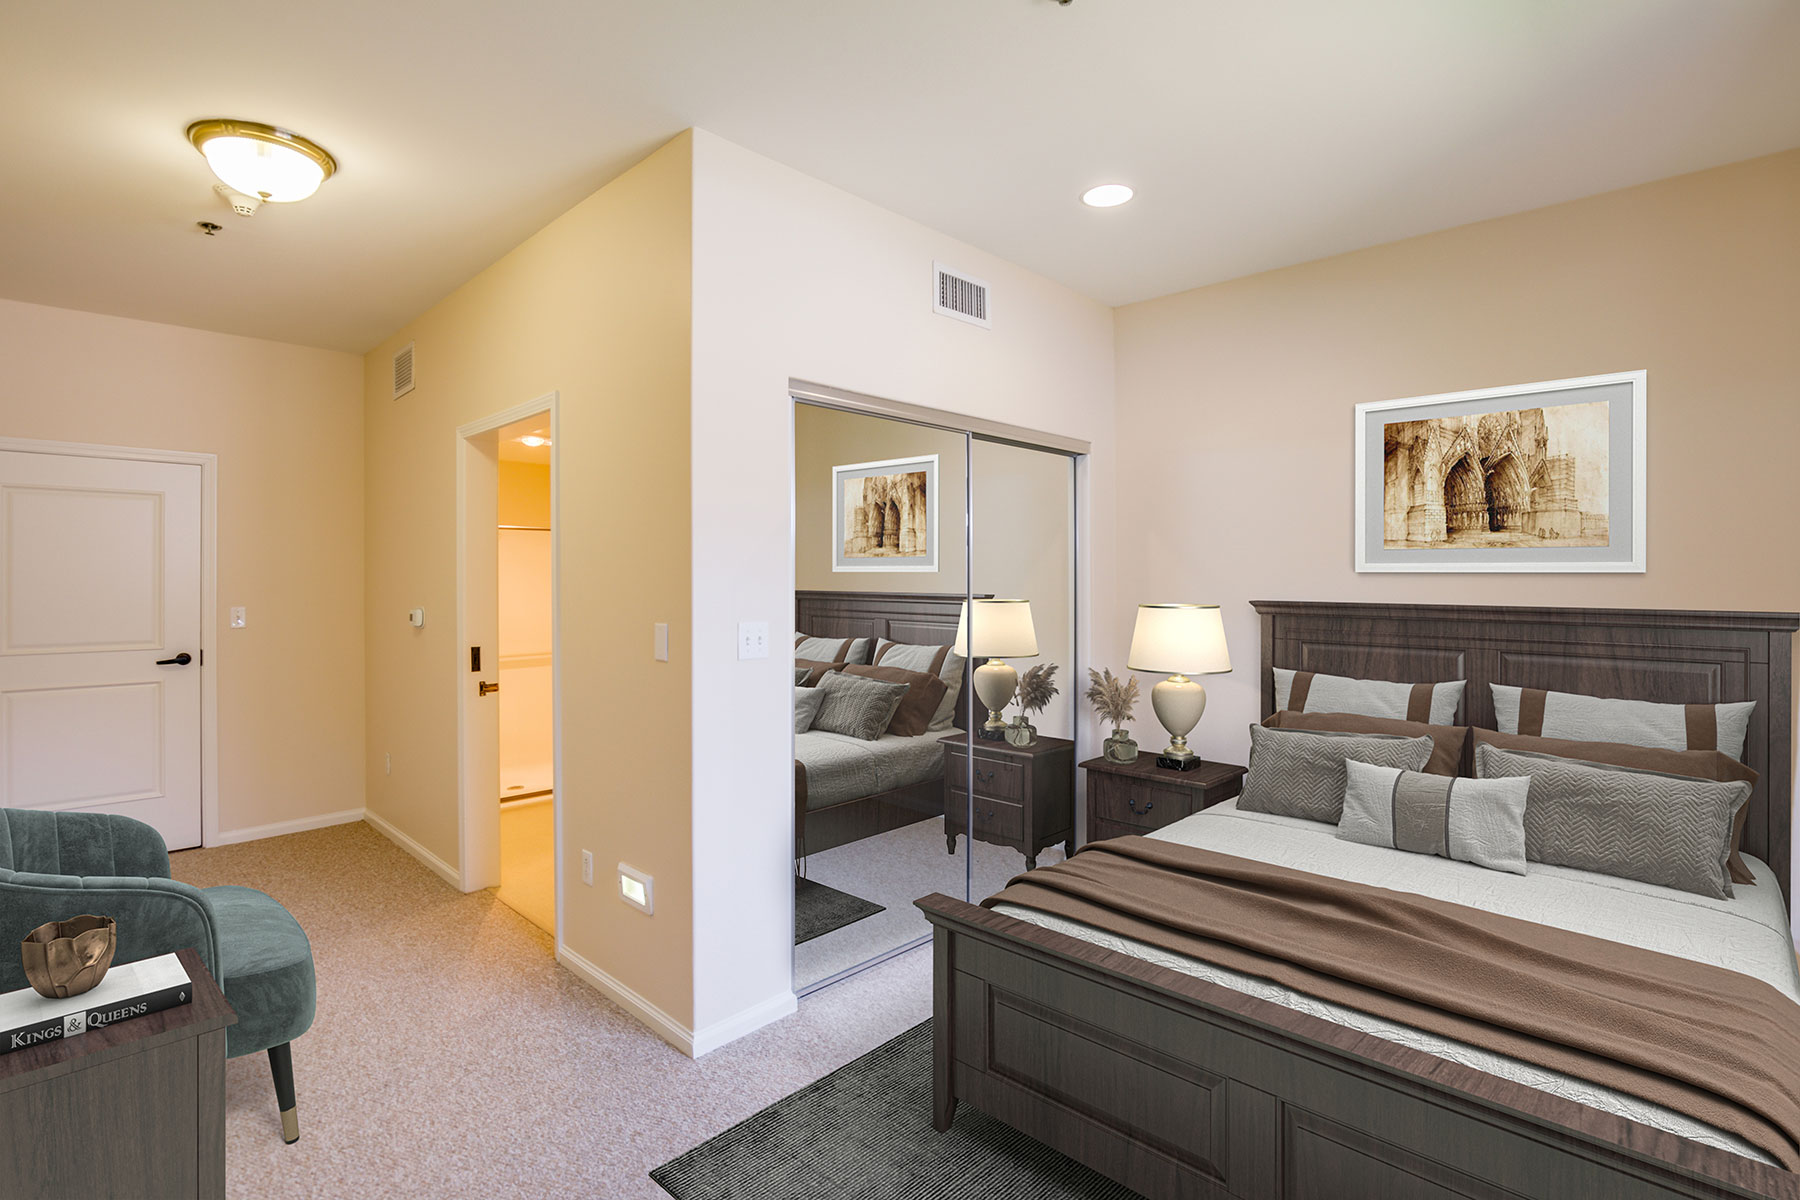
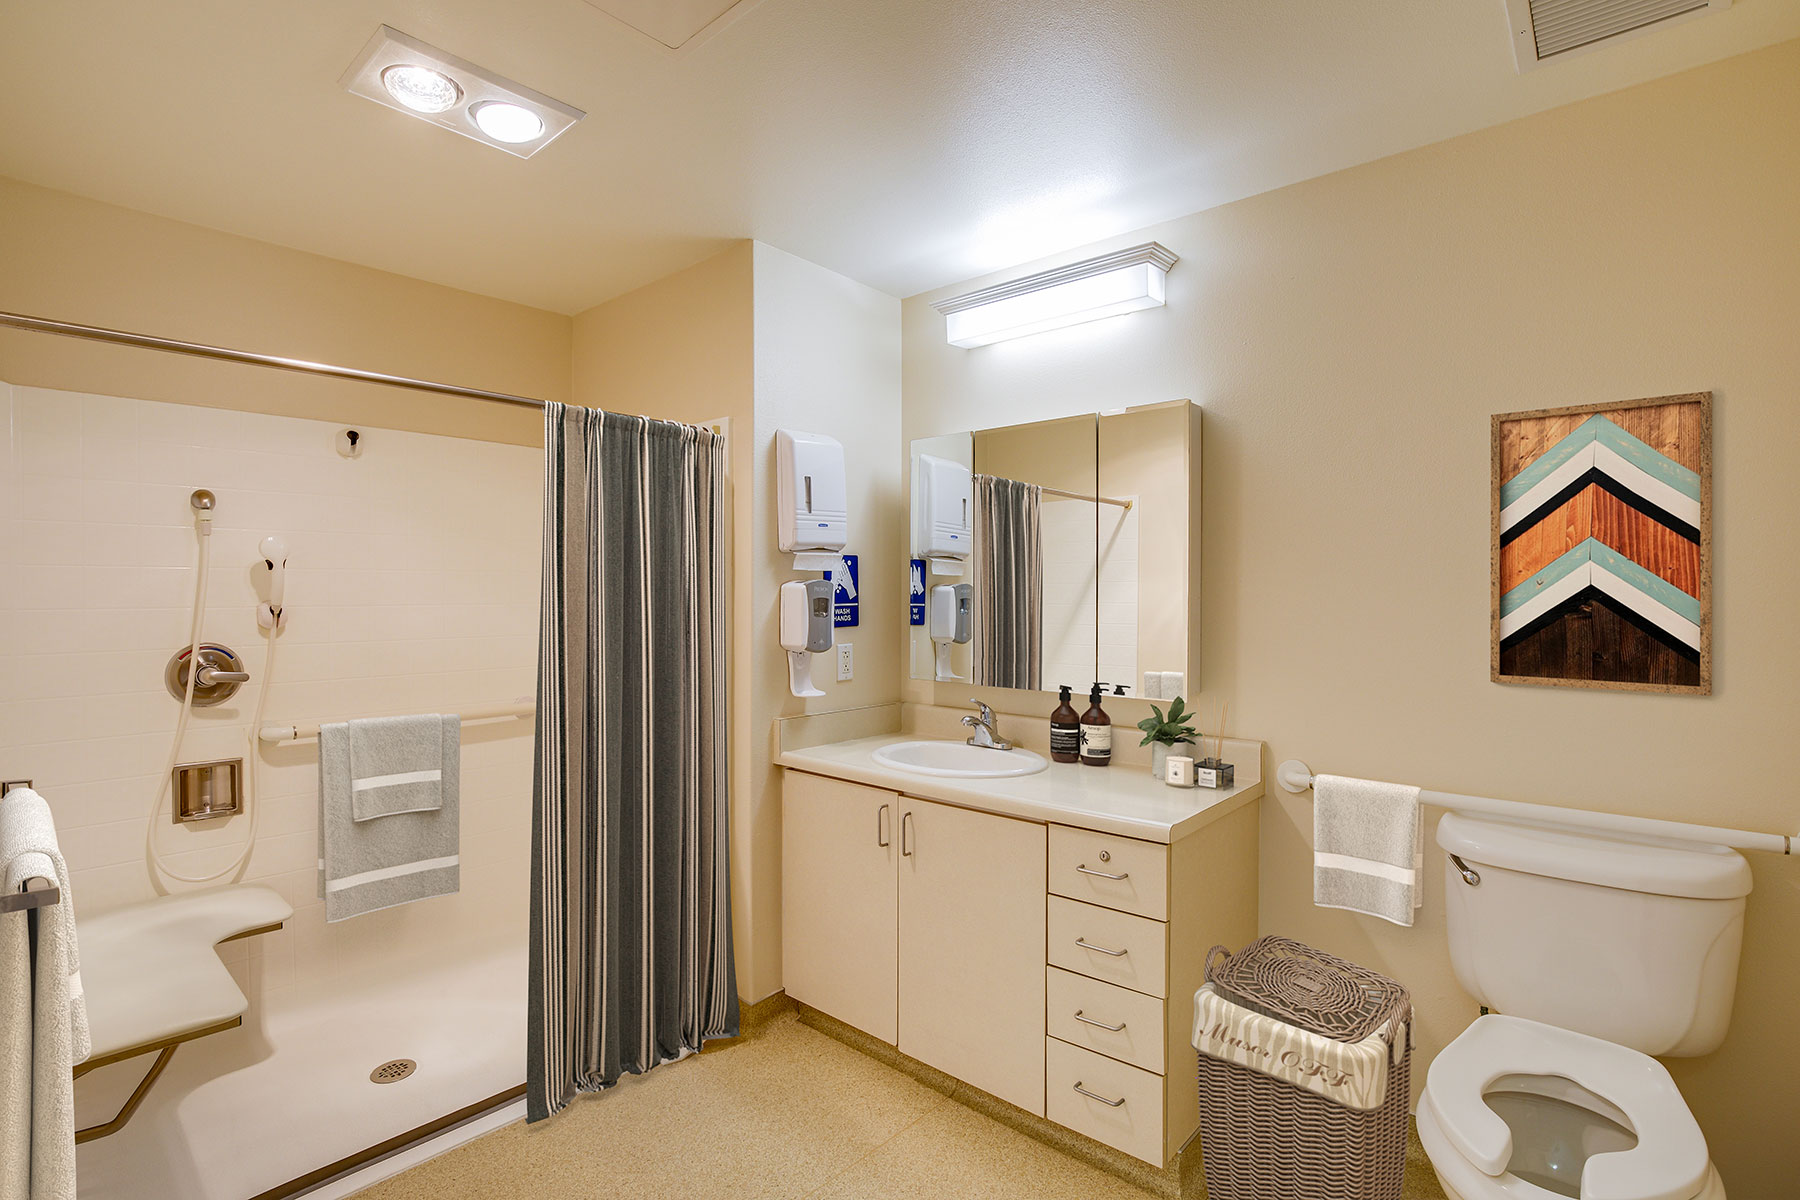
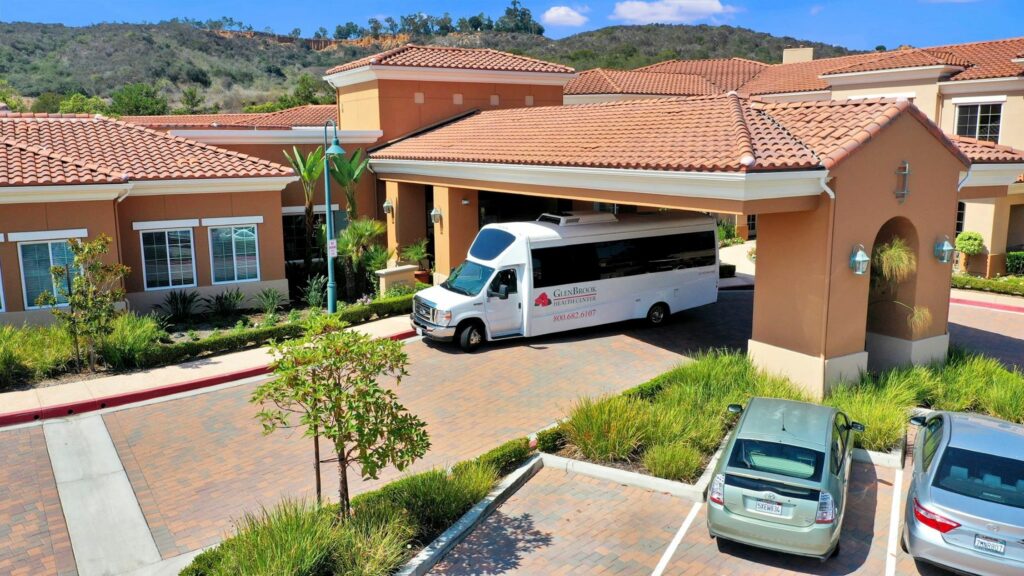
An award-winning senior living community in Calle Barcelona, Carlsbad, CA, Glenbrook Health Center offers comprehensive care services including assisted living, memory care, skilled nursing, and rehabilitation. Spend your golden years receiving the utmost care and support from a respectful and highly skilled team available around the clock. The community goes above and beyond to ensure seniors are comfortable and safe within its purposely designed amenities.

Featuring a meticulously curated life enrichment program, the community ensures residents have time to do the things they love and learn various experiences. Enjoy hassle-free dining with healthy and delicious meals that satisfy nutritional needs and tastes. Glenbrook Health Center is a haven for seniors looking for assistance to enjoy a blissful retirement.

Quality ratings

Measured by Centers for Medicare & Medicaid Services (CMS)

Overall rating Info Official CMS rating based on health inspections, staffing and quality measures.
5/5
California average: 3.1/5
Health Inspection Info Official CMS rating based on deficiencies found during state health inspections.
3/5
California average: 2.8/5
Staffing Info Official CMS rating based on nurse staffing hours per resident per day.
5/5
California average: 3.1/5
Quality Measures Info Official CMS rating based on clinical outcomes for residents.
5/5
California average: 4.1/5

Nursing care per resident

Info Average daily nursing hours per resident (adjusted for acuity). Higher values indicate more nursing time per resident.
5h 25m per day

This home provides 28% more nursing time per resident than the state average.

California average: 4h 13m per day

Staffing hours breakdown

Info Hours of care per resident per day, broken down by staff type. Data from CMS Medicare.
Staff type Facility State avg National avg
Registered Nurse (RN) Info Registered nurse hours per resident per day. 1h 3m per day 39m per day 41m per day
LPN / LVN Info Licensed Practical Nurse / Licensed Vocational Nurse hours per resident per day. 1h 7m per day 1h 13m per day 52m per day
Nurse Aide Info Nurse aide hours per resident per day. 3h 19m per day 2h 39m per day 2h 21m per day
Total Nursing (Weekend) Info Total number of nurse staff hours per resident per day on weekends. 4h 50m per day 4h 5m per day 3h 26m per day
Physical Therapist Info Physical therapist staff hours per resident per day. 8m per day 5m per day 4m per day
RN (Weekend) Info Registered nurse hours per resident per day on weekends. 40m per day 30m per day 29m per day

Capacity and availability

Smaller home

May offer a more intimate, personalized care environment.

Total beds 95

This home usually has availability

Lower occupancy suggests more openings may be available.

Lower demand than the California average
Occupancy rate 84.4%
Residents per day (avg) 56
Occupancy rate
84.4%
Residents per day (avg)
56

Who this home usually serves

TYPE OF STAY

Mostly short-term rehab stays

Most residents typically stay for a few weeks or months before returning home or moving on.

Might be optimal for
Short stays Recovery Medicare-covered care

Breakdown by payment type

Medicare

78% of new residents, usually for short-term rehab.

Typical stay 22 days

Private pay

22% of new residents, often for short stays.

Typical stay 1 years

Finances and operations

Proprietary home
Corporation
Home revenue
$25.5M
Profit
$2.4M
Proprietary home Corporation
Home revenue
$25,502,190.00
Profit
$2,449,208.00
Payroll costs Info The portion of the home's budget spent on staff, including nurses, caregivers, and other employees who support care and operations.
$9.7M
37.9% of revenue
Other operating costs Info All remaining costs needed to run the home, such as food, utilities, building maintenance, supplies and administrative expenses.
$13.4M
Total costs $23.1M
Bed community size
95-bed community
A larger shared setting that may offer more common spaces and organized community services.
Years in operation
22 years in operation
A longer operating history, which may indicate experience navigating regulations and delivering ongoing care.
Walk Score
Walk Score: 57 / 100
Moderately walkable. Some errands can be accomplished on foot, with a mix of nearby amenities.

About this community

Occupancy Rate
71%
Occupied Beds
67 of 95
Percentage of available beds currently in use by residents.
License Status
LICENSED
Facility Type
RESIDENTIAL CARE ELDERLY
License Date
January 5, 2004

Additional licensing details

License number: 300613274
County: SAN DIEGO
Awards: Best Nursing Homes 2026, Gold for Assisted Living on The Best of North County 2025

Ownership & operating entity

GlenBrook Health Center is legally operated by GLENBROOK HC LLC/LIFE SERVICES LLC.

Care Services

Nursing Services
Rehabilitation Services
Memory Care
Skilled Nursing
Licensed Nurses/CNAs
Short-Term Rehab

All Levels of Care

Assisted Living
Memory Care
Skilled Nursing
Rehabilitation

Programs & Activities

Specific Programs
Assisted Living, Memory Care, Skilled Nursing, Rehabilitation, Life Enrichment, Dining

Dining & Nutrition

Food Description
Dining experience is expected to be of five-star quality.

What does this home offer?

Accepts Medicaid icon

Accept Medicaid: Yes

Total residents icon

Total Residents: 94

Building type icon
Building type icon

Building Type: Single-story

Types of Care at GlenBrook Health Center

Nursing Home
Contact GlenBrook Health Center

Inspection History

In California, the Department of Social Services (for assisted living facilities) and the Department of Public Health (for nursing homes) conduct inspections to ensure resident safety and regulatory compliance.

10 visits

Breakdown by visit type

2 total complaint visits

8 other visits Info Other visits include regulatory visits that are not routine inspections or complaint investigations, such as administrative check-ins, follow-up reviews, or licensing-related visits.

2 complaint investigations

Investigations can have many visits.

4 official inspections

0 serious citations

A violation that poses an immediate risk to resident health or safety, or represents a substantial failure to comply with licensing requirements.

0 moderate citations

A violation that does not pose an immediate risk to resident health or safety but requires correction to remain in compliance.

Latest inspection

Date:December 6, 2024
Type:Annual Inspection

Inspection Report Summary for GlenBrook Health Center

Most inspections found no deficiencies, with the facility consistently clean, well-maintained, and compliant with safety and infection control standards. Several complaint investigations were unsubstantiated, including allegations of neglect and improper staff behavior. The most recent report from December 6, 2024, was perfect with no deficiencies cited. The facility responded effectively to incidents such as residents leaving unassisted, with no harm or safety issues identified. Overall, the record shows a stable environment with no enforcement actions or fines listed in the available reports.

Compare Nursing Homes around Carlsbad

The information below is reported by the California Department of Social Services and Department of Public Health.
GlenBrook Health Center
AL

Assisted Living For seniors needing help with daily tasks but not full-time nursing.

IL

Independent Living For self-sufficient seniors seeking community and minimal assistance.

MC

Memory Care Specialized care for those with Memory Loss, Alzheimer's, or dementia, ensuring safety and support.

SNF

Nursing Homes 24/7 care needed

Carlsbad
155
No
57
ELWOOD JUSTIN WILSON, III AND JULIE FRANCES WILSON, TRUSTEE OF THE J.
70.5%
$24,840,866.00
$9,658,998.00
38.9%
56.10
5/5
5.4231
3/5
5/5
5/5
1
26
1
+38%
+28%
-17%

Places of interest near GlenBrook Health Center

Address 9.7 miles from city center

Address 1950 Calle Barcelona, Carlsbad, CA 92009

Calculate Travel Distance to GlenBrook Health Center

Add your location

Address

Staffing Data

Source: CMS Payroll-Based Journal (Q2 2025)

119
Total Staff
93
Employees
26
Contractors
35,421
Total Hours (Quarter)
52
Avg Staff/Day
7.5
Avg Shift (hrs)
Nursing Staff Breakdown
Role Count Avg Shift (hrs) Uses Contractors?
Registered Nurse147.6 No
Licensed Practical Nurse148.3 No
Certified Nursing Assistant517.6 No
Staff by Category
Administration
2 staff
6.7hs shift avg
Nursing Staff
80 staff
7.8hs shift avg
Physicians & Practitioners
4 staff
7.9hs shift avg
Therapy Services
22 staff
5.7hs shift avg
Activities & Recreation
0 staff
0hs shift avg
Social Services
3 staff
3.4hs shift avg
Dietary Services
7 staff
8hs shift avg
Other Services
1 staff
8hs shift avg
Contractor Analysis
10.9%
of total hours from contractors
3,855 contractor hours this quarter
Respiratory Therapy Technician: 8 Speech Language Pathologist: 4 Physical Therapy Aide: 2 Qualified Social Worker: 3 Physical Therapy Assistant: 6 Medical Director: 1 Occupational Therapy Aide: 1 Occupational Therapy Assistant: 1
Role Employees Contractors Total Staff Total Hours Days Worked % of Days Avg Shift (hrs)
Certified Nursing Assistant5105116,49791100%7.6
Licensed Practical Nurse140145,19991100%8.3
Registered Nurse140145,09291100%7.6
Other Dietary Services Staff6062,2369099%8
Physical Therapy Assistant0661,2598998%5.9
Respiratory Therapy Technician0881,1937987%6.2
Speech Language Pathologist0448158492%5.5
Nurse Practitioner2025606571%7.8
Mental Health Service Worker1014786066%8
Administrator1014645864%8
Dietitian1014445662%7.9
RN Director of Nursing1013604549%8
Clinical Nurse Specialist2022372932%8.2
Qualified Social Worker0332266470%3.4
Physical Therapy Aide0221614651%3.4
Occupational Therapy Aide0111362730%5
Occupational Therapy Assistant0114378%6.1
Medical Director011231516%1.6

Health Inspection History

Inspections
Total health inspections 5

California average 12.5


Last Health inspection on Sep 2025

Total health citations 26
Citations per inspection
5.2

Health citations are formal notices following inspections when they fail to comply with safety and care standards.

23 of 26 citations resulted from standard inspections; 2 of 26 resulted from complaint investigations; and 1 of 26 came from combined inspections (standard and complaint).

Breakdown of citation severity (last 3 years)
Critical Health citations More info 0
100% better than California average

California average: 0.4


Serious Health citations More info 1
In line with California average

California average: 1

0 critical citations More info California average: 0.4

1 serious citation More info California average: 1

25 moderate citations More info California average: 47.2

0 minor citations More info California average: 1.5
Citations history (last 3 years)
Abuse/Neglect moderate citation Sep 19, 2025
Corrected

Quality of Care moderate citation Sep 19, 2025
Corrected

Resident Rights moderate citation Sep 19, 2025
Corrected

Resident Rights moderate citation Sep 19, 2025
Corrected

Facility Characteristics

Source: CMS Long-Term Care Facility Characteristics (Data as of Jan 2026)

Ownership: For-Profit LLC
Resident Census by Payment Source
58 Total Residents
Medicare 21 (36.2%)
Private Pay/Other 37 (63.8%)
Programs & Services
Residents' Group
Family Member Group
CCRC
Family Engagement

Active councils help families stay involved in care decisions and facility operations.

Quality of care over time

These measures show how residents usually do over time at this home, based on health outcomes and preventive care.

High-risk clinical events score Info A composite score based on pressure ulcers, falls with injury, weight loss, walking ability decline, and activities of daily living decline. 5.6
15% better than California average

California average: 6.6

Functional decline score Info A composite score based on activities of daily living decline, walking ability decline, and incontinence. 7.0
38% better than California average

California average: 11.3

Long-stay resident measures
Need for Help with Daily Activities Increased Info Percent of long-stay residents whose need for help with daily activities has increased 3.5%
69% better than California average

California average: 11.1%

Walking Ability Worsened Info Percent of long-stay residents whose ability to move independently worsened 9.9%
17% better than California average

California average: 12.0%

Low Risk Residents with Bowel/Bladder Incontinence Info Percent of low risk long-stay residents who lose control of their bowels or bladder 7.6%
33% better than California average

California average: 11.3%

Falls with Major Injury Info Percent of long-stay residents experiencing one or more falls with major injury 6.6%
295% worse than California average

California average: 1.7%

High Risk Residents with Pressure Ulcers Info Percent of long-stay high risk residents with pressure ulcers 5.1%
In line with California average

California average: 5.0%

Urinary Tract Infection Info Percent of long-stay residents with a urinary tract infection 0.7%
41% better than California average

California average: 1.2%

Lost Too Much Weight Info Percent of long-stay residents who lose too much weight 3.1%
27% better than California average

California average: 4.2%

Depressive Symptoms Info Percent of long-stay residents who have depressive symptoms 0.8%
88% better than California average

California average: 6.7%

Antipsychotic Use Info Percent of long-stay residents who received an antipsychotic medication 8.0%
20% better than California average

California average: 10.1%

Pneumococcal Vaccine Info Percent of long-stay residents assessed and appropriately given the pneumococcal vaccine 93.4%
5% worse than California average

California average: 98.5%

Influenza Vaccine Info Percent of long-stay residents assessed and appropriately given the seasonal influenza vaccine 100.0%
In line with California average

California average: 98.2%

Hospitalizations per 1,000 days Info Number of hospitalizations per 1,000 long-stay resident days. 0.82
64% better than California average

California average: 2.25

ED visits per 1,000 days Info Number of outpatient emergency department visits per 1,000 long-stay resident days. 0.26
84% better than California average

California average: 1.59

Short-stay resident measures
Pneumococcal Vaccine Info Percent of short-stay residents assessed and appropriately given the pneumococcal vaccine 99.3%
6% better than California average

California average: 94.0%

Antipsychotic medication increase Info Percent of short-stay residents who newly received an antipsychotic medication 0.9%
40% better than California average

California average: 1.5%

Influenza Vaccine Info Percent of short-stay residents assessed and appropriately given the seasonal influenza vaccine 93.6%
In line with California average

California average: 93.2%

Re-hospitalized after SNF stay Info Percentage of short-stay residents who were re-hospitalized after their nursing home admission. 22.5%
In line with California average

California average: 23.2%

Emergency department visits Info Percentage of short-stay residents who had an outpatient emergency department visit. 5.8%
48% better than California average

California average: 11.2%

Falls with major injury Info Percentage of SNF residents who experience falls with major injury during their stay. 0.3%
62% better than California average

California average: 0.8%

Ability to care for self at discharge Info Percentage of residents at or above expected ability to care for themselves at discharge. 57.1%
6% better than California average

California average: 53.7%

Successful return to home or community Info Rate of successful return to home or community from a skilled nursing facility. 68.8%
36% better than California average

California average: 50.6%

Penalties and fines

Federal penalties imposed by CMS for regulatory violations, including civil money penalties (fines) and denials of payment for new Medicare/Medicaid admissions.

Source: CMS Penalties Database (Data as of Jan 2026)

Total fines amount $9K
83% lower than California average

California average: $55K

Number of fines 1
58% fewer fines than California average

California average: 2.4

Payment Denials Info Serious action where Medicare and/or Medicaid temporarily stops payments for new residents until issues are fixed. 0
100% fewer payment denials than California average

California average: 0.5

Fines amount comparison
This facility $9K
California average $55K
Penalty History

Penalties are imposed by CMS for violations of federal nursing home regulations.

Civil Money Penalty Info Fines imposed for noncompliance, which can be assessed per day or per instance of violation. Aug 23, 2023
$9K

Last updated: Jan 2026

Guides for Better Senior Living

Care Cost Calculator: See Prices in Your Area

Nursing Home Data Explorer

Don’t Wait Too Long: 7 Red Flag Signs Your Parent Needs Assisted Living Now

The True Cost of Assisted Living in 2025 – And How Families Are Paying For It

Understanding Senior Living Costs: Pricing Models, Discounts & Financial Assistance

Financial Aid for California Seniors

Get financial aid guidance

Multipurpose Senior Services Program

MSSP (Medi-Cal Waiver)

Age 65+, California resident, Medi-Cal eligible, nursing home risk.

~$2,829/month (300% FBR, individual).

$2,000 (individual), $3,000 (couple).

County-managed; waitlists possible.

In-Home Supportive Services (IHSS)

California IHSS

Age 65+, California resident, Medicaid-eligible or low-income.

~$1,732/month (individual, Medi-Cal threshold).

$2,000 (individual).

Can hire family as caregivers.

Multipurpose Senior Services Program (MSSP)

CA MSSP

Age 65+, California resident, Medi-Cal-eligible, nursing home-eligible but community-capable.

~$2,829/month (300% FBR, individual).

$2,000 (individual).

Available in 38 counties; waitlists common.

Property Tax Postponement Program (PTP)

CA PTP

Age 62+, California resident, own and live in home, 40% equity.

~$51,500/year (household, adjusted annually).

Equity-based; no strict asset cap.

Deferred taxes accrue interest (5% as of 2024); repaid upon sale/death.

Assisted Living Waiver (ALW)

CA ALW

Age 65+ or disabled, California resident, Medi-Cal-eligible, nursing home-eligible.

~$2,829/month (300% FBR, individual).

$2,000 (individual).

Available in 15 counties (e.g., LA, Sacramento); waitlists common.

California CARES Program

CA CARES

Caregivers of California residents 60+ needing help with 3+ daily activities; no caregiver age limit.

No strict limit; cost-sharing above ~$2,500/month threshold.

Not applicable; need-based.

High demand in urban areas; complements IHSS respite.

Low-Income Home Energy Assistance Program (LIHEAP)

CA LIHEAP

Age 60+ priority, California resident, low-income, utility/heating need.

~$2,510/month (200% of poverty level, individual).

Not applicable; income-focused.

High demand in inland/coastal extremes; weatherization capped at $5,000/home.

Who we are

Your Senior Care Partner, Every Step of the Way

We help families find affordable senior communities and unlock same day discounts, Medicaid, and Medicare options tailored to your needs.

Contact us Today
Tour Icon
Planning a tour? Check our touring checklist.
Chat Icon
Thinking of living here? We can help you speak to a current resident