


Total health inspections
4
Massachusetts average 4.5
Last Health inspection on Oct 2024

We arrange tours, appointments, and even moving support so you don’t have to
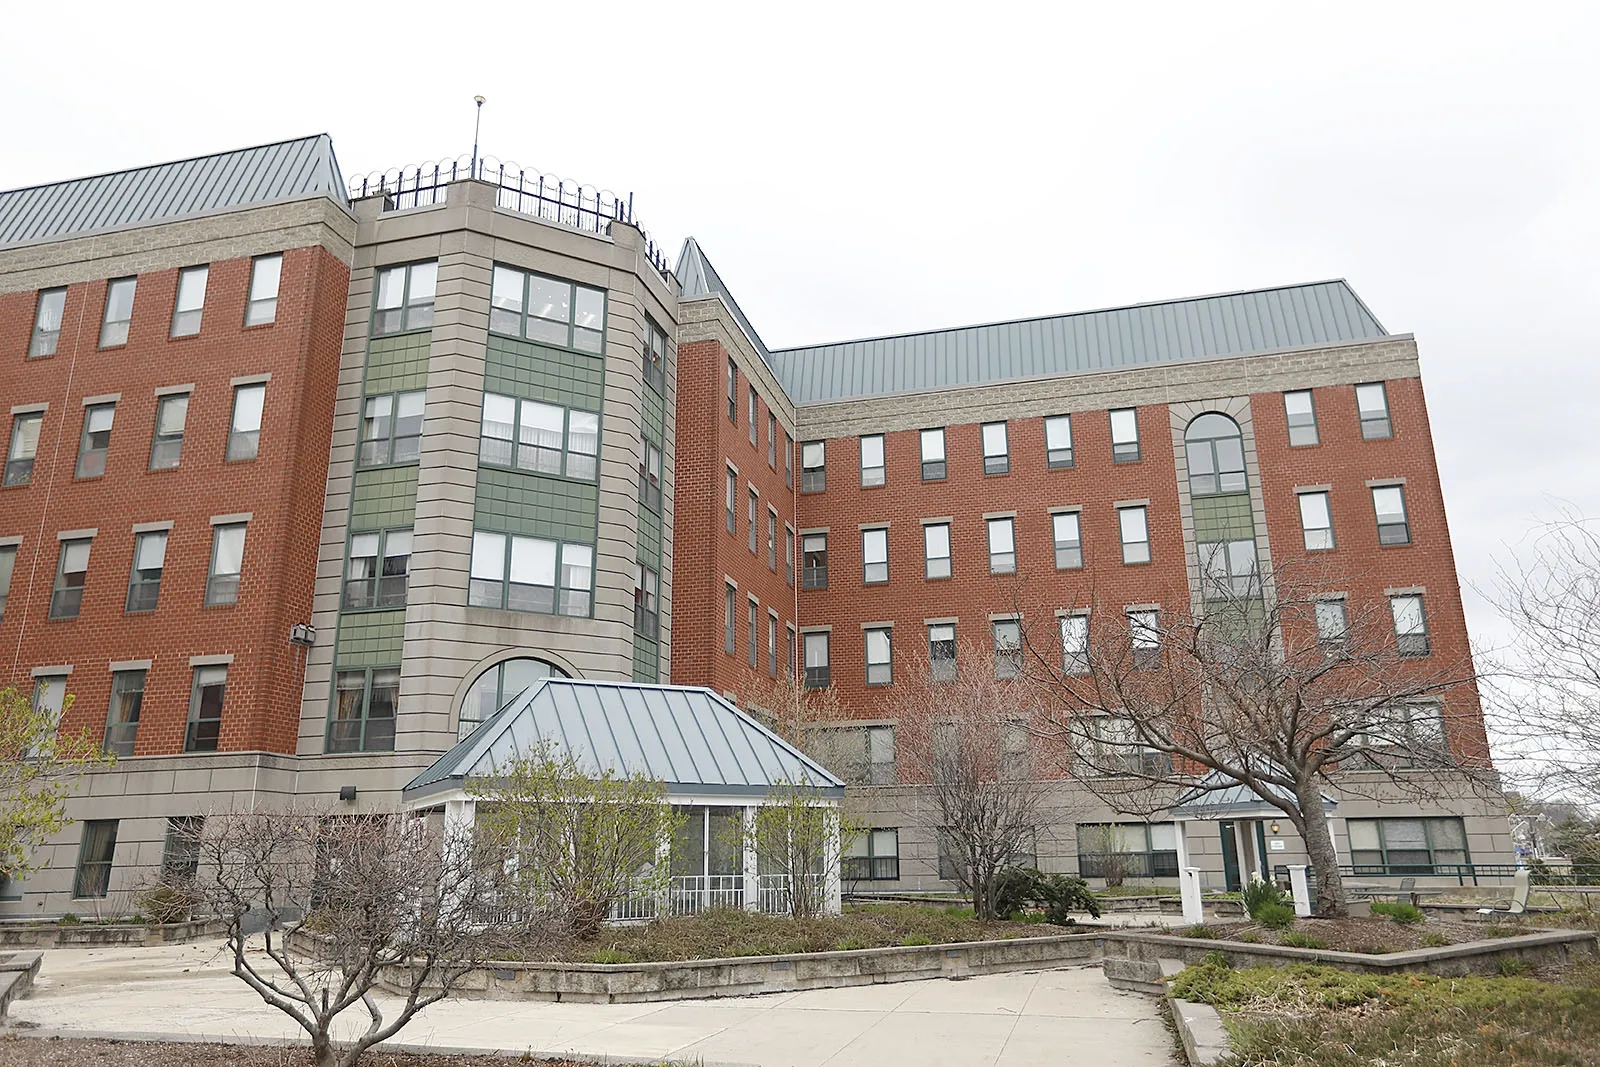


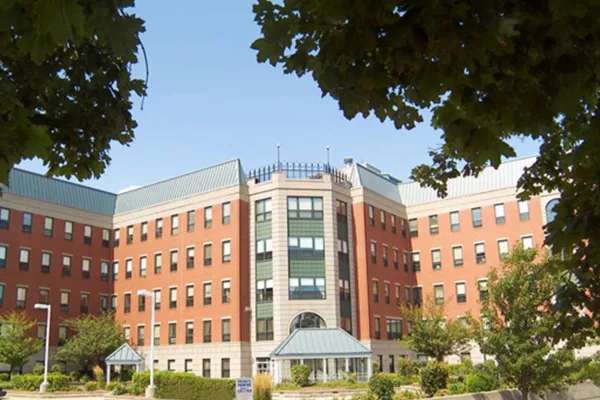
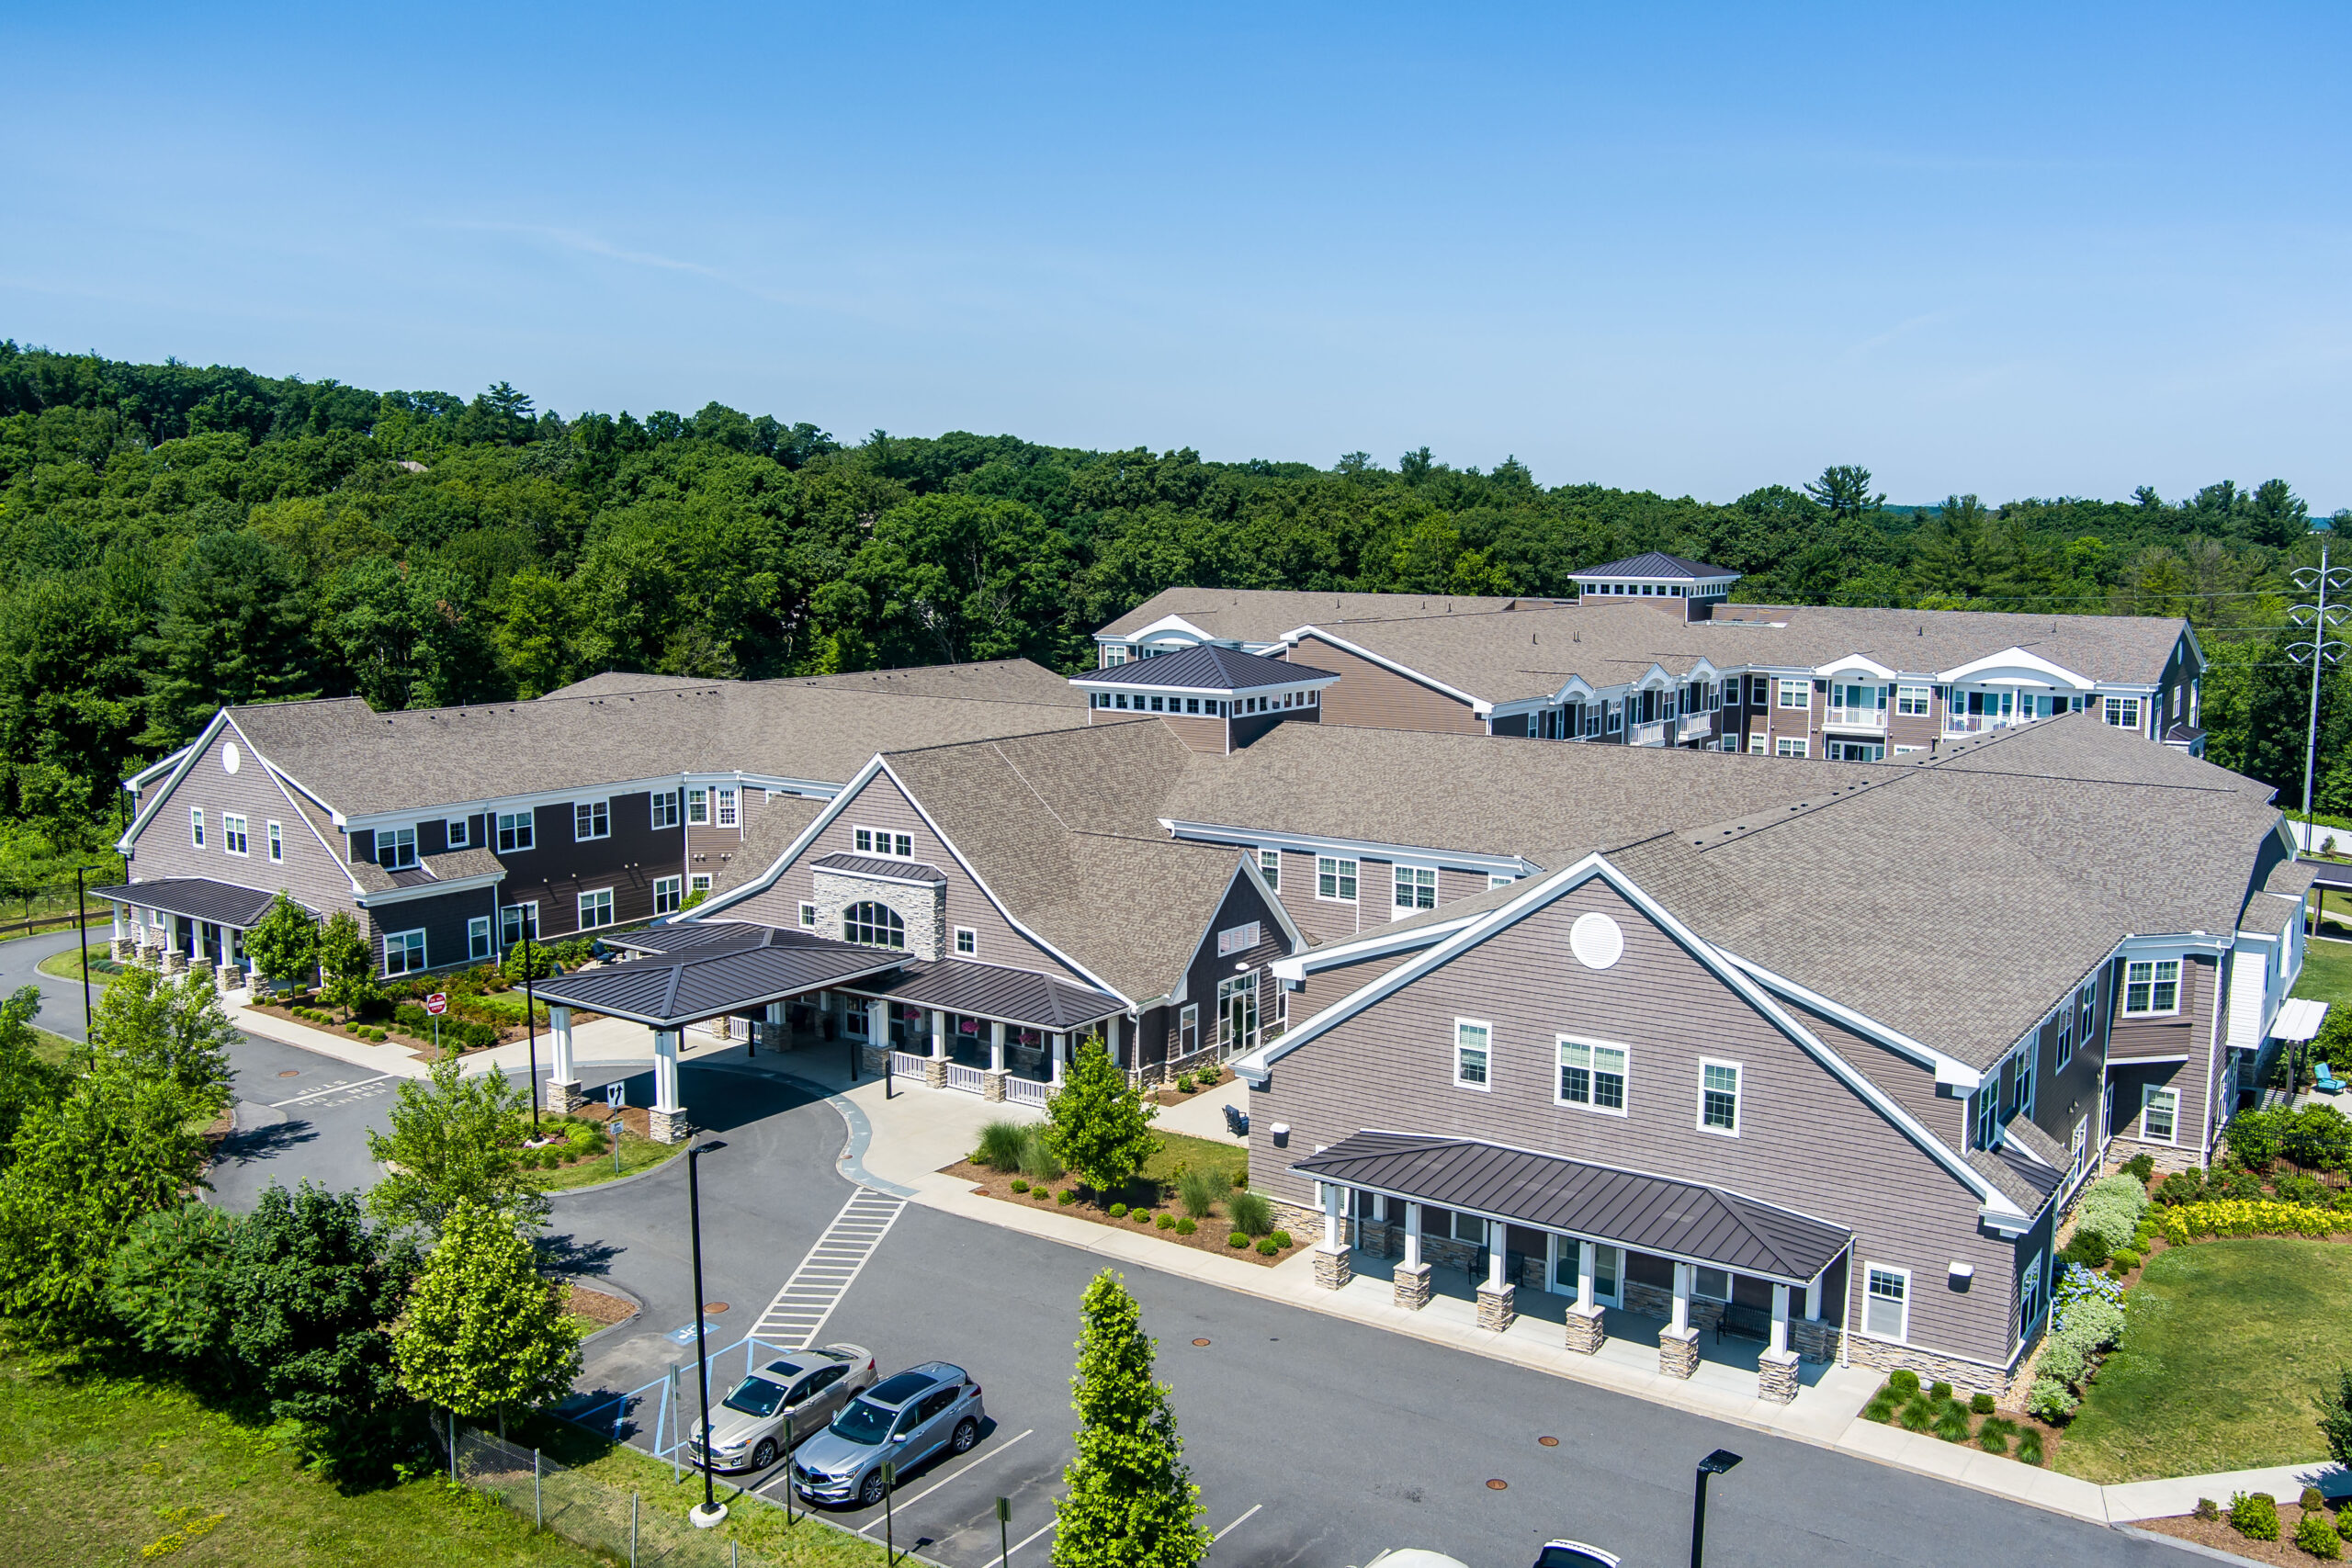
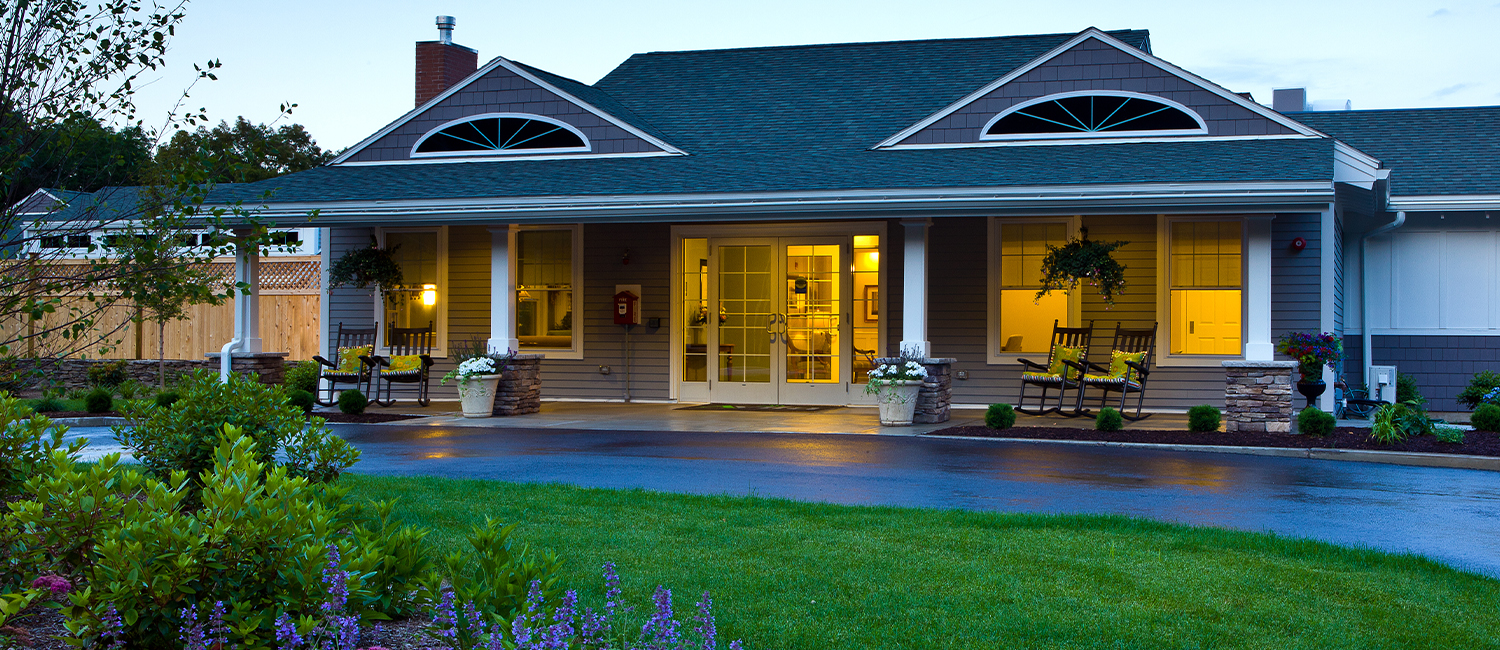
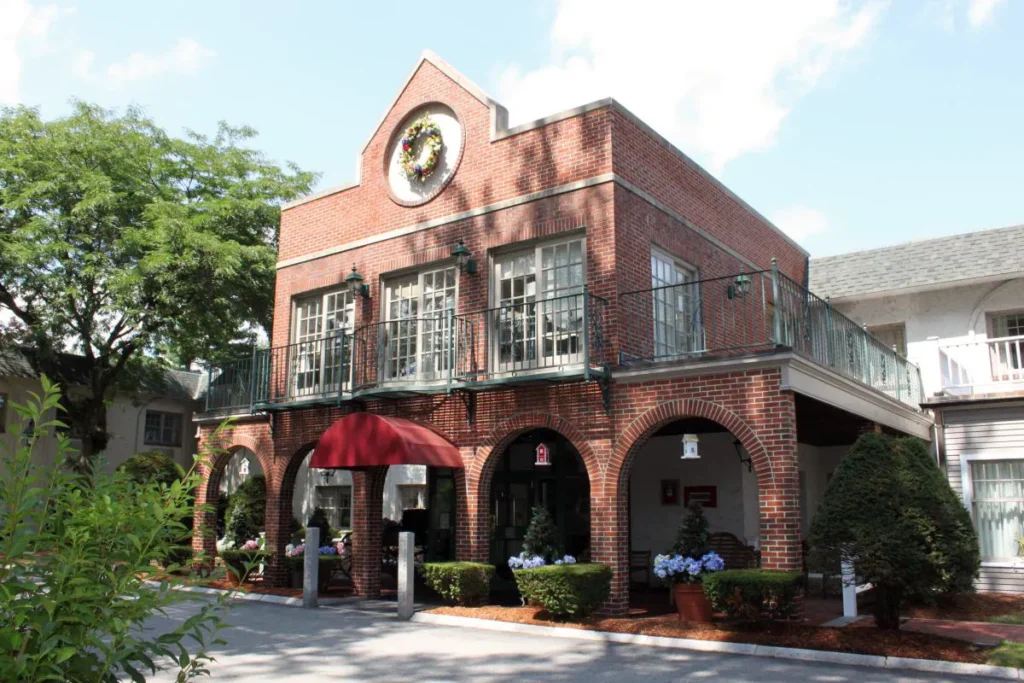
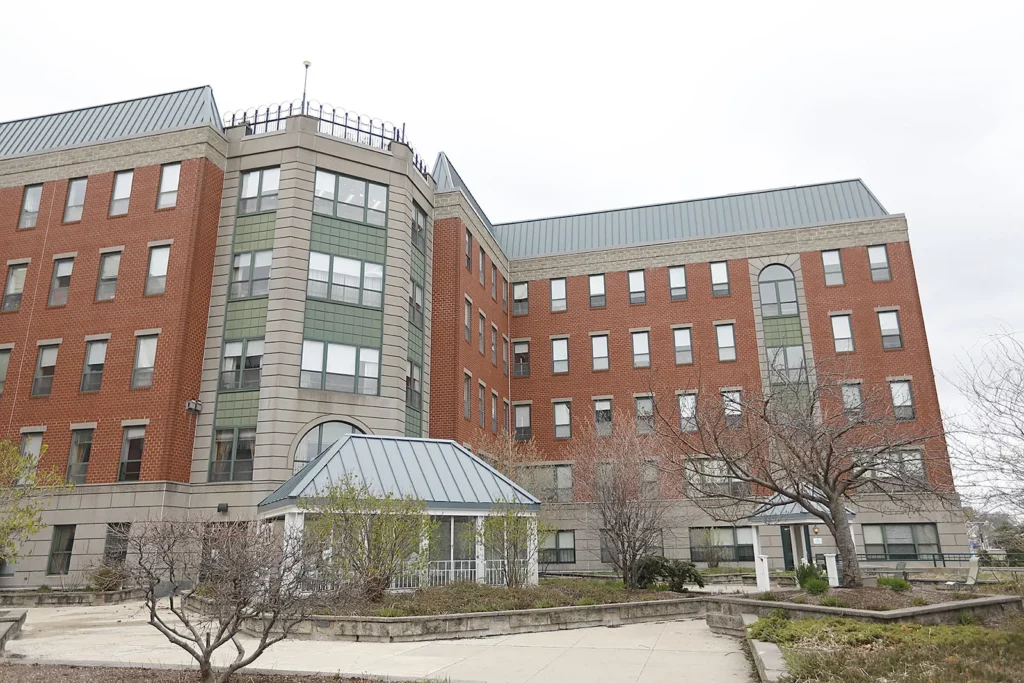
Hancock Park Rehabilitation & Nursing Center, nestled in Quincy, Massachusetts, has stood as a bastion of compassionate senior care since its establishment in 1996. Positioned conveniently near downtown Quincy, the center goes beyond providing care by creating a welcoming and inviting atmosphere for its residents. This 142-bed skilled center remains deeply ingrained in the local community, boasting a rich legacy and a commitment to excellence. Its dedicated Sub-acute Unit specializes in offering intensive rehabilitation and managing complex medical conditions.
Hancock Park Rehabilitation & Nursing Center epitomizes the harmonious blend of care and compassion, offering seniors a facility and a genuine place to call home. Guests are welcome to experience restaurant-style dining, where residents enjoy meals designed to preserve their dignity. Including a gift shop adds an extra touch of delight, while a roster of entertainment and recreational activities ensures high spirits among the residents. The exquisitely maintained outdoor courtyard is a tranquil space for contemplation and connection. Additionally, accessible parking facilities cater to the convenience of those with a car. Renowned for its state-of-the-art amenities and compassionate approach, Hancock Park adeptly caters to both short-term rehabilitation needs and long-term care requirements. Visiting hours extend from 8 am to 8 pm, ensuring ample opportunities for families and loved ones to connect with residents.
 Official CMS rating based on health inspections, staffing and quality measures.
Official CMS rating based on deficiencies found during state health inspections.
Official CMS rating based on nurse staffing hours per resident per day.
Official CMS rating based on clinical outcomes for residents.
Average daily nursing hours per resident (adjusted for acuity). Higher values indicate more nursing time per resident.
Hours of care per resident per day, broken down by staff type. Data from CMS Medicare.
Registered nurse hours per resident per day.
Licensed Practical Nurse / Licensed Vocational Nurse hours per resident per day.
Nurse aide hours per resident per day.
Total number of nurse staff hours per resident per day on weekends.
Physical therapist staff hours per resident per day.
Registered nurse hours per resident per day on weekends.
Official CMS rating based on health inspections, staffing and quality measures.
Official CMS rating based on deficiencies found during state health inspections.
Official CMS rating based on nurse staffing hours per resident per day.
Official CMS rating based on clinical outcomes for residents.
Average daily nursing hours per resident (adjusted for acuity). Higher values indicate more nursing time per resident.
Hours of care per resident per day, broken down by staff type. Data from CMS Medicare.
Registered nurse hours per resident per day.
Licensed Practical Nurse / Licensed Vocational Nurse hours per resident per day.
Nurse aide hours per resident per day.
Total number of nurse staff hours per resident per day on weekends.
Physical therapist staff hours per resident per day.
Registered nurse hours per resident per day on weekends.
Offers a balance of services and community atmosphere.
Occupancy is moderate, suggesting balanced demand.
Most residents typically stay for a few weeks or months before returning home or moving on.
42% of new residents, usually for short-term rehab.
41% of new residents, often for short stays.
17% of new residents, often for long-term daily care.
The portion of the home's budget spent on staff, including nurses, caregivers, and other employees who support care and operations.
All remaining costs needed to run the home, such as food, utilities, building maintenance, supplies and administrative expenses.
Nursing Home 24/7 care needed
Assisted Living For seniors needing help with daily tasks but not full-time nursing.
Nursing Home 24/7 care needed
Assisted Living For seniors needing help with daily tasks but not full-time nursing.
Nursing Home 24/7 care needed
Assisted Living For seniors needing help with daily tasks but not full-time nursing.
Nursing Home 24/7 care needed
Assisted Living For seniors needing help with daily tasks but not full-time nursing.
Nursing Home 24/7 care needed
Assisted Living For seniors needing help with daily tasks but not full-time nursing.
 Hancock Park Rehabilitation & Nursing Center
![]() 0.7 miles from city center — 3.39 miles to nearest hospital (Encompass Health Rehabilitation Hospital of Braintree)
0.7 miles from city center — 3.39 miles to nearest hospital (Encompass Health Rehabilitation Hospital of Braintree)
![]() Skilled Nursing Floor, 164 Parkingway, Quincy, MA 02169
Skilled Nursing Floor, 164 Parkingway, Quincy, MA 02169
Add your location
Source: CMS Payroll-Based Journal (Q2 2025)
| Role ⓘ | Count ⓘ | Avg Shift (hrs) ⓘ | Uses Contractors? ⓘ |
|---|---|---|---|
| Registered Nurse | 14 | 8.1 | No |
| Licensed Practical Nurse | 35 | 8.8 | Yes |
| Certified Nursing Assistant | 90 | 7.4 | No |
| Role ⓘ | Employees ⓘ | Contractors ⓘ | Total Staff ⓘ | Total Hours ⓘ | Days Worked ⓘ | % of Days ⓘ | Avg Shift (hrs) ⓘ |
|---|---|---|---|---|---|---|---|
| Certified Nursing Assistant | 90 | 0 | 90 | 24,118 | 91 | 100% | 7.4 |
| Licensed Practical Nurse | 32 | 3 | 35 | 10,178 | 91 | 100% | 8.8 |
| Registered Nurse | 14 | 0 | 14 | 3,316 | 91 | 100% | 8.1 |
| Clinical Nurse Specialist | 9 | 2 | 11 | 2,204 | 86 | 95% | 7.5 |
| RN Director of Nursing | 5 | 0 | 5 | 1,311 | 72 | 79% | 7.4 |
| Other Dietary Services Staff | 9 | 0 | 9 | 1,124 | 88 | 97% | 6.2 |
| Physical Therapy Aide | 0 | 5 | 5 | 910 | 70 | 77% | 6.5 |
| Mental Health Service Worker | 2 | 1 | 3 | 875 | 64 | 70% | 7.8 |
| Physical Therapy Assistant | 0 | 6 | 6 | 860 | 77 | 85% | 7.1 |
| Respiratory Therapy Technician | 0 | 4 | 4 | 790 | 77 | 85% | 6.6 |
| Speech Language Pathologist | 0 | 4 | 4 | 761 | 74 | 81% | 7.8 |
| Administrator | 2 | 0 | 2 | 558 | 65 | 71% | 7.9 |
| Dietitian | 1 | 0 | 1 | 512 | 64 | 70% | 8 |
| Nurse Practitioner | 1 | 0 | 1 | 488 | 61 | 67% | 8 |
| Qualified Social Worker | 0 | 2 | 2 | 451 | 64 | 70% | 6.9 |
| Nurse Aide in Training | 2 | 0 | 2 | 222 | 29 | 32% | 7.7 |
| Occupational Therapy Aide | 6 | 0 | 6 | 179 | 32 | 35% | 5.6 |
| Occupational Therapy Assistant | 0 | 1 | 1 | 30 | 6 | 7% | 5 |
| Medical Director | 0 | 1 | 1 | 6 | 6 | 7% | 1 |
Massachusetts average 4.5
Last Health inspection on Oct 2024
Health citations are formal notices following inspections when they fail to comply with safety and care standards.
34 of 36 citations resulted from standard inspections; and 2 of 36 resulted from complaint investigations.
Massachusetts average: 0.3
Massachusetts average: 1.5
Data sourced from CMS Health Deficiencies reports. Citation severity codes range from A (least serious) to L (most serious). Immediate Jeopardy (J-L) citations indicate situations where the facility's noncompliance has placed residents at risk of death or serious harm.
Source: CMS Long-Term Care Facility Characteristics (Data as of Jan 2026)
Active councils help families stay involved in care decisions and facility operations.
These measures show how residents usually do over time at this home, based on health outcomes and preventive care.
Massachusetts average: 10.2
Massachusetts average: 20.0
Massachusetts average: 18.7%
Massachusetts average: 19.3%
Massachusetts average: 22.1%
Massachusetts average: 3.6%
Massachusetts average: 4.7%
Massachusetts average: 2.1%
Massachusetts average: 5.2%
Massachusetts average: 10.7%
Massachusetts average: 20.3%
Massachusetts average: 91.9%
Massachusetts average: 94.8%
Massachusetts average: 1.86
Massachusetts average: 1.54
Massachusetts average: 76.7%
Massachusetts average: 1.3%
Massachusetts average: 77.7%
Massachusetts average: 25.8%
Massachusetts average: 11.8%
Massachusetts average: 0.8%
Massachusetts average: 53.7%
Massachusetts average: 50.6%
Quality measures are calculated from Minimum Data Set (MDS) assessments. For most measures, lower percentages indicate better care quality.
Federal penalties imposed by CMS for regulatory violations, including civil money penalties (fines) and denials of payment for new Medicare/Medicaid admissions.
Source: CMS Penalties Database (Data as of Jan 2026)
Massachusetts average: $72K
Massachusetts average: 1.7
Massachusetts average: 0.1
Penalties are imposed by CMS for violations of federal nursing home regulations.
Last updated: Jan 2026
Historical financial and operational data for Hancock Park Rehabilitation & Nursing Center based on CMS SNF Cost Reports.
Loading trend charts...
Care Cost Calculator: See Prices in Your Area
Nursing Home Data Explorer
Don’t Wait Too Long: 7 Red Flag Signs Your Parent Needs Assisted Living Now
The True Cost of Assisted Living in 2025 – And How Families Are Paying For It
Understanding Senior Living Costs: Pricing Models, Discounts & Financial Assistance

We help families find affordable senior communities and unlock same day discounts, Medicaid, and Medicare options tailored to your needs.
Contact us Today
Touring a community? Use this expert-backed checklist to stay organized, ask the right questions, and find the perfect fit.
We'll send you a PDF version of the touring checklist.


