Huntsville Health and Rehabilitation, LLC

Nursing Home

Huntsville Health and Rehabilitation, LLC

4010 Chris Dr SW, Huntsville, AL 35802 View Map
Nursing Home
icon
Care Cost Calculator: See Prices in Your Area Care Cost Calculator: See Prices in Your Area icon
Overview of Huntsville Health and Rehabilitation, LLC

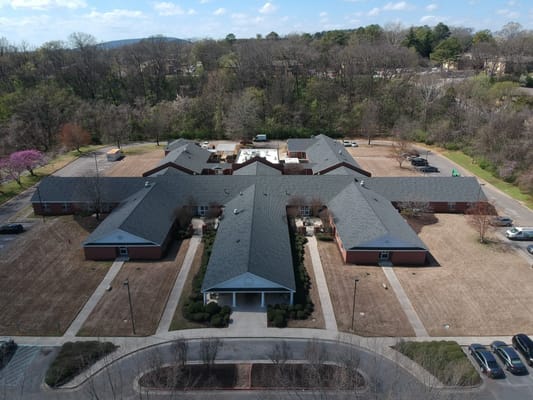
Enjoy the highest quality of care with Huntsville Health and Rehabilitation LLC, an exceptional community in Huntsville, AL, offering long-term care and rehabilitation. With a compassionate and well-trained team of registered nurses and therapists available around the clock, residents receive top-notch care for their unique needs. The community also promotes a nurturing and welcoming environment, so residents can feel at ease during their stay.

With inviting communal spaces, residents can interact with their surroundings and live actively. Healthy meals are important for residents’ well-being, so delightful and nutritious dining options are served to satisfy residents’ dietary needs and preferences. Residents can recover quickly and make the most of their best years with the community’s comprehensive care and exceptional services.

(256) 883-8656

Quality ratings

Measured by Centers for Medicare & Medicaid Services (CMS)

Overall rating Info Official CMS rating based on health inspections, staffing and quality measures.
3/5
Alabama average: 2.9/5
Health Inspection Info Official CMS rating based on deficiencies found during state health inspections.
3/5
Alabama average: 2.8/5
Staffing Info Official CMS rating based on nurse staffing hours per resident per day.
3/5
Alabama average: 3.5/5
Quality Measures Info Official CMS rating based on clinical outcomes for residents.
3/5
Alabama average: 3.0/5

Nursing care per resident

Info Average daily nursing hours per resident (adjusted for acuity). Higher values indicate more nursing time per resident.
4h 40m per day

This home provides 7% more nursing time per resident than the state average.

Alabama average: 4h 22m per day

Staffing hours breakdown

Info Hours of care per resident per day, broken down by staff type. Data from CMS Medicare.
Staff type Facility State avg National avg
Registered Nurse (RN) Info Registered nurse hours per resident per day. 43m per day 38m per day 41m per day
LPN / LVN Info Licensed Practical Nurse / Licensed Vocational Nurse hours per resident per day. 36m per day 47m per day 52m per day
Nurse Aide Info Nurse aide hours per resident per day. 2h 25m per day 2h 30m per day 2h 21m per day
Total Nursing (Weekend) Info Total number of nurse staff hours per resident per day on weekends. 2h 56m per day 3h 17m per day 3h 26m per day
Physical Therapist Info Physical therapist staff hours per resident per day. 2m per day 2m per day 4m per day
RN (Weekend) Info Registered nurse hours per resident per day on weekends. 23m per day 22m per day 29m per day

Capacity and availability

Medium-capacity home

Offers a balance of services and community atmosphere.

Total beds 105

This home is often near full

That suggests steady demand, but availability may be limited.

Higher demand than most homes in Alabama
Occupancy rate 95.9%
Residents per day (avg) 95
Occupancy rate
95.9%
Residents per day (avg)
95

Who this home usually serves

TYPE OF STAY

Mix of rehab and long-term care

This home supports both short-term rehab and long-term care, with residents staying for a wide range of durations.

Breakdown by payment type

Medicare

32% of new residents, usually for short-term rehab.

Typical stay 29 days

Private pay

50% of new residents, often for short stays.

Typical stay 3 - 4 months

Medicaid

18% of new residents, often for long-term daily care.

Typical stay 2 years

Finances and operations

Proprietary home
Corporation
Home revenue
$10.3M
Operating loss
-$256.8K
Proprietary home Corporation
Home revenue
$10,273,904.00
Operating loss
$-256,768.00
Payroll costs Info The portion of the home's budget spent on staff, including nurses, caregivers, and other employees who support care and operations.
$5.0M
49% of revenue
Other operating costs Info All remaining costs needed to run the home, such as food, utilities, building maintenance, supplies and administrative expenses.
$5.5M
Total costs $10.5M
Bed community size
105-bed community
A larger shared setting that may offer more common spaces and organized community services.
Walk Score
Walk Score: 31 / 100
Somewhat walkable. A few nearby services may be reachable on foot, but most trips require transportation.

About this community

License Status
Regular
Facility Type
Nursing Home

Additional licensing details

Business type: Limited Liability Company
CMS Certification Number: 15440
County: Madison

Ownership & operating entity

Huntsville Health and Rehabilitation, LLC is administrated by Latoya Bester.

Type Of Units

SNF (Skilled Nursing)
105 units
Total beds
105 units

Care Services

Nursing Services
Rehabilitation Services
Licensed Nurses/CNAs

Amenities & Lifestyle

Beautician services
laundry services
cable television
complimentary Wi-Fi
outdoor courtyards
daily activities.

Programs & Activities

Specific Programs
Services, Weekly Menu, Take A Tour, Resources, Careers, Contact

Dining & Nutrition

Food Description
Residents can dine in the comfort of their room or in a restaurant-style dining area.

What does this home offer?

Housing options icon

Housing Options: Private / Shared Rooms

Building type icon
Building type icon

Building Type: Single-story

Dining services icon

Dining Services

Beauty services icon

Beauty Services

Housekeeping icon
Housekeeping icon

Housekeeping Services

Social and recreational activities icon

Social and Recreational Activities

On-site medical care and health services icon

On-site Medical Care and Health Services

Types of Care at Huntsville Health and Rehabilitation, LLC

Nursing Home
Contact Huntsville Health and Rehabilitation, LLC

Compare Nursing Homes around Huntsville

The information below is reported by the Alabama Department of Public Health, Bureau of Health Provider Standards.
Huntsville Health and Rehabilitation, LLC
SNF

Nursing Homes 24/7 care needed

Huntsville
105
No
31
HUNTSVILLE HEALTH REALTY, LLC
95.9%
$10,211,175.00
$5,038,857.00
49.3%
95.30
3/5
4.6672
3/5
3/5
3/5
-
6
-
+22%
+7%
+19%
Private / Shared Rooms
Brookshire Healthcare Center
AL

Assisted Living For seniors needing help with daily tasks but not full-time nursing.

SNF

Nursing Homes 24/7 care needed

Huntsville
129
No
36
AOP SNF OPERATIONS HOLDINGS LLC
82.0%
$10,991,375.00
$3,598,810.00
32.7%
116.70
2/5
4.7806
3/5
4/5
1/5
-
8
-
-26%
+9%
+2%
Private / Shared Rooms
Signature HealthCARE of Whitesburg Gardens
AL

Assisted Living For seniors needing help with daily tasks but not full-time nursing.

SNF

Nursing Homes 24/7 care needed

Huntsville
159
No
51
SHC LP HOLDINGS LLC
64.9%
$16,242,622.00
$4,151,986.00
25.6%
107.00
1/5
4.5619
1/5
4/5
3/5
3
20
3
+47%
+4%
-20%
Private / Shared Rooms
Millennium Nursing and Rehab Center
SNF

Nursing Homes 24/7 care needed

Huntsville
91
No
8
AHP ORCHARDS LLC
86.2%
$11,882,717.00
$4,268,459.00
35.9%
80.50
1/5
3.9267
1/5
3/5
1/5
1
20
3
+60%
-10%
+7%
Private / Shared Rooms
Floyd E. “Tut” Fann State Veterans Home
SNF

Nursing Homes 24/7 care needed

Huntsville
150
No
32
-
-
-
-
-
-
-
-
-
-
-
-
-
-
-
-
-
Private / Shared Rooms

Places of interest near Huntsville Health and Rehabilitation, LLC

Address 4.3 miles from city center

Address 4010 Chris Dr SW, Huntsville, AL 35802

Calculate Travel Distance to Huntsville Health and Rehabilitation, LLC

Add your location

Address

Staffing Data

Source: CMS Payroll-Based Journal (Q2 2025)

179
Total Staff
149
Employees
30
Contractors
36,327
Total Hours (Quarter)
53
Avg Staff/Day
7.5
Avg Shift (hrs)
Nursing Staff Breakdown
Role Count Avg Shift (hrs) Uses Contractors?
Registered Nurse218.5 No
Licensed Practical Nurse238.1 No
Certified Nursing Assistant627.5 No
Staff by Category
Administration
3 staff
5.6hs shift avg
Nursing Staff
131 staff
7.8hs shift avg
Physicians & Practitioners
6 staff
7.8hs shift avg
Therapy Services
21 staff
6hs shift avg
Activities & Recreation
0 staff
0hs shift avg
Social Services
11 staff
4.8hs shift avg
Dietary Services
5 staff
7.6hs shift avg
Other Services
2 staff
8hs shift avg
Contractor Analysis
6%
of total hours from contractors
2,187 contractor hours this quarter
Speech Language Pathologist: 7 Physical Therapy Aide: 3 Respiratory Therapy Technician: 5 Qualified Social Worker: 11 Physical Therapy Assistant: 3 Medical Director: 1
Role Employees Contractors Total Staff Total Hours Days Worked % of Days Avg Shift (hrs)
Certified Nursing Assistant6206218,35491100%7.5
Licensed Practical Nurse230234,89291100%8.1
Registered Nurse210214,50491100%8.5
Nurse Aide in Training170172,85791100%7.5
Clinical Nurse Specialist4049106369%7.8
Speech Language Pathologist0776566875%6.4
RN Director of Nursing3036086571%7.6
Mental Health Service Worker2024245358%8
Qualified Social Worker011114216774%4.8
Respiratory Therapy Technician0553907077%5.6
Nurse Practitioner2023844853%8
Physical Therapy Aide0333765560%6.8
Dietitian2023444044%8.6
Physical Therapy Assistant0333206875%4.7
Other Dietary Services Staff3032894347%6.7
Medication Aide/Technician5052733033%8.8
Administrator2021441820%8
Occupational Therapy Aide1011041314%8
Occupational Therapy Assistant2025378%7.5
Medical Director011241213%2

Health Inspection History

Inspections
Total health inspections 3

Alabama average 2.9


Last Health inspection on Jan 2022

Total health citations 6
Citations per inspection
2

Health citations are formal notices following inspections when they fail to comply with safety and care standards.

All 6 citations resulted from standard inspections.

Breakdown of citation severity (last 3 years)
Critical Health citations More info 0
100% better than Alabama average

Alabama average: 0.7


Serious Health citations More info 0
100% better than Alabama average

Alabama average: 0.2

0 critical citations More info Alabama average: 0.7

0 serious citations More info Alabama average: 0.2

6 moderate citations More info Alabama average: 9.1

0 minor citations More info Alabama average: 0.4
Citations history (last 3 years)
Nutrition moderate citation Jan 14, 2022
Corrected

Quality of Care moderate citation Jan 14, 2022
Corrected

Infection Control moderate citation Oct 24, 2019
Corrected

Nutrition moderate citation Sep 12, 2018
Corrected

Facility Characteristics

Source: CMS Long-Term Care Facility Characteristics (Data as of Jan 2026)

Ownership: For-Profit Corporation
Part of: NHS MANAGEMENT
Resident Census by Payment Source
103 Total Residents
Medicare 4 (3.9%)
Medicaid 74 (71.8%)
Private Pay/Other 25 (24.3%)
Programs & Services
Residents' Group
Family Member Group
Family Engagement

Active councils help families stay involved in care decisions and facility operations.

Quality of care over time

These measures show how residents usually do over time at this home, based on health outcomes and preventive care.

High-risk clinical events score Info A composite score based on pressure ulcers, falls with injury, weight loss, walking ability decline, and activities of daily living decline. 8.2
8% better than Alabama average

Alabama average: 8.9

Functional decline score Info A composite score based on activities of daily living decline, walking ability decline, and incontinence. 15.6
7% worse than Alabama average

Alabama average: 14.5

Long-stay resident measures
Need for Help with Daily Activities Increased Info Percent of long-stay residents whose need for help with daily activities has increased 10.0%
28% better than Alabama average

Alabama average: 13.9%

Walking Ability Worsened Info Percent of long-stay residents whose ability to move independently worsened 15.7%
In line with Alabama average

Alabama average: 16.1%

Low Risk Residents with Bowel/Bladder Incontinence Info Percent of low risk long-stay residents who lose control of their bowels or bladder 21.0%
54% worse than Alabama average

Alabama average: 13.6%

Falls with Major Injury Info Percent of long-stay residents experiencing one or more falls with major injury 4.2%
25% worse than Alabama average

Alabama average: 3.4%

High Risk Residents with Pressure Ulcers Info Percent of long-stay high risk residents with pressure ulcers 6.8%
14% worse than Alabama average

Alabama average: 5.9%

Urinary Tract Infection Info Percent of long-stay residents with a urinary tract infection 1.4%
48% better than Alabama average

Alabama average: 2.7%

Lost Too Much Weight Info Percent of long-stay residents who lose too much weight 4.3%
21% better than Alabama average

Alabama average: 5.4%

Depressive Symptoms Info Percent of long-stay residents who have depressive symptoms 0.6%
51% better than Alabama average

Alabama average: 1.2%

Antipsychotic Use Info Percent of long-stay residents who received an antipsychotic medication 15.3%
26% better than Alabama average

Alabama average: 20.7%

Pneumococcal Vaccine Info Percent of long-stay residents assessed and appropriately given the pneumococcal vaccine 90.1%
In line with Alabama average

Alabama average: 91.5%

Influenza Vaccine Info Percent of long-stay residents assessed and appropriately given the seasonal influenza vaccine 80.7%
15% worse than Alabama average

Alabama average: 94.8%

Hospitalizations per 1,000 days Info Number of hospitalizations per 1,000 long-stay resident days. 0.99
51% better than Alabama average

Alabama average: 2.00

ED visits per 1,000 days Info Number of outpatient emergency department visits per 1,000 long-stay resident days. 1.20
33% better than Alabama average

Alabama average: 1.79

Short-stay resident measures
Pneumococcal Vaccine Info Percent of short-stay residents assessed and appropriately given the pneumococcal vaccine 83.0%
In line with Alabama average

Alabama average: 83.7%

Antipsychotic medication increase Info Percent of short-stay residents who newly received an antipsychotic medication 1.0%
54% better than Alabama average

Alabama average: 2.1%

Influenza Vaccine Info Percent of short-stay residents assessed and appropriately given the seasonal influenza vaccine 73.9%
8% worse than Alabama average

Alabama average: 80.3%

Re-hospitalized after SNF stay Info Percentage of short-stay residents who were re-hospitalized after their nursing home admission. 16.6%
32% better than Alabama average

Alabama average: 24.5%

Emergency department visits Info Percentage of short-stay residents who had an outpatient emergency department visit. 10.9%
5% better than Alabama average

Alabama average: 11.5%

Falls with major injury Info Percentage of SNF residents who experience falls with major injury during their stay. 0.0%
100% better than Alabama average

Alabama average: 0.8%

Ability to care for self at discharge Info Percentage of residents at or above expected ability to care for themselves at discharge. 39.3%
27% worse than Alabama average

Alabama average: 53.7%

Successful return to home or community Info Rate of successful return to home or community from a skilled nursing facility. 41.9%
17% worse than Alabama average

Alabama average: 50.6%

Guides for Better Senior Living

Care Cost Calculator: See Prices in Your Area

Nursing Home Data Explorer

Don’t Wait Too Long: 7 Red Flag Signs Your Parent Needs Assisted Living Now

The True Cost of Assisted Living in 2025 – And How Families Are Paying For It

Understanding Senior Living Costs: Pricing Models, Discounts & Financial Assistance

Financial Aid for Alabama Seniors

Get financial aid guidance

Elderly and Disabled Waiver

Alabama Medicaid E&D Waiver

Age 65+ or disabled, Alabama resident, Medicaid-eligible, requires nursing home-level care but can live in community with support.

~$2,829/month (300% FBR, individual).

$2,000 (individual), $3,000 (couple) (excludes home, car).

Must be assessed by a nurse for nursing home-level care need.

Alabama Respite for Caregivers Program

Alabama Respite (via NFCSP)

Caregiver of someone 60+ (or with dementia), Alabama resident.

No strict limit; prioritizes low-income.

Not applicable.

Focus on rural caregivers; limited funding.

SenioRx Prescription Assistance Program

AL SenioRx

Age 55+, Alabama resident, chronic illness requiring daily medication, not fully covered by other drug plans.

~$3,000/month (individual, varies by AAA).

Not strictly enforced; income-focused.

High ROI; saved $43.5M for 6,825 participants in FY 2022.

Weatherization Assistance Program (WAP)

AL WAP

Age 60+ priority, Alabama resident, own or rent home, low-income status.

~$2,510/month (200% of poverty level, individual).

Not applicable; income-driven.

Prioritizes seniors and disabled; limited annual funding.

Section 202 Supportive Housing for the Elderly

AL Section 202

Age 62+, Alabama resident, very low income, able to live independently with support.

~$1,500/month (50% of area median income, individual, varies by county).

$10,000 (individual, excludes home if owned).

High demand in urban areas like Birmingham; limited units statewide.

Alabama CARES Program

AL CARES

Caregivers of Alabama residents aged 60+ needing assistance with 3+ daily activities; no age limit for caregivers.

No strict limit; cost-sharing based on recipient’s income (e.g., ~$2,500/month threshold).

Not applicable; focus on need.

Prioritizes caregivers with greatest economic/social need; complements respite programs like AL Lifespan Respite.

Who we are

Your Senior Care Partner, Every Step of the Way

We help families find affordable senior communities and unlock same day discounts, Medicaid, and Medicare options tailored to your needs.

Contact us Today