James L. West Center for Dementia Care

Memory Care Home
Overview of James L. West Center for Dementia Care

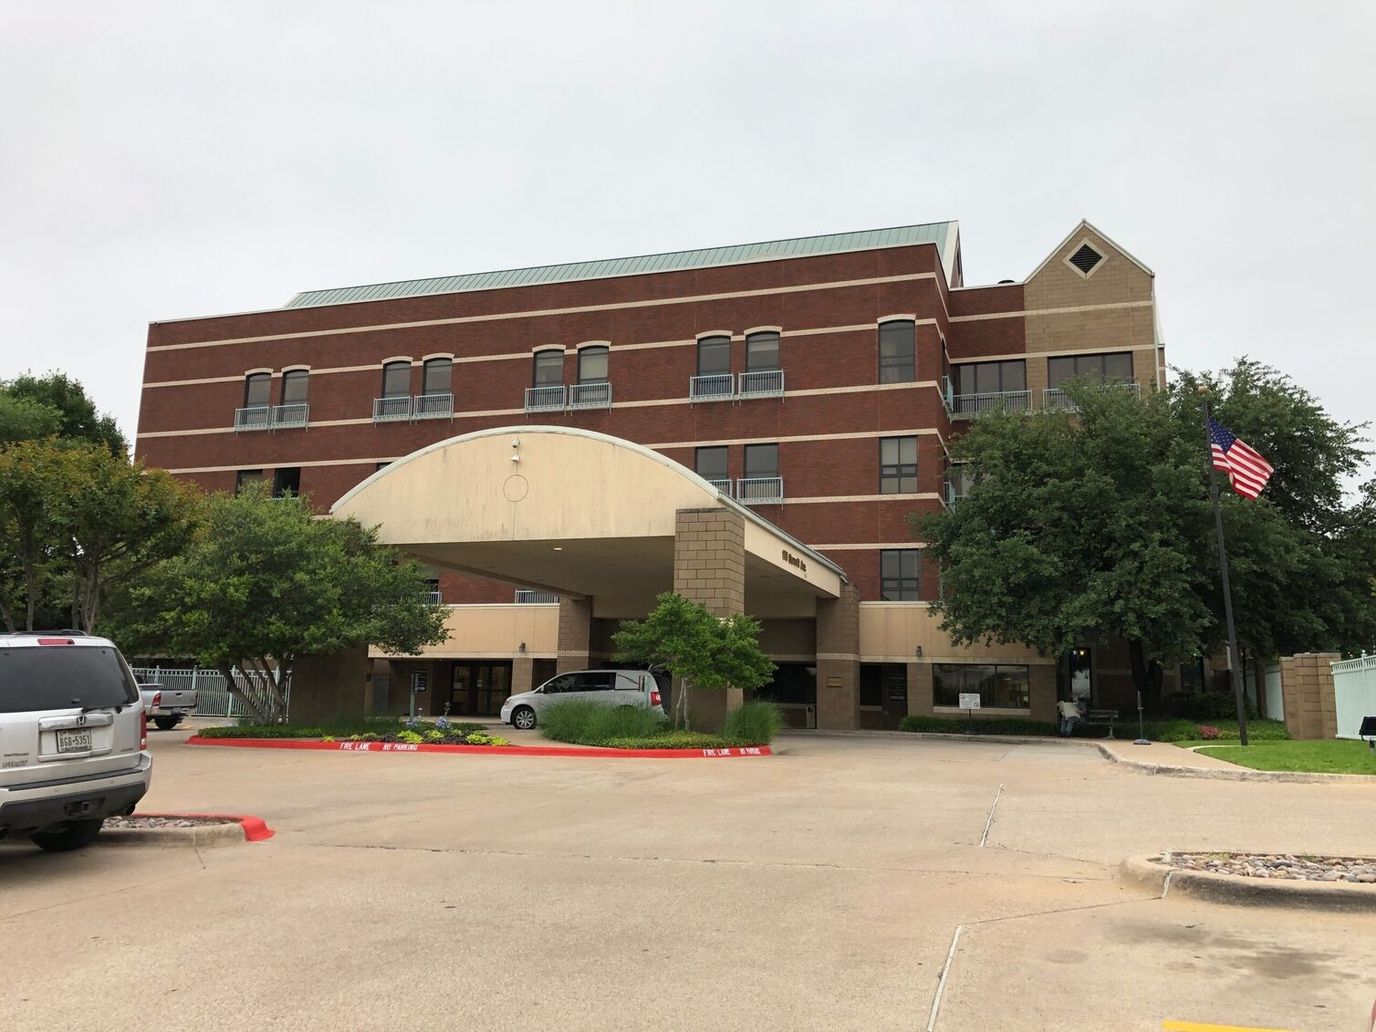
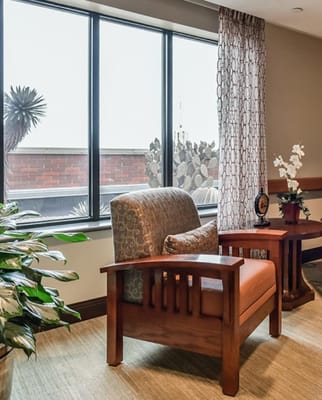
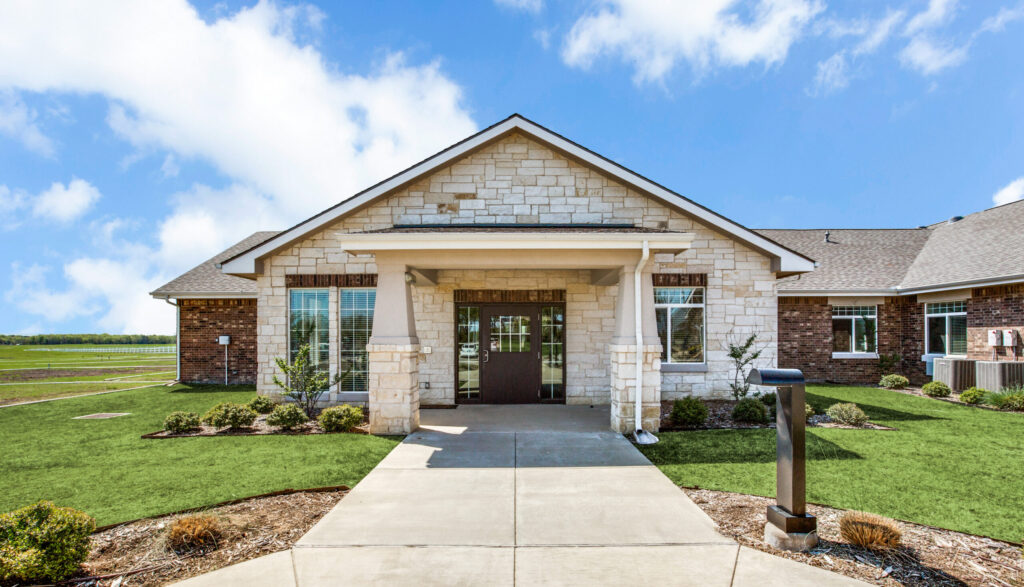
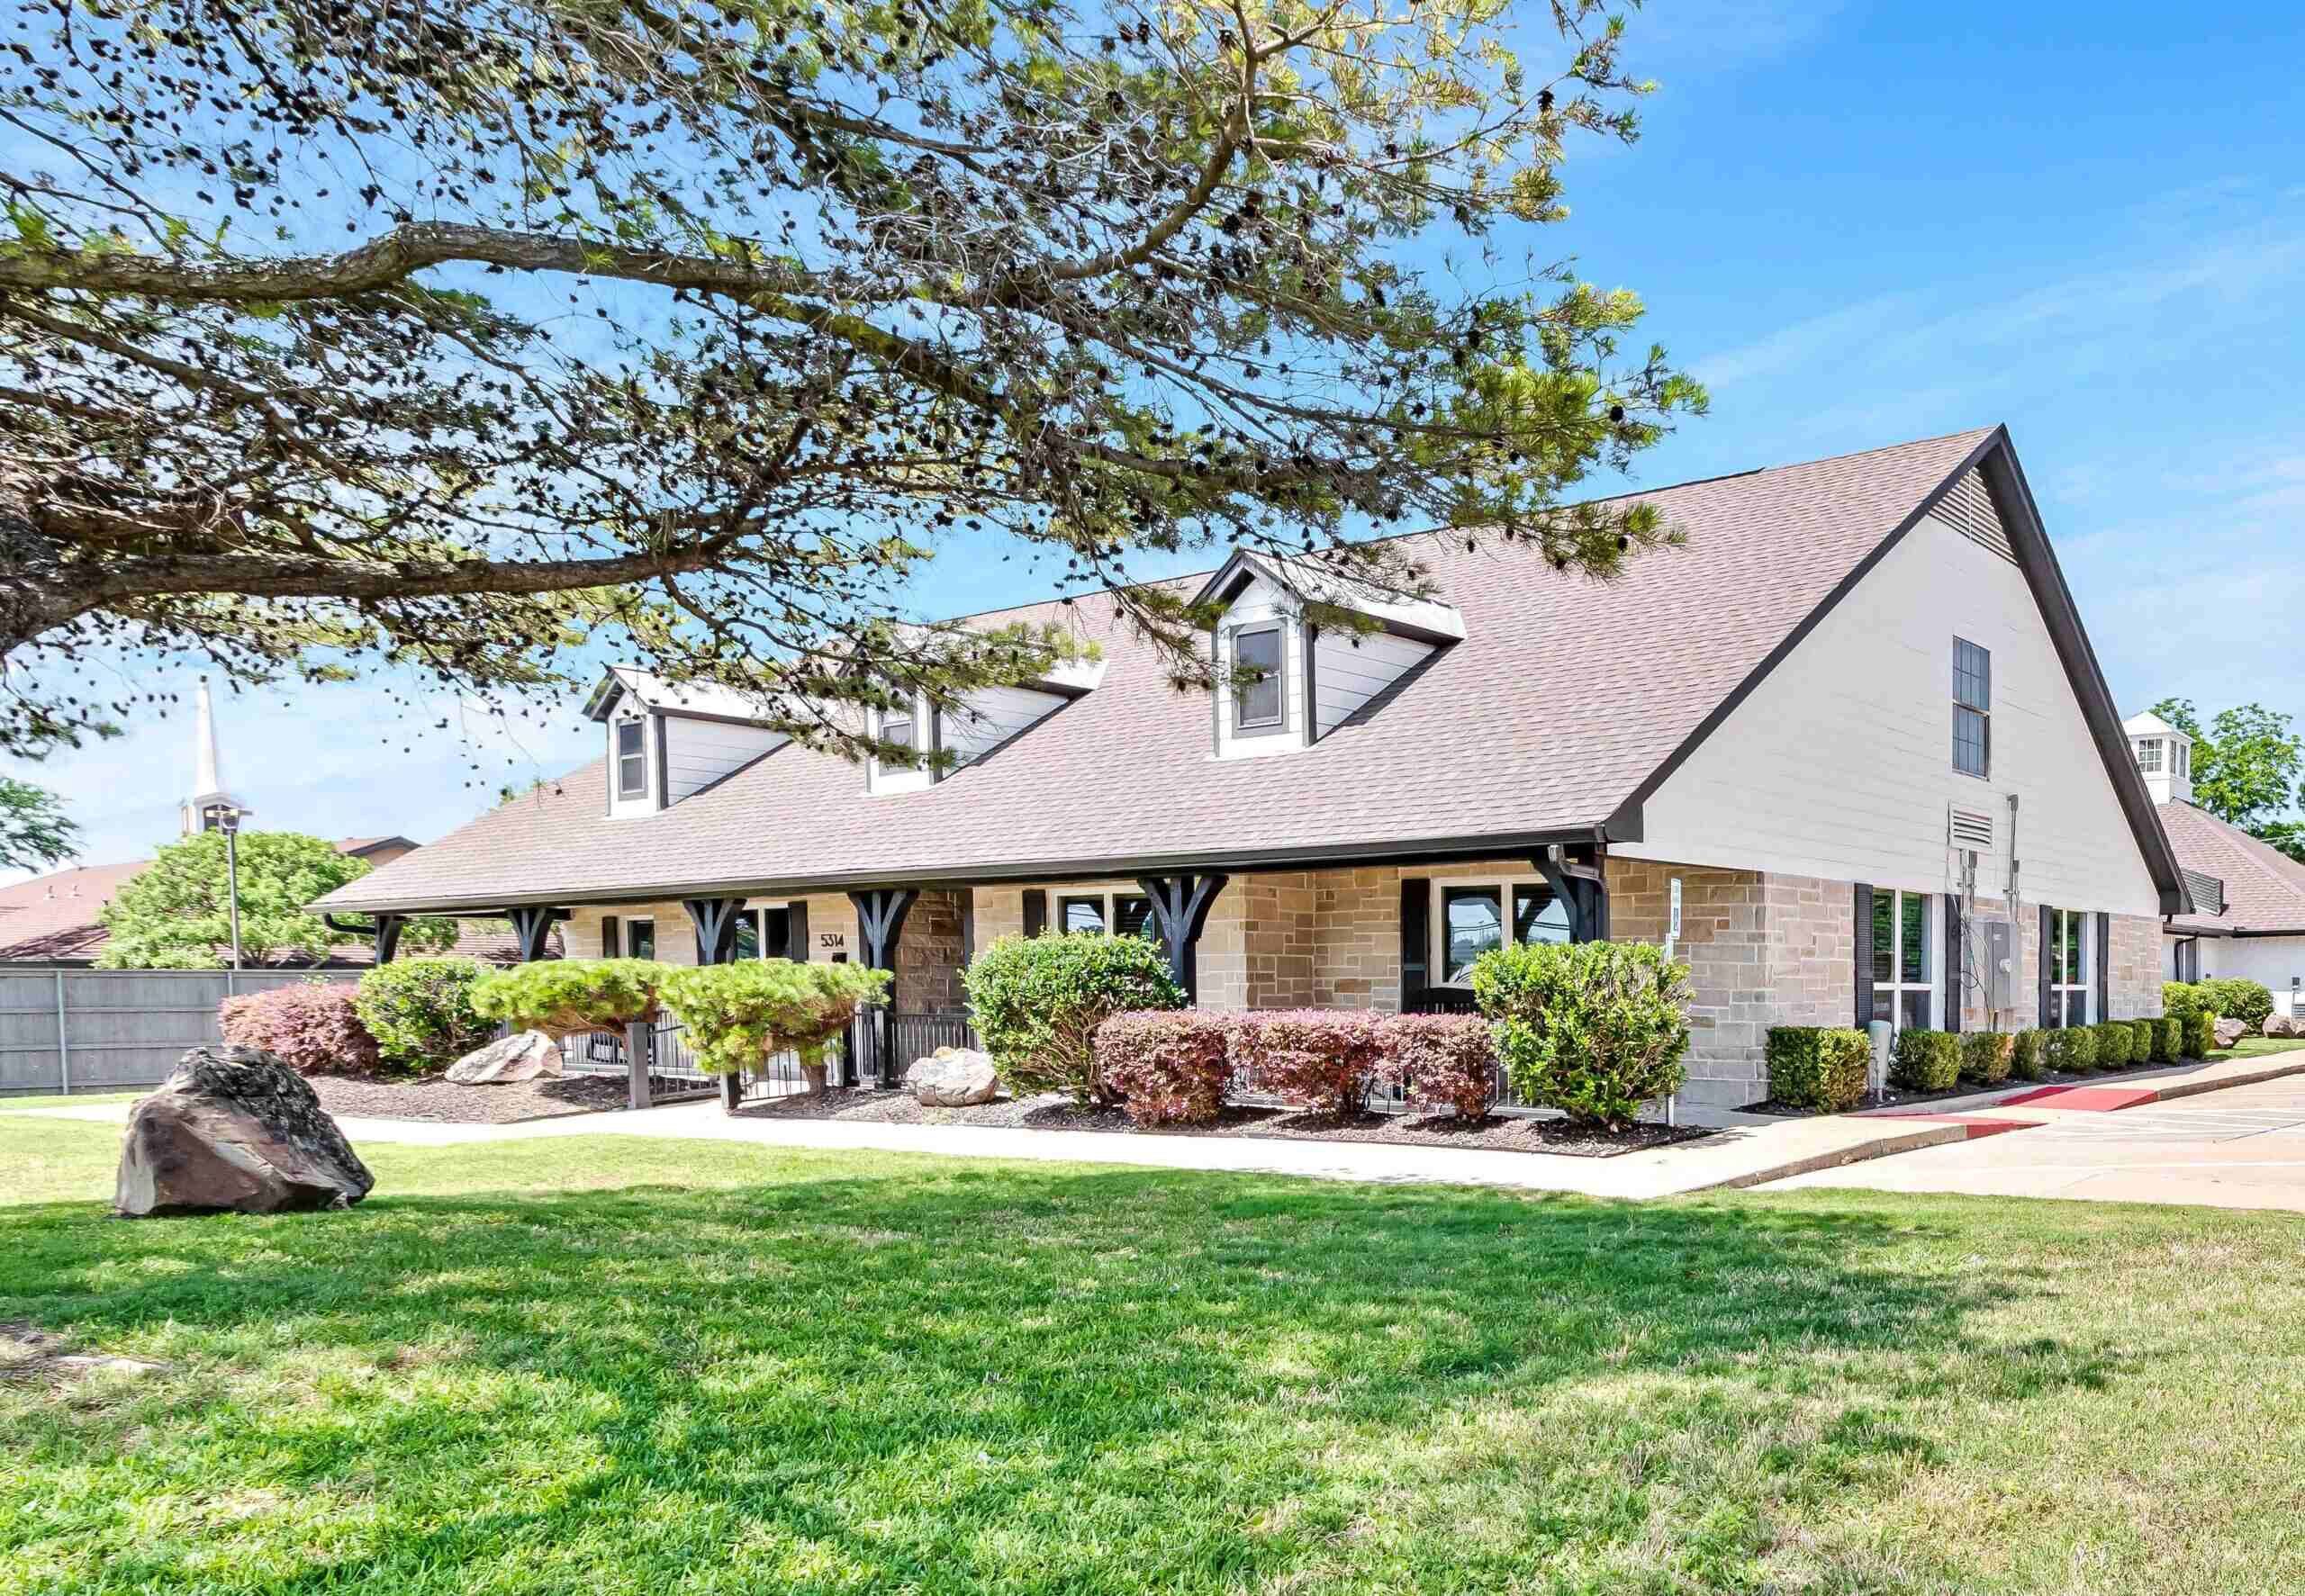
Ideally located in Fort Worth, TX, James L. West Center for Dementia Care provides a safe retreat for those dealing with the challenges of memory loss. Through their personalized memory care program, the community aims to help residents live their lives fully and comfortably despite their condition. A team of highly trained and experienced caregivers is always available to care for residents and ensure their care plans align with their needs.

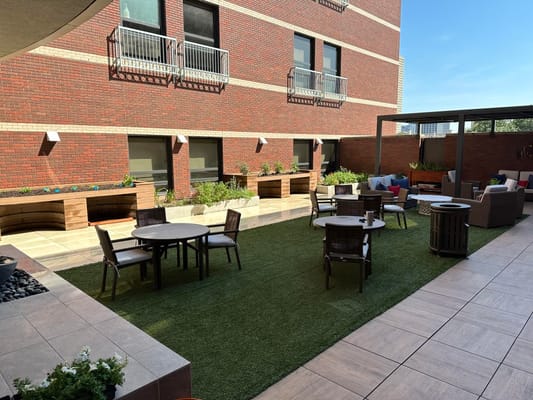
As a non-profit community, James L. West Center for Dementia Care guarantees comprehensive care services focused solely on residents’ welfare. Residents here are also encouraged to freely participate in a wide array of enriching activities tailored to their interests and skills. With a strong commitment to loving care and an exceptional care team, the community ensures its residents live a fulfilling life.

(817) 765-8945

Managed by Tami Fitzgerald

Healthcare Administrator

Tami Fitzgerald serves as the Healthcare Administrator at James L. West Center for Dementia Care. She has been with the community since 2021, providing dedicated leadership and support to ensure quality care for residents.

Quality ratings

Measured by Centers for Medicare & Medicaid Services (CMS)

Overall rating Info Official CMS rating based on health inspections, staffing and quality measures.
2/5
Texas average: 2.8/5
Health Inspection Info Official CMS rating based on deficiencies found during state health inspections.
2/5
Texas average: 2.8/5
Staffing Info Official CMS rating based on nurse staffing hours per resident per day.
4/5
Texas average: 2.1/5
Quality Measures Info Official CMS rating based on clinical outcomes for residents.
4/5
Texas average: 3.8/5

Nursing care per resident

Info Average daily nursing hours per resident (adjusted for acuity). Higher values indicate more nursing time per resident.
5h 31m per day

This home provides 52% more nursing time per resident than the state average.

Texas average: 3h 38m per day

Staffing hours breakdown

Info Hours of care per resident per day, broken down by staff type. Data from CMS Medicare.
Staff type Facility State avg National avg
Registered Nurse (RN) Info Registered nurse hours per resident per day. 20m per day 26m per day 41m per day
LPN / LVN Info Licensed Practical Nurse / Licensed Vocational Nurse hours per resident per day. 1h 24m per day 57m per day 52m per day
Nurse Aide Info Nurse aide hours per resident per day. 3h 0m per day 2h 1m per day 2h 21m per day
Total Nursing (Weekend) Info Total number of nurse staff hours per resident per day on weekends. 4h 25m per day 2h 59m per day 3h 26m per day
Physical Therapist Info Physical therapist staff hours per resident per day. 3m per day 4m per day 4m per day
RN (Weekend) Info Registered nurse hours per resident per day on weekends. 12m per day 21m per day 29m per day

Capacity and availability

Medium-capacity home

Offers a balance of services and community atmosphere.

Total beds 112

This home usually has availability

Lower occupancy suggests more openings may be available.

Lower demand than the Texas average
Occupancy rate 81.4%
Residents per day (avg) 100
Occupancy rate
81.4%
Residents per day (avg)
100

Who this home usually serves

TYPE OF STAY

Mostly short-term rehab stays

Most residents typically stay for a few weeks or months before returning home or moving on.

Might be optimal for
Short stays Recovery Medicare-covered care

Breakdown by payment type

Medicare

90% of new residents, usually for short-term rehab.

Typical stay 1 - 2 months

Private pay

10% of new residents, often for short stays.

Typical stay 18 years

Finances and operations

Voluntary non-profit home
Other
Home revenue
$14.6M
Operating deficit
-$1.0M
Voluntary non-profit home Other
Home revenue
$14,616,545.00
Operating deficit
$-1,016,319.00
Payroll costs Info The portion of the home's budget spent on staff, including nurses, caregivers, and other employees who support care and operations.
$8.6M
58.8% of revenue
Other operating costs Info All remaining costs needed to run the home, such as food, utilities, building maintenance, supplies and administrative expenses.
$7.0M
Total costs $15.6M
Bed community size
112-bed community
A larger shared setting that may offer more common spaces and organized community services.
Years in operation
2 years in operation
A newer community that may feature more recent facilities and programs.
Walk Score
Walk Score: 73 / 100
Very walkable. Most errands can be accomplished on foot, and many essentials are within a short walk.

Services

MEDICARE ONLY

About this community

License Status
Active
Facility Type
Nursing
License Date
January 1, 2024
License Expiration
May 8, 2026

Additional licensing details

License number: 148475
County: TARRANT

Ownership & operating entity

James L. West Center for Dementia Care is administrated by MACK BALDRIDGE.

Owner: JAMES L WEST PRESBYTERIAN SPECIAL CARE CENTER
Ownership type: Nonprofit Organization

Type Of Units

Alzheimer's Units
112 units
Medicare
112 units
Total beds
112 units

Staffing

Key information about the people who lead and staff this community.

Leadership

Care Services

Accepts Medicaid
Accepts Medicare
Doctor on Staff
Nursing Services
Rehabilitation Services
Respite Care
Memory Care
Independent Living
Skilled Nursing
Licensed Nurses/CNAs
24-Hour Staffing
Short-Term Rehab

All Levels of Care

Residential Care
Short-term Rehab
Respite Care
Senior Day Program
Home Care

Amenities & Lifestyle

Salon services
transportation services
emergency systems
secured perimeter
volunteer programs

Programs & Activities

Specific Programs
Residential Care, Short-term Rehab, Respite Care, Senior Day Program, Home Care, Dementia-IQ, Professional Education, Caregiver Education
Volunteer Programs
Yes
Operating Hours
Monday-Friday: 8am-5pm, Saturday: Closed, Sunday: Closed

What does this home offer?

Housing options icon

Housing Options: Studio / Semi-Private Rooms

Building type icon
Building type icon

Building Type: 3-story
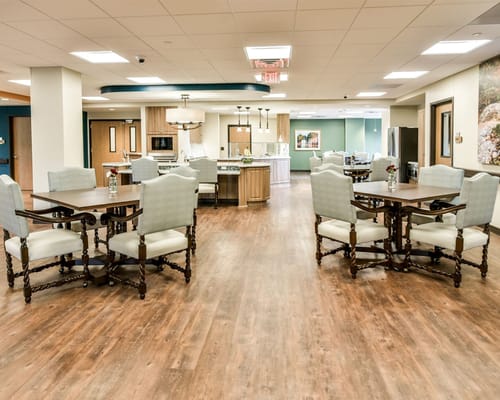
Dining services icon

Dining Services

Beauty services icon

Beauty Services

Transportation services icon

Transportation Services

Housekeeping icon
Housekeeping icon

Housekeeping Services

Recreational activities icon

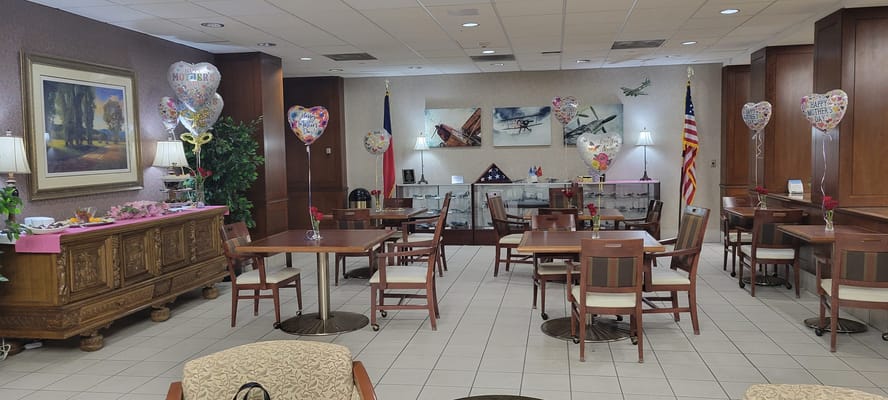
Recreational Activities

Types of Care at James L. West Center for Dementia Care

Memory Care Respite Care
Contact James L. West Center for Dementia Care

Access & Eligibility

Ways to qualify for care at this community, including accepted programs and payment options.

Medicare Accepted

This facility is certified for eligible Medicare services.

Payment & Funding Options

Medicare

Compare Memory Care around Tarrant County

The information below is reported by the Texas Health and Human Services Commission.
James L. West Center for Dementia Care
SNF

Nursing Home 24/7 care needed

MC

Memory Care Specialized care for those with Memory Loss, Alzheimer's, or dementia, ensuring safety and support.

RC

Respite Care

Fort Worth
112
No
-
73
-
81.4%
$13,649,565.00
$8,593,825.00
63%
100.40
2/5
5.5206
2/5
4/5
4/5
9
18
8
+8%
+52%
+28%
Studio / Semi-Private Rooms
Oxford Glen Memory Care at Grand Prairie
MC

Memory Care Specialized care for those with Memory Loss, Alzheimer's, or dementia, ensuring safety and support.

Grand Prairie
48
Yes
-
1
OXFORD MEMORY CARE GP, LTD
-
-
-
-
-
-
-
-
-
-
-
-
-
-
-
-
Studio / 1 Bed / 2 Bed
Silver Leaf Assisted Living & Memory Care
AL

Assisted Living For seniors needing help with daily tasks but not full-time nursing.

MC

Memory Care Specialized care for those with Memory Loss, Alzheimer's, or dementia, ensuring safety and support.

Colleyville
16
No
-
28
LAKE POINT ASSISTED LIVING LLC
-
-
-
-
-
-
-
-
-
-
-
-
-
-
-
-
Private / Shared Rooms
Mayberry Gardens Assisted Living and Memory Care Homes
AL

Assisted Living For seniors needing help with daily tasks but not full-time nursing.

MC

Memory Care Specialized care for those with Memory Loss, Alzheimer's, or dementia, ensuring safety and support.

Grand Prairie
15 Residents
No
A+
10
-
-
-
-
-
-
-
-
-
-
-
-
-
-
-
-
-
Studio
Satori Senior Care
AL

Assisted Living For seniors needing help with daily tasks but not full-time nursing.

MC

Memory Care Specialized care for those with Memory Loss, Alzheimer's, or dementia, ensuring safety and support.

Arlington (West Arlington)
6
No
A+
33
SATORI SENIOR CARE INC
-
-
-
-
-
-
-
-
-
-
-
-
-
-
-
-
Private / Semi-Private Rooms

Places of interest near James L. West Center for Dementia Care

Address 1.1 miles from city center

Address 1111 Summit Ave, Fort Worth, TX 76102

Calculate Travel Distance to James L. West Center for Dementia Care

Add your location

Address

Staffing Data

Source: CMS Payroll-Based Journal (Q2 2025)

173
Total Staff
134
Employees
39
Contractors
52,213
Total Hours (Quarter)
63
Avg Staff/Day
9.1
Avg Shift (hrs)
Nursing Staff Breakdown
Role Count Avg Shift (hrs) Uses Contractors?
Registered Nurse149.7 Yes
Licensed Practical Nurse469.8 Yes
Certified Nursing Assistant729.8 Yes
Staff by Category
Administration
3 staff
6.7hs shift avg
Nursing Staff
137 staff
9.7hs shift avg
Physicians & Practitioners
2 staff
8hs shift avg
Therapy Services
14 staff
6.5hs shift avg
Activities & Recreation
0 staff
0hs shift avg
Social Services
3 staff
5.5hs shift avg
Dietary Services
12 staff
7.8hs shift avg
Other Services
2 staff
7.2hs shift avg
Contractor Analysis
1.8%
of total hours from contractors
936 contractor hours this quarter
Certified Nursing Assistant: 5 Registered Nurse: 9 Licensed Practical Nurse: 20 Feeding Assistant: 2 Medical Director: 2 Occupational Therapy Aide: 1
Role Employees Contractors Total Staff Total Hours Days Worked % of Days Avg Shift (hrs)
Certified Nursing Assistant6757227,54091100%9.8
Licensed Practical Nurse26204611,41191100%9.8
Other Dietary Services Staff100103,1688695%7.7
Registered Nurse59142,0259099%9.7
RN Director of Nursing3031,4246571%8
Physical Therapy Assistant5059837380%6.8
Dietitian2029306066%8
Mental Health Service Worker2027616571%7.2
Qualified Social Worker3035927582%5.5
Respiratory Therapy Technician3035647279%6.5
Administrator1015126470%8
Clinical Nurse Specialist1015126470%8
Speech Language Pathologist3034826875%7.1
Nurse Practitioner1014645864%8
Physical Therapy Aide2024186470%6.2
Feeding Assistant0222213741%6
Occupational Therapy Aide0111442831%5.1
Medical Director022622022%2.8

Health Inspection History

Inspections
Total health inspections 7

Texas average 7.4


Last Health inspection on Jun 2025

Total health citations 18
Citations per inspection
2.57

Health citations are formal notices following inspections when they fail to comply with safety and care standards.

8 of 18 citations resulted from standard inspections; and 10 of 18 resulted from complaint investigations.

Breakdown of citation severity (last 3 years)
Critical Health citations More info 7
250% worse than Texas average

Texas average: 2


Serious Health citations More info 1
150% worse than Texas average

Texas average: 0.4

7 critical citations More info Texas average: 2

1 serious citation More info Texas average: 0.4

10 moderate citations More info Texas average: 23

0 minor citations More info Texas average: 0.4
Citations history (last 3 years)
Abuse/Neglect serious citation Jun 12, 2025
Corrected

Pharmacy moderate citation Jun 12, 2025
Corrected

Pharmacy moderate citation Jun 12, 2025
Corrected

Quality of Care moderate citation Jun 12, 2025
Corrected

Facility Characteristics

Source: CMS Long-Term Care Facility Characteristics (Data as of Jan 2026)

Ownership: Non-Profit Corporation
Resident Census by Payment Source
102 Total Residents
Medicare 13 (12.7%)
Private Pay/Other 89 (87.3%)
Specialized Care Beds
112 Total Specialty Beds
100% of Bed Capacity
112
Alzheimer's / Dementia Beds
100%
Programs & Services
Residents' Group
Family Member Group
Family Engagement

Active councils help families stay involved in care decisions and facility operations.

Quality of care over time

These measures show how residents usually do over time at this home, based on health outcomes and preventive care.

High-risk clinical events score Info A composite score based on pressure ulcers, falls with injury, weight loss, walking ability decline, and activities of daily living decline. 15.1
76% worse than Texas average

Texas average: 8.6

Functional decline score Info A composite score based on activities of daily living decline, walking ability decline, and incontinence. 26.0
62% worse than Texas average

Texas average: 16.0

Long-stay resident measures
Need for Help with Daily Activities Increased Info Percent of long-stay residents whose need for help with daily activities has increased 34.5%
113% worse than Texas average

Texas average: 16.2%

Walking Ability Worsened Info Percent of long-stay residents whose ability to move independently worsened 22.6%
39% worse than Texas average

Texas average: 16.2%

Low Risk Residents with Bowel/Bladder Incontinence Info Percent of low risk long-stay residents who lose control of their bowels or bladder 20.9%
34% worse than Texas average

Texas average: 15.7%

Falls with Major Injury Info Percent of long-stay residents experiencing one or more falls with major injury 3.1%
In line with Texas average

Texas average: 3.2%

High Risk Residents with Pressure Ulcers Info Percent of long-stay high risk residents with pressure ulcers 2.5%
43% better than Texas average

Texas average: 4.4%

Urinary Tract Infection Info Percent of long-stay residents with a urinary tract infection 1.7%
116% worse than Texas average

Texas average: 0.8%

Lost Too Much Weight Info Percent of long-stay residents who lose too much weight 12.9%
272% worse than Texas average

Texas average: 3.5%

Depressive Symptoms Info Percent of long-stay residents who have depressive symptoms 2.1%
26% better than Texas average

Texas average: 2.9%

Antipsychotic Use Info Percent of long-stay residents who received an antipsychotic medication 24.6%
212% worse than Texas average

Texas average: 7.9%

Pneumococcal Vaccine Info Percent of long-stay residents assessed and appropriately given the pneumococcal vaccine 81.5%
16% worse than Texas average

Texas average: 97.3%

Influenza Vaccine Info Percent of long-stay residents assessed and appropriately given the seasonal influenza vaccine 99.0%
In line with Texas average

Texas average: 97.9%

Hospitalizations per 1,000 days Info Number of hospitalizations per 1,000 long-stay resident days. 1.33
38% better than Texas average

Texas average: 2.13

ED visits per 1,000 days Info Number of outpatient emergency department visits per 1,000 long-stay resident days. 0.56
73% better than Texas average

Texas average: 2.07

Short-stay resident measures
Pneumococcal Vaccine Info Percent of short-stay residents assessed and appropriately given the pneumococcal vaccine 69.3%
23% worse than Texas average

Texas average: 90.4%

Antipsychotic medication increase Info Percent of short-stay residents who newly received an antipsychotic medication 12.0%
726% worse than Texas average

Texas average: 1.4%

Influenza Vaccine Info Percent of short-stay residents assessed and appropriately given the seasonal influenza vaccine 92.7%
5% better than Texas average

Texas average: 88.0%

Re-hospitalized after SNF stay Info Percentage of short-stay residents who were re-hospitalized after their nursing home admission. 10.4%
60% better than Texas average

Texas average: 25.9%

Emergency department visits Info Percentage of short-stay residents who had an outpatient emergency department visit. 13.1%
9% worse than Texas average

Texas average: 12.0%

Falls with major injury Info Percentage of SNF residents who experience falls with major injury during their stay. 5.6%
622% worse than Texas average

Texas average: 0.8%

Ability to care for self at discharge Info Percentage of residents at or above expected ability to care for themselves at discharge. 49.1%
9% worse than Texas average

Texas average: 53.7%

Successful return to home or community Info Rate of successful return to home or community from a skilled nursing facility. 45.9%
9% worse than Texas average

Texas average: 50.6%

Penalties and fines

Federal penalties imposed by CMS for regulatory violations, including civil money penalties (fines) and denials of payment for new Medicare/Medicaid admissions.

Source: CMS Penalties Database (Data as of Jan 2026)

Total fines amount $71K
11% lower than Texas average

Texas average: $80K

Number of fines 9
262% more fines than Texas average

Texas average: 2.5

Payment Denials Info Serious action where Medicare and/or Medicaid temporarily stops payments for new residents until issues are fixed. 1
354% more payment denials than Texas average

Texas average: 0.2

Fines amount comparison
This facility $71K
Texas average $80K
Penalty History

Penalties are imposed by CMS for violations of federal nursing home regulations.

Civil Money Penalty Info Fines imposed for noncompliance, which can be assessed per day or per instance of violation. Jun 12, 2025
$23K
Payment Denial Info Serious action where Medicare and/or Medicaid temporarily stops payments for new residents until issues are fixed. Jun 12, 2025
16 days
Civil Money Penalty Info Fines imposed for noncompliance, which can be assessed per day or per instance of violation. Oct 11, 2024
$17K
Civil Money Penalty Info Fines imposed for noncompliance, which can be assessed per day or per instance of violation. Aug 6, 2024
$9K

Last updated: Jan 2026

Guides for Better Senior Living

Care Cost Calculator: See Prices in Your Area

Nursing Home Data Explorer

Don’t Wait Too Long: 7 Red Flag Signs Your Parent Needs Assisted Living Now

The True Cost of Assisted Living in 2025 – And How Families Are Paying For It

Understanding Senior Living Costs: Pricing Models, Discounts & Financial Assistance

Financial Aid for Texas Seniors

Get financial aid guidance

Community Care for the Aged and Disabled (CCAD)

TX Medicaid CCAD

Age 65+ or disabled, Texas resident, Medicaid-eligible, care need (not always nursing home level).

~$2,829/month (300% FBR, individual).

$2,000 (individual), $3,000 (couple).

Large state; rural access challenges.

Texas Community Care Services

TX CCS

Age 60+, Texas resident, at risk of decline.

~$2,000/month (individual, varies).

$5,000 (individual).

Limited funding; high demand in urban areas.

Area Agency on Aging (AAA) Services

Texas AAA Services

Age 60+, TX resident; no income/asset limits.

None; donations encouraged.

Not assessed.

28 AAAs; includes Meals on Wheels in some areas.

Medicare Savings Program (MSP)

Texas Medicare Savings Program

Age 65+ or disabled, TX resident, Medicare Part A/B.

~$2,510/month (QMB), ~$3,380/month (SLMB), ~$3,598/month (QI)—individual.

$9,430 (individual), $14,130 (couple).

Includes Extra Help for Part D; no waitlist.

Low-Income Home Energy Assistance Program (LIHEAP)

Texas Comprehensive Energy Assistance Program (CEAP)

Age 60+ prioritized, TX resident, low-income.

~$3,970/month (185% FPL).

Not assessed.

Priority for elderly/disabled; covers gas, electric, propane.

Family Caregiver Support Program (FCSP)

Texas Family Caregiver Support Program

Caregivers of 60+ needing care or 55+ caregivers of others; TX resident; 2+ ADLs.

No strict cap; prioritizes low-income (~$24,980/year).

Not assessed.

High rural demand; includes grandparent caregivers.

Senior Community Service Employment Program (SCSEP)

Texas SCSEP

Age 55+, unemployed, low-income, TX resident.

~$1,983/month (125% FPL).

Not specified.

Priority for veterans, rural residents; AARP partnership.

VA Aid and Attendance (A&A) and Housebound Benefits

Texas VA Aid and Attendance/Housebound

Age 65+ or disabled veteran/spouse, TX resident, wartime service, ADL help (A&A) or homebound.

Net income < ~$1,984/month (veteran with dependent, A&A); pension offsets income.

~$155,356 (net worth).

High veteran population; supports rural/urban needs.

Property Tax Exemption for Seniors

Texas Senior Property Tax Exemption

Age 65+, TX resident, homeowner (homestead).

None; tax-based eligibility.

Not assessed.

$25,000+ exemption; optional freeze in some counties; saves ~$500-$1,000/year.

Senior Farmers’ Market Nutrition Program (SFMNP)

Texas SFMNP

Age 60+, TX resident, low-income.

~$2,322/month (185% FPL).

Not assessed.

Vouchers (~$50/season); serves ~20,000 via 28 AAAs.

Who we are

Your Senior Care Partner, Every Step of the Way

We help families find affordable senior communities and unlock same day discounts, Medicaid, and Medicare options tailored to your needs.

Contact us Today