John Knox Manor – Retirement Community
Nursing Home, Assisted Living, Home Care, Independent Living, Memory Care, Nursing Care & Palliative Care · Montgomery, AL
CMS overall rating Info CMS (the Centers for Medicare & Medicaid Services) is the federal agency that rates nursing home quality. Its Overall Rating runs from 1 to 5 stars, combining health inspections, staffing, and quality measures, with inspections weighted most heavily.

John Knox Manor – Retirement Community

Nursing Home, Assisted Living, Home Care, Independent Living, Memory Care, Nursing Care & Palliative Care · Montgomery, AL
CMS overall rating Info CMS (the Centers for Medicare & Medicaid Services) is the federal agency that rates nursing home quality. Its Overall Rating runs from 1 to 5 stars, combining health inspections, staffing, and quality measures, with inspections weighted most heavily.
Calculator: See prices in your area
John Knox Manor – Retirement Community accepts Medicaid, Medicare, and private pay.

Overview of John Knox Manor – Retirement Community

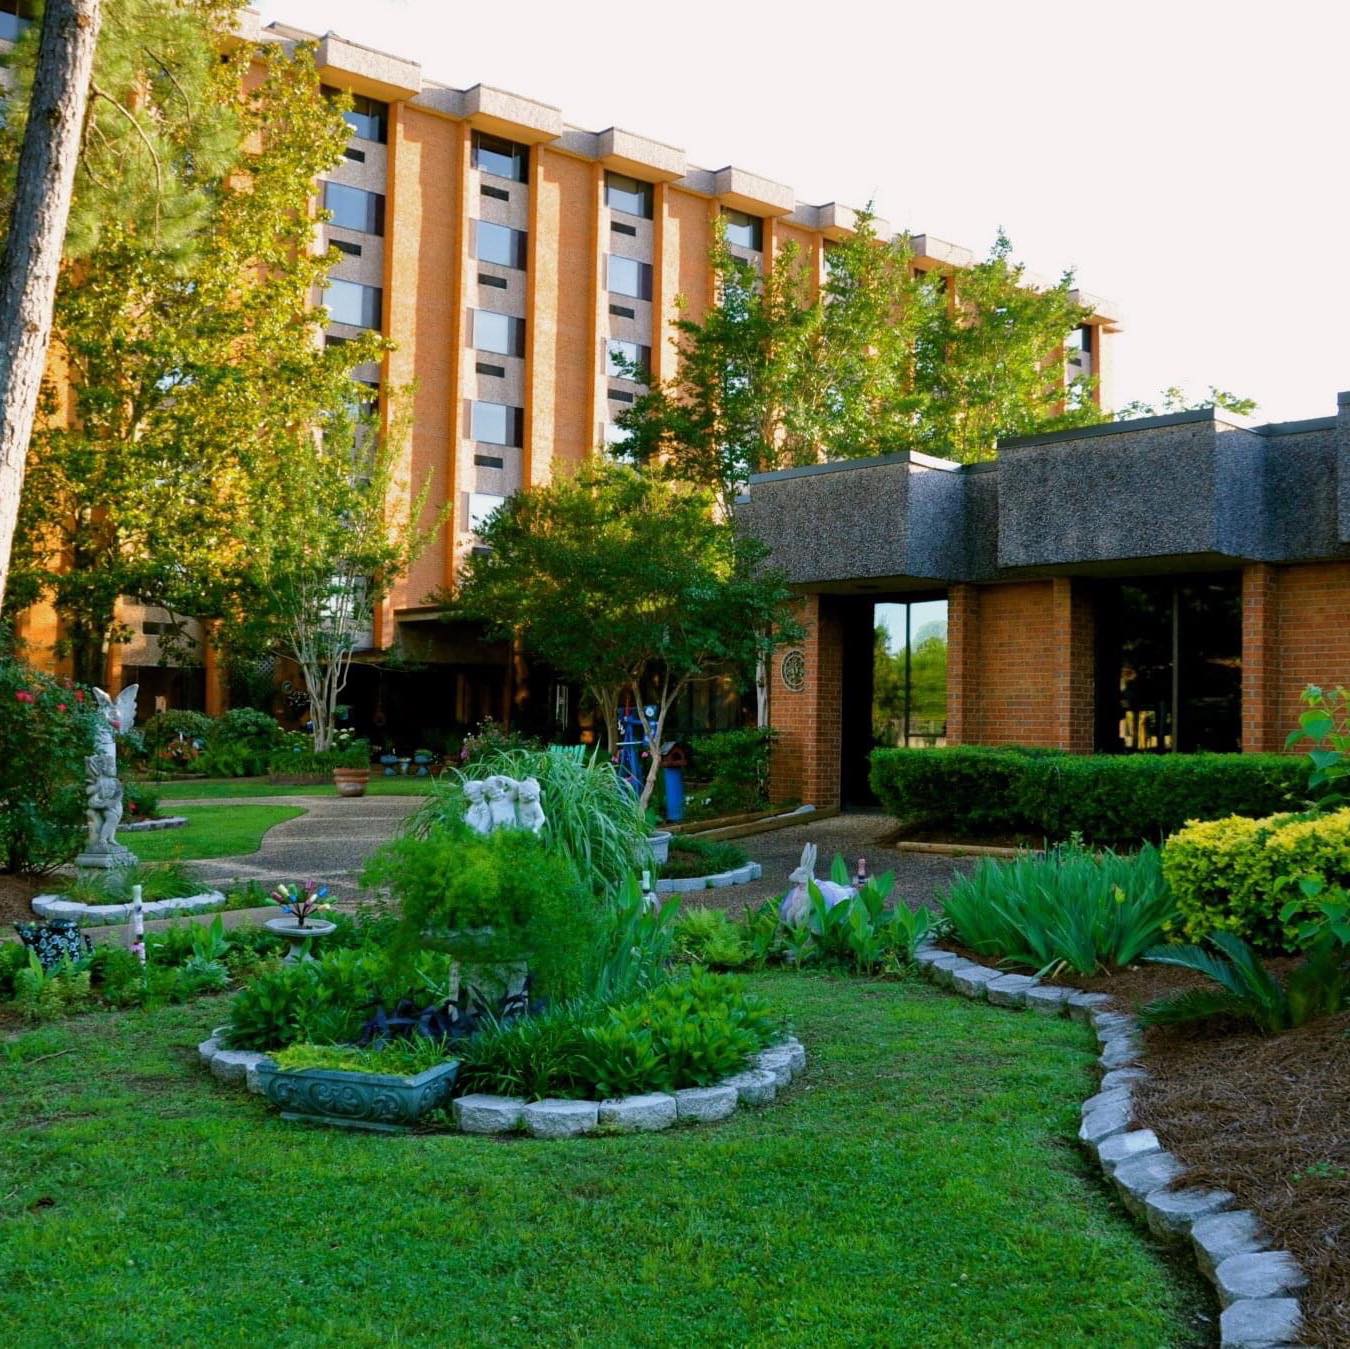
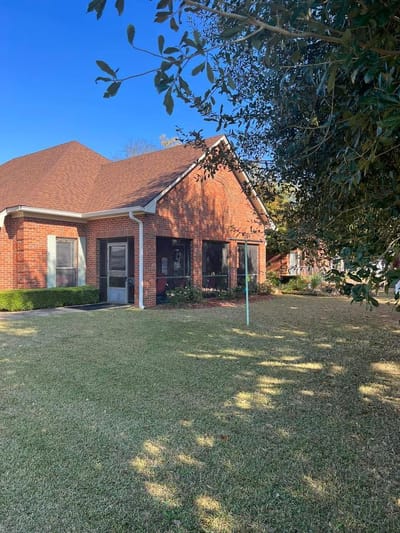
John Knox Manor is the retirement community of the John Knox senior living group; the retirement home creates an atmosphere where seniors maintain an active lifestyle or learn to. The staff is committed to creating a comfortable atmosphere for the residents to build a mutual level of trust and respect among each other. The resident-centered community promotes independence in a warm and welcoming atmosphere. For over 50 years, John Knox Manor has maintained a professional and compassionate level of service over the decades. 
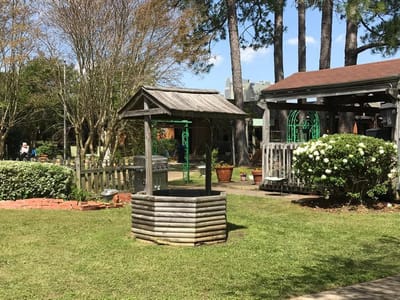
John Knox Manor has provided a community where staff and residents have maintained a well-trusted friendship over the decades. There’s a list of activities in store for the members of the community; to name some of these include an outdoor seating area, an arts and crafts room, a beauty salon, and a barbershop; as well as having complimentary transportation, scheduled outings and events, and weekly housekeeping and linen services. 

Quality ratings

Measured by Centers for Medicare & Medicaid Services (CMS)

Overall rating Info The Overall CMS Rating combines results from health inspections, staffing levels and quality measures. Health inspections carry the most weight. Staffing and quality scores can increase or decrease the final rating based on performance compared to state and national standards.
▼ 66.0% Below AL avg. ▼ 66.0% Below AL avg.AL average: 2.9Click the badge to see the full State ranking.Click here to see the full State ranking.
Health Inspection Info Based on the results of the facility's three most recent standard inspections and any complaint investigations. CMS reviews the number, scope, and severity of deficiencies, with more recent findings weighted more heavily.
▲ 5.9% Above AL avg. ▲ 5.9% Above AL avg.AL average: 2.8Click the badge to see the full State ranking.Click here to see the full State ranking.
Staffing Info Measures average nursing staff hours per resident per day, including Registered Nurses (RNs) and total nursing staff. Ratings are adjusted based on the level of care residents require and are compared to state and national benchmarks.
▼ 71.8% Below AL avg. ▼ 71.8% Below AL avg.AL average: 3.5Click the badge to see the full State ranking.Click here to see the full State ranking.
Quality Measures Info Based on clinical and physical health indicators reported to CMS, such as hospital readmissions, falls, pressure ulcers, and improvements in mobility. These measures reflect how well residents' health needs are being managed.
▼ 66.4% Below AL avg. ▼ 66.4% Below AL avg.AL average: 3.0Click the badge to see the full State ranking.Click here to see the full State ranking.

Staffing hours breakdown

Info Daily nursing hours per resident by staff type, reported to CMS. Higher is generally better — compare this facility to state and national averages to see where staffing stands.

Hours per resident per day — compared to Alabama state averages

Total nursing care / resident Info This home is ranked 22nd out of 136 homes in Alabama for nurse hours. Total adjusted nursing hours per resident per day, combining RN, LPN, and aide time. CMS adjusts this for case-mix so facilities can be fairly compared.
5h 1m per day
Rank #22 / 136Nurse hours — State benchmarkedThis home is ranked 22nd out of 136 homes in Alabama. Shows adjusted nurse hours per resident per day benchmarked to the Alabama average, with a ranking across 136 Alabama facilities. More hours mean more direct care. The national average is about 3.5 hrs; below 3.0 is a red flag.Ranking totals vary by category as each rank only includes facilities that report data for that metric. Homes missing that data point aren't included in the ranking.Click the rank badge to see the full State ranking.Click here to see the full State ranking.
This facility Alabama avg (4h 22m per day)
vs Alabama avg
+15%

0 of 1 metrics below state avg

Standout metric Weekend Total Nursing is +23% above state avg
Staff typeHours / Day / Residentvs state avg
Weekend Total Nursing Info Combined nursing hours (RN + LPN + Nurse Aide) per resident per day on weekends. Staffing often drops on weekends — this figure reveals whether the facility maintains adequate coverage outside of weekday hours. 4h 3m per day ▲ 23% State avg: 3h 18m per day · National avg: 3h 27m per day

Capacity and availability

Avg. Length of Stay
367 days
Bed community size
98-bed community Rank #95 / 245Bed count — State benchmarkedThis home is ranked 95th out of 245 homes in Alabama. Shows this facility's certified or reported bed count compared to other Alabama facilities. Larger communities may offer more amenities, programs, and on-site services for residents and families.Ranking totals vary by category as each rank only includes facilities that report data for that metric. Homes missing that data point aren't included in the ranking.Click the rank badge to see the full State ranking.Click here to see the full State ranking.
A larger shared setting that may offer more common spaces and organized community services.
Walk Score
Walk Score: 34 / 100 Rank #222 / 418Walk Score — State benchmarkedThis home is ranked 222nd out of 418 homes in Alabama. Shows how walkable this facility's neighborhood is compared to the average Walk Score across Alabama facilities. Higher scores benefit residents, families, and staff.Ranking totals vary by category as each rank only includes facilities that report data for that metric. Homes missing that data point aren't included in the ranking.Click the rank badge to see the full State ranking.Click here to see the full State ranking.
Somewhat walkable. A few nearby services may be reachable on foot, but most trips require transportation.

About this community

Occupancy

Occupancy rate
58%
Rank #121 / 138Occupancy rate — State benchmarkedThis home is ranked 121st out of 138 homes in Alabama. Shows this facility's occupancy rate versus the Alabama average, with its Statewide rank out of 138. Higher occupancy signals strong local demand and financial stability.Ranking totals vary by category as each rank only includes facilities that report data for that metric. Homes missing that data point aren't included in the ranking.Click the rank badge to see the full State ranking.Click here to see the full State ranking.
Lower than the Alabama average: 80.8%
Occupied beds
57 / 98
Average occupied beds in Alabama homes 97 beds

License Details

Facility TypeNursing Home
StatusRegular
CountyMontgomery
Business TypeCorporation

Ownership & Operating Entity

John Knox Manor – Retirement Community is administrated by Terri K. Howell.

Type Of Units

SNF (Skilled Nursing)
98 units
Total beds
98 units

Payment & Insurance

2 services
Accept Medicaid
Accept Medicare

Therapy & Rehabilitation

3 services
Rehabilitation Services
Respite Care
Short-Term Rehab

Staffing & Medical

2 services
Doctor on Staff
Licensed Nurses/CNAs

Additional Services

1 service
Home Care

Amenities & Lifestyle

Specific ProgramsCatered Living, Rehab Services

Contact John Knox Manor – Retirement Community

Health Inspection History

Inspections since 2018
Total health inspections 2

Alabama average 2.9


Last Health inspection on Jan 2024

Total health citations
4 Rank #15 / 136Health citations — State benchmarkedThis home is ranked 15th out of 136 homes in Alabama. Shows this facility's total health deficiency citations benchmarked to the Alabama State average, with a ranking across all 136 AL facilities. Lower citation counts earn a better rank.Ranking totals vary by category as each rank only includes facilities that report data for that metric. Homes missing that data point aren't included in the ranking.Click the rank badge to see the full State ranking.Click here to see the full State ranking.

Alabama average 10.4

Citations per inspection
2 Rank #15 / 136Citations per inspection — State benchmarkedThis home is ranked 15th out of 136 homes in Alabama. Shows average deficiency citations per CMS inspection for this facility versus the Alabama mean across 136 facilities with citation data. Lower is better.Ranking totals vary by category as each rank only includes facilities that report data for that metric. Homes missing that data point aren't included in the ranking.Click the rank badge to see the full State ranking.Click here to see the full State ranking.

Alabama average 3.46


Health citations are formal notices following inspections when they fail to comply with safety and care standards.

All 4 citations resulted from standard inspections.

Breakdown of citation severity (last 8 years)
Critical health citations
0
100% better than Alabama average

Alabama average: 0.7


Serious health citations
0
100% better than Alabama average

Alabama average: 0.2

0 critical citations Alabama average: 0.7

0 serious citations Alabama average: 0.2

4 moderate citations Alabama average: 9.1

0 minor citations Alabama average: 0.4
Citations history (last 8 years)
Infection Control moderate citation Jan 04, 2024
Corrected

Nutrition moderate citation Jan 04, 2024
Corrected

Care Planning moderate citation Jan 04, 2024
Corrected

Infection Control moderate citation Nov 08, 2018
Corrected

Staffing Data

Reporting period: October 1 – December 31, 2025 (Q4 2025). Source: CMS Payroll-Based Journal report.

Total staff 109
Employees 93
Contractors 16
Staff to resident ratio 1.88 : 1
20% more staff per resident than Alabama average
Alabama average ratio: 1.56 : 1 Alabama average ratio: 1.56 : 1See full Alabama ranking
Avg staff/day 47
Average shift 7.4 hours
6% worse than Alabama average
Alabama average: 7.9 hours Alabama average shift: 7.9 hoursSee full Alabama ranking
Total staff hours (quarter) 31,875

Nursing staff breakdown

Q4 2025 · Oct 1 – Dec 31 More info This data comes from the CMS Payroll-Based Journal report covering October 1 – December 31, 2025.
Registered Nurse

Manages medical care and health needs.

RN Staff Info All 8 RN Staff are full-time employees. No contractors work on this role. 8
Average shift length Info Average shift length. Calculated as total hours divided by days worked and average staff per day. 7.5 hours
Licensed Practical Nurse

Assists with medical care and medications.

LPN Staff Info All 22 LPN Staff are full-time employees. No contractors work on this role. 22
Average shift length Info Average shift length. Calculated as total hours divided by days worked and average staff per day. 7.5 hours
Certified Nursing Assistant

Helps with daily care and mobility.

CNA Staff Info All 51 CNA Staff are full-time employees. No contractors work on this role. 51
Average shift length Info Average shift length. Calculated as total hours divided by days worked and average staff per day. 7.7 hours

Contractor staffing

Q4 2025 · Oct 1 – Dec 31 More info This data comes from the CMS Payroll-Based Journal report covering October 1 – December 31, 2025.

Total hours from contractors

4.9%

1,572 contractor hours this quarter

Physical Therapy Assistant: 3 Physical Therapy Aide: 3 Respiratory Therapy Technician: 3 Qualified Social Worker: 2 Speech Language Pathologist: 2 Medical Director: 1 Occupational Therapy Aide: 1 Occupational Therapy Assistant: 1

Staff by category

Q4 2025 · Oct 1 – Dec 31 More info This data comes from the CMS Payroll-Based Journal report covering October 1 – December 31, 2025.
Certified Nursing Assistant5105117,39592100%7.7
Licensed Practical Nurse220226,22792100%7.5
Registered Nurse8081,6979199%7.5
Clinical Nurse Specialist3031,4567177%8.3
Mental Health Service Worker3031,1176571%7.5
Administrator2021,0246470%8
Other Dietary Services Staff3038758997%6.2
Nurse Practitioner1015126470%8
Speech Language Pathologist0224708289%3.4
Qualified Social Worker0224247379%5.8
Physical Therapy Assistant0333966368%5.8
Physical Therapy Aide0331102932%3.8
Medical Director011651314%5
Occupational Therapy Aide011521314%4
Respiratory Therapy Technician033332628%1.2
Occupational Therapy Assistant0112233%7.3
51 Certified Nursing Assistant
% of Days 100%
22 Licensed Practical Nurse
% of Days 100%
8 Registered Nurse
% of Days 99%
3 Clinical Nurse Specialist
% of Days 77%
3 Mental Health Service Worker
% of Days 71%
2 Administrator
% of Days 70%
3 Other Dietary Services Staff
% of Days 97%
1 Nurse Practitioner
% of Days 70%
2 Speech Language Pathologist
% of Days 89%
2 Qualified Social Worker
% of Days 79%
3 Physical Therapy Assistant
% of Days 68%
3 Physical Therapy Aide
% of Days 32%
1 Medical Director
% of Days 14%
1 Occupational Therapy Aide
% of Days 14%
3 Respiratory Therapy Technician
% of Days 28%
1 Occupational Therapy Assistant
% of Days 3%

Penalties and fines

Federal penalties imposed by CMS for regulatory violations, including civil money penalties (fines) and denials of payment for new Medicare/Medicaid admissions.

Source: CMS Penalties Database

No penalties in the past 3 years

No civil money penalties or payment denials were reported in the last 3 years.

Quality of care over time

These measures show how residents usually do over time at this home, based on health outcomes and preventive care.

High-risk clinical events score Info A composite score based on pressure ulcers, falls with injury, weight loss, walking ability decline, and activities of daily living decline. 12.2
37% worse than Alabama average

Alabama average: 8.9

Functional decline score Info A composite score based on activities of daily living decline, walking ability decline, and incontinence. 20.7
43% worse than Alabama average

Alabama average: 14.5

Long-stay resident measures
Need for Help with Daily Activities Increased Info Percent of long-stay residents whose need for help with daily activities has increased 24.8%
79% worse than Alabama average

Alabama average: 13.9%

Walking Ability Worsened Info Percent of long-stay residents whose ability to move independently worsened 23.1%
43% worse than Alabama average

Alabama average: 16.1%

Low Risk Residents with Bowel/Bladder Incontinence Info Percent of low risk long-stay residents who lose control of their bowels or bladder 14.0%
In line with Alabama average

Alabama average: 13.6%

Falls with Major Injury Info Percent of long-stay residents experiencing one or more falls with major injury 4.6%
35% worse than Alabama average

Alabama average: 3.4%

High Risk Residents with Pressure Ulcers Info Percent of long-stay high risk residents with pressure ulcers 5.3%
11% better than Alabama average

Alabama average: 5.9%

Urinary Tract Infection Info Percent of long-stay residents with a urinary tract infection 2.1%
21% better than Alabama average

Alabama average: 2.7%

Lost Too Much Weight Info Percent of long-stay residents who lose too much weight 3.1%
44% better than Alabama average

Alabama average: 5.4%

Depressive Symptoms Info Percent of long-stay residents who have depressive symptoms 0.0%
100% better than Alabama average

Alabama average: 1.2%

Antipsychotic Use Info Percent of long-stay residents who received an antipsychotic medication 18.3%
11% better than Alabama average

Alabama average: 20.7%

Pneumococcal Vaccine Info Percent of long-stay residents assessed and appropriately given the pneumococcal vaccine 100.0%
9% better than Alabama average

Alabama average: 91.5%

Influenza Vaccine Info Percent of long-stay residents assessed and appropriately given the seasonal influenza vaccine 100.0%
6% better than Alabama average

Alabama average: 94.8%

Short-stay resident measures
Pneumococcal Vaccine Info Percent of short-stay residents assessed and appropriately given the pneumococcal vaccine 90.2%
8% better than Alabama average

Alabama average: 83.7%

Breakdown by payment type

Medicare

43% of new residents, usually for short-term rehab.

Typical stay 1 - 2 months

Private pay

49% of new residents, often for short stays.

Typical stay 1 years

Medicaid

7% of new residents, often for long-term daily care.

Typical stay 3 years

Facility Characteristics

Source: CMS Long-Term Care Facility Characteristics (Data as of Jan 2026)

Total residents 58
Medicare
4
6.9% of residents
Medicaid
14
24.1% of residents
Private pay or other
40
69% of residents
Programs & Services
Residents Group

Residents meet regularly to discuss policies, care quality, and activities

Active Resident Council

Organized group of residents that meets regularly to discuss facility policies, quality of life, and activities.

Finances and operations

Based on CMS SNF Cost Report for fiscal year ending in 03/2024.

Governmental community
Operated by a subsidized facility district.
Net patient revenue Info Net patient revenue — what the home actually collects for resident care, after contractual allowances, bad debt and discounts are subtracted from its gross charges (CMS cost report, Worksheet G-3). It covers resident care only; money the home earns from other sources is shown separately as "Other income."
$6.5M
Net patient income Info Net patient income: net patient revenue minus the home's total operating expenses. A positive figure means it earns more from resident care than it spends to deliver it; a negative figure means the opposite. It excludes non-operating "other income."
-$324.0K
Governmental community Operated by a subsidized facility district.
Net patient revenue Info Net patient revenue — what the home actually collects for resident care, after contractual allowances, bad debt and discounts are subtracted from its gross charges (CMS cost report, Worksheet G-3). It covers resident care only; money the home earns from other sources is shown separately as "Other income."
$6.5M Rank #108 / 135Revenue — State benchmarkedThis home is ranked 108th out of 135 homes in Alabama. Shows this facility's annual revenue compared to the Alabama average. Higher revenue generally means more resources for staffing and capital — read alongside Payroll %.Ranking totals vary by category as each rank only includes facilities that report data for that metric. Homes missing that data point aren't included in the ranking.Click the rank badge to see the full State ranking.Click here to see the full State ranking.
Net patient income Info Net patient income: net patient revenue minus the home's total operating expenses. A positive figure means it earns more from resident care than it spends to deliver it; a negative figure means the opposite. It excludes non-operating "other income."
-$324.0K
Other income Info Money the home earns outside of resident care — such as investments, grants, rentals and other non-operating sources (CMS cost report, Worksheet G-3). It is tracked separately from net patient revenue: it is not part of that figure, and it is not included in net patient income.
$1.6M
Payroll costs Info Staff salaries plus wage-related costs — benefits such as payroll taxes, health insurance and retirement — from the home's own accounting records (CMS cost report, Worksheet A). Contract or agency labor is counted separately, under other operating costs. Rank #114 / 135Payroll — State benchmarkedThis home is ranked 114th out of 135 homes in Alabama. Shows total annual staff payroll benchmarked to the Alabama average. Higher payroll investment relative to peers often signals better staffing and less reliance on cheaper contract labor.Ranking totals vary by category as each rank only includes facilities that report data for that metric. Homes missing that data point aren't included in the ranking.Click the rank badge to see the full State ranking.Click here to see the full State ranking.
$3.6M 55.6% of net patient revenue Info Payroll as a share of revenue: staff salaries and wage-related benefits divided by net patient revenue. A higher figure means more of each revenue dollar goes to staff pay. Rank #83 / 133Payroll % — State benchmarkedThis home is ranked 83rd out of 133 homes in Alabama. Shows payroll as a percentage of revenue versus the Alabama average. Well-run Alabama facilities typically land around 54–69% — the top third Statewide. Below 25% may signal understaffing or heavy agency use — read with Staffing ratings.Ranking totals vary by category as each rank only includes facilities that report data for that metric. Homes missing that data point aren't included in the ranking.Click the rank badge to see the full State ranking.Click here to see the full State ranking.
Other operating costs Info Everything it costs to run the home apart from payroll — food, utilities, supplies, maintenance, contract labor and administration. Calculated as total operating expense minus payroll (staff salaries and wage-related benefits).
$3.2M
Total costs Info The home's total operating expense for the year — all the costs of running it, salaries included (CMS cost report, Worksheet G-3).
$6.9M

Who this home usually serves

TYPE OF STAY

Mix of rehab and long-term care

This home supports both short-term rehab and long-term care, with residents staying for a wide range of durations.

New residents most often arrive under private pay (49% of admissions), and a typical private pay stay runs around 1 years.

Admissions
67 total

Coverage residents most often arrive under.

Medicare 43%
Private pay 49%
Medicaid 7%
Discharges
57 total

Coverage residents most often leave under.

Medicare 19%
Private pay 72%
Medicaid 9%

Places of interest near John Knox Manor – Retirement Community

Address 5.4 miles from city center Info Estimated distance in miles from Montgomery's city center to John Knox Manor – Retirement Community's address, calculated via Google Maps. — 0.29 miles to nearest hospital (Encompass Health Rehabilitation Hospital of Montgomery)

Calculate Travel Distance to John Knox Manor – Retirement Community

Add your location

Address

Compare Assisted Living around Montgomery

The information below is reported by the Alabama Department of Public Health, Bureau of Health Provider Standards.

John Knox Manor – Retirement Community
AL
HC
IL
MC
NC
PC
NH
Montgomery (Seth Johnson Estates) -
98
Facility 98
AL AVG 90
Rank #95 / 245
-
34
Facility 34
AL AVG 36
Rank #222 / 418
-
Crowne Health Care of Montgomery
AL
MC
NH
RC
Montgomery (Hillcrest) -
185
Facility 185
AL AVG 90
Rank #12 / 245
A+
40
Facility 40
AL AVG 36
Rank #186 / 418
-
Capitol Hill Healthcare in Montgomery
AL
MC
NH
Montgomery -
284
Facility 284
AL AVG 90
Rank #1 / 245
-
60
Facility 60
AL AVG 36
Rank #63 / 418
-
Country Club Estates
AL
NH
IL
Montgomery (Forest Park) -
118
Facility 118
AL AVG 90
Rank #69 / 245
-
49
Facility 49
AL AVG 36
Rank #125 / 418
1 Bed / 2 Bed
Diversicare of Montgomery
AL
HC
MC
NH
Montgomery (Forest Park) -
138
Facility 138
AL AVG 90
Rank #43 / 245
A+
52
Facility 52
AL AVG 36
Rank #101 / 418
-

Financial Assistance for
Assisted Living in Alabama

John Knox Manor – Retirement Community is located in Montgomery, Alabama.
Here are the financial assistance programs available to residents in Alabama.

Get Financial aid guidance

Elderly and Disabled Waiver

Alabama Medicaid E&D Waiver

Age 65+ or disabled
General Alabama resident, Medicaid-eligible, requires nursing home-level care but can live in community with support.
Income Limits (2025) ~$2,829/month 300% FBR, individual
Asset Limits $2,000 (individual), $3,000 (couple) (excludes home, car).
AL

Must be assessed by a nurse for nursing home-level care need.

Benefits
In-home personal care (4-6 hours/day, e.g., bathing, dressing) Respite care (up to 240 hours/year) Adult day care (~$50/day avg.) Home-delivered meals Case management

Alabama Respite for Caregivers Program

Alabama Respite (via NFCSP)

Age Caregiver of someone 60+ (or with dementia)
General Alabama resident.
Income Limits No strict limit; prioritizes low-income.
Asset Limits Not applicable.
AL

Focus on rural caregivers; limited funding.

Benefits
In-home respite (4-6 hours/day) Adult day care (~$50/day) Short-term facility care (up to 5 days)

SenioRx Prescription Assistance Program

AL SenioRx

Age 55+
General Alabama resident, chronic illness requiring daily medication, not fully covered by other drug plans.
Income Limits ~$3,000/month individual, varies by AAA
Asset Limits Not strictly enforced; income-focused.
AL

High ROI; saved $43.5M for 6,825 participants in FY 2022.

Benefits
Prescription cost reduction (avg. $6,300/year savings per participant) Medication management support

Weatherization Assistance Program (WAP)

AL WAP

Age 60+ priority
General Alabama resident, own or rent home, low-income status.
Income Limits (2025) ~$2,510/month 200% of poverty level, individual
Asset Limits Not applicable; income-driven.
AL

Prioritizes seniors and disabled; limited annual funding.

Benefits
Insulation Weather stripping HVAC repairs (avg. $500-$1,000 in annual energy savings)

Section 202 Supportive Housing for the Elderly

AL Section 202

Age 62+
General Alabama resident, very low income, able to live independently with support.
Income Limits (2025) ~$1,500/month 50% of area median income, individual, varies by county
Asset Limits $10,000 individual, excludes home if owned
AL

High demand in urban areas like Birmingham; limited units statewide.

Benefits
Subsidized rent (30% of income, e.g., $300-$500/month) On-site services (housekeeping, transportation, ~$200/month value)

Alabama CARES Program

AL CARES

Age
General Caregivers of Alabama residents aged 60+ needing assistance with 3+ daily activities; no age limit for caregivers.
Income Limits No strict limit; cost-sharing based on recipient’s income e.g., ~$2,500/month threshold
Asset Limits Not applicable; focus on need.
AL

Prioritizes caregivers with greatest economic/social need; complements respite programs like AL Lifespan Respite.

Benefits
Respite care (up to 10 days/year) Counseling (4-6 sessions/year) Training (2-3 workshops/year) Supplemental supplies (e.g., $200/year avg.)

Frequently Asked Questions about John Knox Manor – Retirement Community

What neighborhood is John Knox Manor – Retirement Community in?

John Knox Manor – Retirement Community is in the Seth Johnson Estates neighborhood of Montgomery.

Is John Knox Manor – Retirement Community in a walkable area?

John Knox Manor – Retirement Community has a walk score of 34. Somewhat walkable. A few nearby services may be reachable on foot, but most trips require transportation.

What is the occupancy rate at John Knox Manor – Retirement Community?

John Knox Manor – Retirement Community's occupancy is 58%.

Who is the administrator of John Knox Manor – Retirement Community?

Terri K. Howell is the administrator of John Knox Manor – Retirement Community.

How many beds does John Knox Manor – Retirement Community have?

John Knox Manor – Retirement Community has 98 beds.

Are there photos of John Knox Manor – Retirement Community?

Yes — there are 5 photos of John Knox Manor – Retirement Community in the photo gallery on this page.

What is the phone number of John Knox Manor – Retirement Community?

(334) 288-6462 will put you in contact with the team at John Knox Manor – Retirement Community.

Guides for Better Senior Living

Care Cost Calculator: See Prices in Your Area

Nursing Home Data Explorer

Don’t Wait Too Long: 7 Red Flag Signs Your Parent Needs Assisted Living Now

The True Cost of Assisted Living in 2025 – And How Families Are Paying For It

Understanding Senior Living Costs: Pricing Models, Discounts & Financial Assistance