Nursing Home

Joplin Gardens

Nursing Home

Joplin Gardens

2810 S Jackson Ave, Joplin, MO 64804 View map
Overview of Joplin Gardens

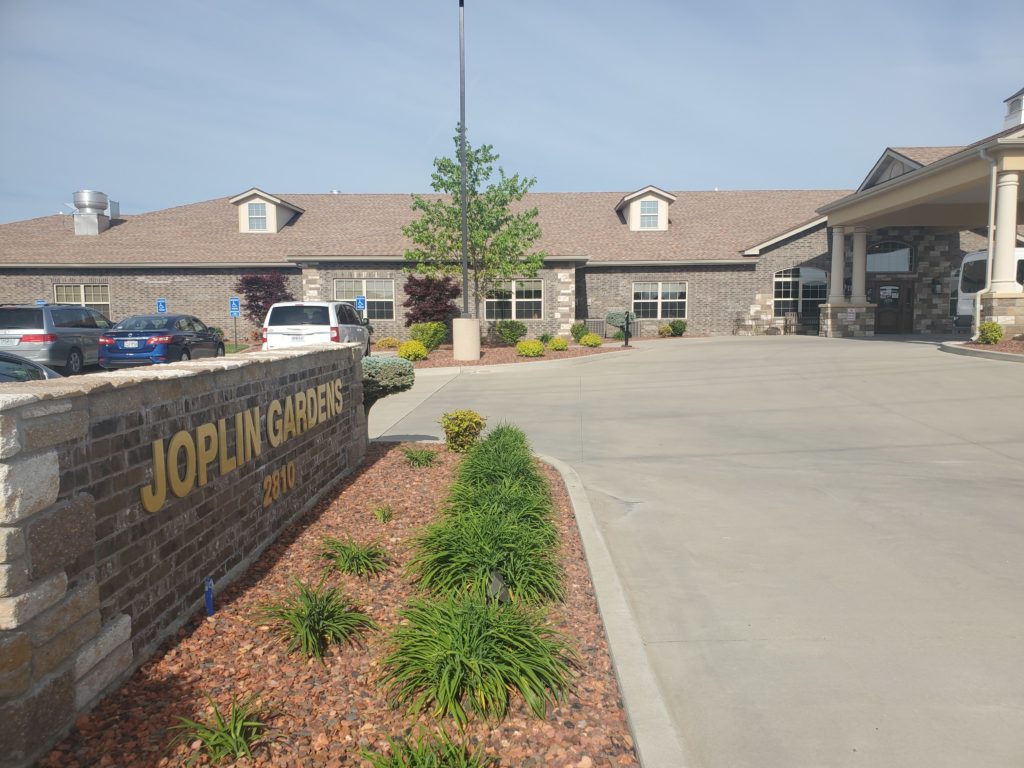
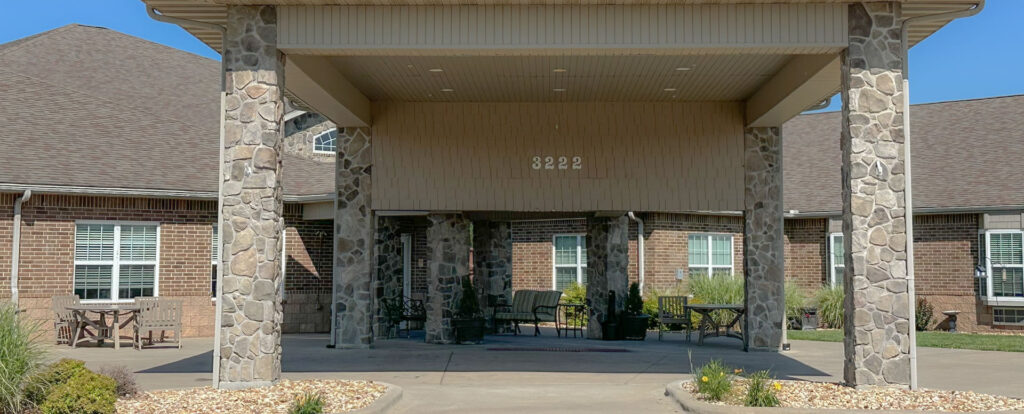
Conveniently set in the neighborhood of Joplin, MO, Joplin Gardens is a compassionate senior living community, offering excellent long-term care services. The community provides round the clock doctors and care teams on-site to make sure residents have access to the services they need to thrive and maintain their health. Snug and spacious accommodations are also offered to make sure residents have a comfortable living space for resting and relaxation.

With access to physical therapy, occupational therapy and speech therapy, residents are bound to maintain their optimal functionality to enjoy their independence. Housekeeping and laundry services are also offered to make sure residents have less chores to worry about and more time for the things they enjoy. At Joplin Gardens, residents are empowered to enjoy a fulfilling living experience.

(417) 572-0041

Quality ratings

Measured by Centers for Medicare & Medicaid Services (CMS)

Overall rating Info Official CMS rating based on health inspections, staffing and quality measures.
2/5
Missouri average: 2.6/5
Health Inspection Info Official CMS rating based on deficiencies found during state health inspections.
3/5
Missouri average: 2.9/5
Staffing Info Official CMS rating based on nurse staffing hours per resident per day.
1/5
Missouri average: 2.2/5
Quality Measures Info Official CMS rating based on clinical outcomes for residents.
2/5
Missouri average: 2.8/5

Nursing care per resident

Info Average daily nursing hours per resident (adjusted for acuity). Higher values indicate more nursing time per resident.
3h 26m per day

This home provides 10% less nursing time per resident than the Missouri average.

Missouri average: 3h 49m per day

Staffing hours breakdown

Info Hours of care per resident per day, broken down by staff type. Data from CMS Medicare.
Staff type Facility State avg National avg
Registered Nurse (RN) Info Registered nurse hours per resident per day. 2m per day 20m per day 29m per day

Capacity and availability

Smaller home

May offer a more intimate, personalized care environment.

Total beds 92

This home usually has availability

Lower occupancy suggests more openings may be available.

Lower demand than the Missouri average
Occupancy rate 67.9%
Residents per day (avg) 71
Occupancy rate
67.9%
Residents per day (avg)
71

Who this home usually serves

TYPE OF STAY

Mostly long-term care residents

Most residents stay for extended periods and receive ongoing daily care.

Might be optimal for
Long-term daily care Ongoing support needs

Breakdown by payment type

Medicare

33% of new residents, usually for short-term rehab.

Typical stay 20 days

Private pay

33% of new residents, often for short stays.

Typical stay 3 - 4 months

Medicaid

34% of new residents, often for long-term daily care.

Typical stay 5 - 6 months

Finances and operations

Privately-owned community
Operated by a business corporation.
Home revenue
$6.0M
Operating loss
-$805.6K
Privately-owned community Operated by a business corporation.
Home revenue
$5,970,868.00
Operating loss
$-805,613.00
Payroll costs Info The portion of the home's budget spent on staff, including nurses, caregivers, and other employees who support care and operations.
$2.8M
47.2% of revenue
Other operating costs Info All remaining costs needed to run the home, such as food, utilities, building maintenance, supplies and administrative expenses.
$4.0M
Total costs $6.8M
Bed community size
92-bed community
A larger shared setting that may offer more common spaces and organized community services.
Walk Score
Walk Score: 48 / 100
Somewhat walkable. A few nearby services may be reachable on foot, but most trips require transportation.

About this community

Occupancy

Occupancy rate
68%
In line with Missouri average
Occupied beds
62 / 92
Average residents 72 per day

License details

Facility type
Snf
County: JASPER

Additional licensing details

CMS Certification Number: 265853

Ownership & operating entity

Joplin Gardens is legally operated by N & R OF JOPLIN, LLC, and administrated by SCHMITT.

Corporate entity: N & R OF JOPLIN, LLC

What does this home offer?

Accepts Medicaid icon

Accept Medicaid: Yes, Accept

Total residents icon

Total Residents: 92 Residents

Building type icon
Building type icon

Building Type: Single-story

Types of Care at Joplin Gardens

Nursing Home
Contact Joplin Gardens

Access & Eligibility

Ways to qualify for care at this community, including accepted programs and payment options.

Medicare Accepted

This facility is certified for eligible Medicare services.

Payment & Funding Options

Medicare

Health Inspection History

Inspections
Total health inspections 6

Missouri average 6.6


Last Health inspection on Jan 2025

Total health citations 21
Citations per inspection
3.5

Health citations are formal notices following inspections when they fail to comply with safety and care standards.

17 of 21 citations resulted from standard inspections; and 4 of 21 resulted from complaint investigations.

Breakdown of citation severity (last 3 years)
Critical Health citations More info 0
100% better than Missouri average

Missouri average: 0.7


Serious Health citations More info 0
100% better than Missouri average

Missouri average: 1

0 critical citations More info Missouri average: 0.7

0 serious citations More info Missouri average: 1

21 moderate citations More info Missouri average: 33.6

0 minor citations More info Missouri average: 1.2
Citations history (last 3 years)
Quality of Care moderate citation Jan 23, 2025
Corrected

Quality of Care moderate citation Jan 23, 2025
Corrected

Infection Control moderate citation Aug 23, 2024
Corrected

Nutrition moderate citation Aug 23, 2024
Corrected

Compare Nursing Homes around Joplin

The information below is reported by the Missouri Department of Health and Senior Services, Division of Regulation and Licensure.
Communities of Wildwood Ranch
SNF

Nursing Home 24/7 care needed

AL

Assisted Living For seniors needing help with daily tasks but not full-time nursing.

MO 64804-1569
120
-
CASCONE, JOHN
90.2%
$15,845,039.00
$5,162,401.00
32.6%
107
4/5
4.1549
5/5
4/5
1/5
13
1
-23%
+11%
+35%
Joplin Gardens
AL

Assisted Living For seniors needing help with daily tasks but not full-time nursing.

IL

Independent Living For self-sufficient seniors seeking community and minimal assistance.

MC

Memory Care Specialized care for those with Memory Loss, Alzheimer's, or dementia, ensuring safety and support.

SNF

Nursing Homes 24/7 care needed

Joplin
92
48
-
67.9%
$5,663,829.00
$2,819,956.00
49.8%
71
2/5
3.4375
3/5
1/5
2/5
21
-
-71%
-8%
+2%
Aspire Senior Living Joplin
SNF

Nursing Homes 24/7 care needed

Carrollton
-
-
-
-
-
-
-
-
-
-
-
-
-
-
-
-
-
-
Autumn Place Residential Care of Joplin
SNF

Nursing Home 24/7 care needed

AL

Assisted Living For seniors needing help with daily tasks but not full-time nursing.

MO 64801-1170
38
-
-
-
-
-
-
-
-
-
-
-
-
-
-
-
-
-
Chapters Living of Joplin
SNF

Nursing Home 24/7 care needed

AL

Assisted Living For seniors needing help with daily tasks but not full-time nursing.

MO 64801-8426
93
-
-
-
-
-
-
-
-
-
-
-
-
-
-
-
-
-

Places of interest near Joplin Gardens

Address 2.3 miles from city center

Address 2810 S Jackson Ave, Joplin, MO 64804

Calculate Travel Distance to Joplin Gardens

Add your location

Address

Staffing Data

Source: CMS Payroll-Based Journal (Q2 2025)

86
Total Staff
72
Employees
14
Contractors
22,658
Total Hours (Quarter)
30
Avg Staff/Day
8.3
Avg Shift (hrs)
Nursing Staff Breakdown
Role Count Avg Shift (hrs) Uses Contractors?
Registered Nurse 2 5.1 No
Licensed Practical Nurse 22 9.3 No
Certified Nursing Assistant 24 8.5 No
Staff by Category
Administration
1 staff
7.7hs shift avg
Nursing Staff
66 staff
8.9hs shift avg
Physicians & Practitioners
2 staff
8.4hs shift avg
Therapy Services
13 staff
5.2hs shift avg
Activities & Recreation
0 staff
0hs shift avg
Social Services
1 staff
2.8hs shift avg
Dietary Services
1 staff
7.4hs shift avg
Other Services
2 staff
7.6hs shift avg
Contractor Analysis
5.4%
of total hours from contractors
1,224 contractor hours this quarter
Qualified Social Worker: 1 Physical Therapy Aide: 3 Speech Language Pathologist: 2 Physical Therapy Assistant: 3 Respiratory Therapy Technician: 3 Occupational Therapy Assistant: 1 Occupational Therapy Aide: 1
Role Employees Contractors Total Staff Total Hours Days Worked % of Days Avg Shift (hrs)
Licensed Practical Nurse 22 0 22 6,951 91 100% 9.3
Certified Nursing Assistant 24 0 24 6,520 91 100% 8.5
Medication Aide/Technician 9 0 9 3,582 91 100% 9.3
Nurse Aide in Training 7 0 7 1,326 66 73% 9
Dental Services Staff 2 0 2 758 64 70% 7.6
Physical Therapy Aide 0 3 3 510 70 77% 6.5
Clinical Nurse Specialist 1 0 1 497 58 64% 8.6
Administrator 1 0 1 478 62 68% 7.7
Dietitian 1 0 1 469 63 69% 7.4
Nurse Practitioner 1 0 1 439 54 59% 8.1
RN Director of Nursing 2 0 2 330 37 41% 7.3
Speech Language Pathologist 0 2 2 296 61 67% 4.8
Physical Therapy Assistant 0 3 3 121 29 32% 4.1
Qualified Social Worker 0 1 1 119 43 47% 2.8
Respiratory Therapy Technician 0 3 3 107 29 32% 3.6
Registered Nurse 2 0 2 86 16 18% 5.1
Occupational Therapy Aide 0 1 1 48 6 7% 8
Occupational Therapy Assistant 0 1 1 23 5 5% 4.6

Facility Characteristics

Source: CMS Long-Term Care Facility Characteristics (Data as of Jan 2026)

Total census
65 residents
Residents by payment source
Medicare
9 residents (13.8%)
Medicaid
35 residents (53.8%)
Private pay or other
21 residents (32.3%)
Programs & Services
Residents' Group

Residents meet regularly to discuss policies, care quality, and activities

Nurse Aide Training

State-approved Nurse Aide Training and Competency Evaluation Program on-site

Active Resident Council

Organized group of residents that meets regularly to discuss facility policies, quality of life, and activities.

Quality of care over time

These measures show how residents usually do over time at this home, based on health outcomes and preventive care.

High-risk clinical events score Info A composite score based on pressure ulcers, falls with injury, weight loss, walking ability decline, and activities of daily living decline. 13.1
20% worse than Missouri average

Missouri average: 10.9

Functional decline score Info A composite score based on activities of daily living decline, walking ability decline, and incontinence. 20.4
In line with Missouri average

Missouri average: 19.5

Long-stay resident measures
Below average Missouri avg: 3.1 Info CMS star rating based on long-stay quality measure performance. 5 stars = significantly above average, 1 star = significantly below average.
Need for Help with Daily Activities Increased Info Percent of long-stay residents whose need for help with daily activities has increased 26.7%
35% worse than Missouri average

Missouri average: 19.8%

Walking Ability Worsened Info Percent of long-stay residents whose ability to move independently worsened 19.9%
In line with Missouri average

Missouri average: 20.6%

Low Risk Residents with Bowel/Bladder Incontinence Info Percent of low risk long-stay residents who lose control of their bowels or bladder 14.5%
20% better than Missouri average

Missouri average: 18.1%

Falls with Major Injury Info Percent of long-stay residents experiencing one or more falls with major injury 10.5%
159% worse than Missouri average

Missouri average: 4.0%

High Risk Residents with Pressure Ulcers Info Percent of long-stay high risk residents with pressure ulcers 4.4%
13% better than Missouri average

Missouri average: 5.0%

Urinary Tract Infection Info Percent of long-stay residents with a urinary tract infection 6.2%
127% worse than Missouri average

Missouri average: 2.7%

Lost Too Much Weight Info Percent of long-stay residents who lose too much weight 4.2%
25% better than Missouri average

Missouri average: 5.6%

Depressive Symptoms Info Percent of long-stay residents who have depressive symptoms 1.5%
88% better than Missouri average

Missouri average: 12.8%

Antipsychotic Use Info Percent of long-stay residents who received an antipsychotic medication 12.0%
45% better than Missouri average

Missouri average: 22.0%

Pneumococcal Vaccine Info Percent of long-stay residents assessed and appropriately given the pneumococcal vaccine 98.3%
15% better than Missouri average

Missouri average: 85.2%

Influenza Vaccine Info Percent of long-stay residents assessed and appropriately given the seasonal influenza vaccine 98.4%
8% better than Missouri average

Missouri average: 90.9%

Hospitalizations per 1,000 days Info Number of hospitalizations per 1,000 long-stay resident days. 1.86
11% better than Missouri average

Missouri average: 2.08

ED visits per 1,000 days Info Number of outpatient emergency department visits per 1,000 long-stay resident days. 3.77
60% worse than Missouri average

Missouri average: 2.35

Short-stay resident measures
Below average Missouri avg: 2.6 Info CMS star rating based on short-stay quality measure performance. 5 stars = much above average, 1 star = much below average.
Pneumococcal Vaccine Info Percent of short-stay residents assessed and appropriately given the pneumococcal vaccine 86.3%
30% better than Missouri average

Missouri average: 66.6%

Antipsychotic medication increase Info Percent of short-stay residents who newly received an antipsychotic medication 1.5%
31% better than Missouri average

Missouri average: 2.2%

Influenza Vaccine Info Percent of short-stay residents assessed and appropriately given the seasonal influenza vaccine 76.1%
20% better than Missouri average

Missouri average: 63.5%

Re-hospitalized after SNF stay Info Percentage of short-stay residents who were re-hospitalized after their nursing home admission. 32.0%
26% worse than Missouri average

Missouri average: 25.3%

Emergency department visits Info Percentage of short-stay residents who had an outpatient emergency department visit. 21.0%
57% worse than Missouri average

Missouri average: 13.4%

Falls with major injury Info Percentage of SNF residents who experience falls with major injury during their stay. 3.2%
310% worse than Missouri average

Missouri average: 0.8%

Ability to care for self at discharge Info Percentage of residents at or above expected ability to care for themselves at discharge. 46.6%
13% worse than Missouri average

Missouri average: 53.7%

Successful return to home or community Info Rate of successful return to home or community from a skilled nursing facility. 55.7%
10% better than Missouri average

Missouri average: 50.6%

Guides for Better Senior Living

Care Cost Calculator: See Prices in Your Area

Nursing Home Data Explorer

Don’t Wait Too Long: 7 Red Flag Signs Your Parent Needs Assisted Living Now

The True Cost of Assisted Living in 2025 – And How Families Are Paying For It

Understanding Senior Living Costs: Pricing Models, Discounts & Financial Assistance

Financial Aid for Missouri Seniors

Get financial aid guidance

Aged and Disabled Waiver

Missouri Medicaid A&D Waiver

Age 65+ or disabled, Missouri resident, Medicaid- eligible, nursing home-level care need.

~$2,829/month (300% FBR, individual).

$2,000 (individual), $3,000 (couple).

Rural access prioritized.

Missouri Supplemental Nursing Care (SNC)

MO SNC

Age 65+, Missouri resident, in approved facility.

~$1,215/month (individual).

$2,000 (individual).

Supplements SSI; facility-based only.

Structured Family Caregiving Waiver (SFCW)

Missouri Structured Family Caregiving Waiver

Age 65+, Missouri resident, MO HealthNet-eligible, NFLOC, dementia diagnosis, live with caregiver.

~$2,901/month (300% FBR, individual); QIT required.

$5,909.25 (individual), $11,818.45 (couple).

Caregiver must be family; small program size.

MO HealthNet Aged, Blind, and Disabled (ABD)

Missouri MO HealthNet ABD

Age 65+ or disabled, Missouri resident, MO HealthNet-eligible, needs help with 1+ ADL.

~$1,690/month (individual, projected); spenddown allowed.

$5,909.25 (individual), $11,818.45 (couple).

Less intensive than waivers; statewide access.

Medicare Savings Program (MSP)

Missouri Medicare Savings Program

Age 65+ or disabled, Missouri resident, Medicare Part A/B.

~$2,510/month (QMB), ~$3,380/month (SLMB), ~$3,598/month (QI)—individual.

$9,430 (individual), $14,130 (couple).

Three tiers; no waitlist; includes Extra Help for Part D.

Missouri Caregiver Program (Customized Caregiver Training & Relief)

Missouri Caregiver Program

Caregivers of 60+ with dementia, Missouri resident, functional needs (2+ ADLs).

No strict cap; prioritizes low-income (~$24,980/year individual).

Not assessed; need-based.

Administered via AAAs and Alzheimer’s Association; rural focus.

Senior Community Service Employment Program (SCSEP)

Missouri SCSEP

Age 55+, unemployed, low-income, Missouri resident.

~$1,983/month (125% FPL).

Not specified; income-focused.

Priority for veterans, rural residents; AARP partnership.

VA Aid and Attendance (A&A) and Housebound Benefits

Missouri VA Aid and Attendance/Housebound

Age 65+ or disabled veteran/spouse, Missouri resident, wartime service, need for ADL help (A&A) or homebound.

Net income < ~$1,984/month (veteran with dependent, A&A); pension offsets income.

~$155,356 (net worth limit).

High veteran demand in rural/urban areas.

Tour Icon
Planning a tour? Check our touring checklist.
Chat Icon
Thinking of living here? We can help you speak to a current resident