Explore Open Rooms

1 Contact details
2 What type of senior care service are you looking for?
3 What budget do you have in mind for senior care?
4 How soon do you need to find care?
5 Additional details

Thank you for your interest!

Our team will be in touch shortly to help with next steps.

Senior Living in Chicago

CMS overall rating Info The Overall CMS Rating combines results from health inspections, staffing levels and quality measures. Health inspections carry the most weight. Staffing and quality scores can increase or decrease the final rating based on performance compared to state and national standards.

Lakefront Nursing & Rehabilitation

7618 N Sheridan Rd, Chicago, IL 60626 View map
Overview of Lakefront Nursing & Rehabilitation

Lakefront Nursing and Rehabilitation Center is a haven where every aspect of care, from skilled nursing to rehabilitation and mental health support, is elevated. Renowned for its unwavering dedication, this cherished institution has become a trusted name in the field. The team of experts who grace its halls possesses advanced degrees, encompassing a wide range of social services and cutting-edge rehabilitation therapies. With an exceptional grasp of essential skills like G-tube feeding, their care knows no bounds. An on-site psychiatric day program, led by a resident psychiatrist, provides a nurturing space for holistic healing. Vocational rehabilitation opportunities abound, empowering residents to reclaim their independence. The administration of IV fluids is executed with meticulous precision, ensuring the utmost comfort and well-being.

The home also fosters a sense of belonging and community. Residents are encouraged to gather outdoors, basking in the joy of shared barbecues and savoring the simple delight of ice cream. Enriching outings bring people together, forging connections that transcend the boundaries of the facility. Every major milestone, including birthdays, is commemorated with heartfelt joy as well. For those seeking spiritual solace, religious services are readily available. Choosing this exceptional home is more than a decision—it’s an affirmation of hope, knowing that loved ones are embraced by a team that surpasses all expectations.

(773) 743-7711

Quality ratings

Measured by Centers for Medicare & Medicaid Services (CMS)

Overall rating Info The Overall CMS Rating combines results from health inspections, staffing levels and quality measures. Health inspections carry the most weight. Staffing and quality scores can increase or decrease the final rating based on performance compared to state and national standards.
5/5
Illinois average: 2.5/5
Health Inspection Info Based on the results of the facility's three most recent standard inspections and any complaint investigations. CMS reviews the number, scope, and severity of deficiencies, with more recent findings weighted more heavily.
4/5
Illinois average: 2.8/5
Staffing Info Measures average nursing staff hours per resident per day, including Registered Nurses (RNs) and total nursing staff. Ratings are adjusted based on the level of care residents require and are compared to state and national benchmarks.
2/5
Illinois average: 2.1/5
Quality Measures Info Based on clinical and physical health indicators reported to CMS, such as hospital readmissions, falls, pressure ulcers, and improvements in mobility. These measures reflect how well residents' health needs are being managed.
5/5
Illinois average: 2.8/5

Nursing care per resident

Info This shows how many total hours of nursing staff time are available per resident each day. Higher numbers usually mean more staff support.
1h 37m per day

This home provides 48% less nursing time per resident than the Illinois average.

Illinois average: 3h 6m per day

Capacity and availability

Smaller home

May offer a more intimate, personalized care environment.

Total beds 99

This home is often near full

That suggests steady demand, but availability may be limited.

Higher demand than most homes in Illinois
Occupancy rate 97.6%
Residents per day (avg) 91
Occupancy rate
97.6%
Residents per day (avg)
91

Who this home usually serves

TYPE OF STAY

Primarily long-term care, limited rehab

Most residents stay long-term, while a smaller portion are admitted for short-term rehab.

Might be optimal for
Long-term residence Daily assistance Occasional rehab needs

Breakdown by payment type

Medicare

3% of new residents, usually for short-term rehab.

Typical stay 1 - 2 months

Private pay

92% of new residents, often for short stays.

Typical stay 3 - 4 months

Medicaid

5% of new residents, often for long-term daily care.

Typical stay 2 - 3 months

Finances and operations

Privately-owned community
Home revenue
$13.0M
Profit
$471.1K
Privately-owned community
Home revenue
$13,049,143.00
Profit
$471,144.00
Payroll costs Info The portion of the home's budget spent on staff, including nurses, caregivers, and other employees who support care and operations.
$3.7M
28.7% of revenue
Other operating costs Info All remaining costs needed to run the home, such as food, utilities, building maintenance, supplies and administrative expenses.
$8.8M
Total costs $12.6M
Walk Score
Walk Score: 83 / 100
Very walkable. Most errands can be accomplished on foot, and many essentials are within a short walk.

About this community

Therapy & Rehabilitation

2 services
Rehabilitation Services
Short-Term Rehab

Staffing & Medical

3 services
Nursing Services
Skilled Nursing
Licensed Nurses/CNAs

Additional Services

2 services
Rehabilitation
Mental Health Programming

Amenities & Lifestyle

2 amenities
Communal Spaces
On-Site Amenities
Specific ProgramsBehavioral Health, Psychiatric Rehabilitation Services, Psychosocial Programs, Rehabilitation

Types of Care at Lakefront Nursing & Rehabilitation

Skilled Nursing
Contact Lakefront Nursing & Rehabilitation

Health Inspection History

Inspections
Total health inspections 6

Illinois average 10.4


Last Health inspection on May 2025

Total health citations 30

Illinois average 36.8

Citations per inspection
5

Illinois average 3.68


Health citations are formal notices following inspections when they fail to comply with safety and care standards.

25 of 30 citations resulted from standard inspections; and 5 of 30 resulted from complaint investigations.

Breakdown of citation severity (last 3 years)
Critical Health citations More info 0
100% better than Illinois average

Illinois average: 0.7


Serious Health citations More info 3
17% better than Illinois average

Illinois average: 3.6

0 critical citations More info Illinois average: 0.7

3 serious citations More info Illinois average: 3.6

24 moderate citations More info Illinois average: 32

3 minor citations More info Illinois average: 0.5
Citations history (last 3 years)
Abuse/Neglect moderate citation Info Issues related to protecting resident's from harm, including abuse, neglect, or mistreatment. May 01, 2025
Corrected

Environmental minor citation Info Issues related to building safety, cleanliness, maintenance, and overall living conditions. May 01, 2025
Corrected

Infection Control moderate citation Info Issues related to preventing and controlling infections, including hygiene practices and safety protocols. May 01, 2025
Corrected

Nutrition moderate citation Info Issues related to food quality, meal service, and resident's nutritional needs. May 01, 2025
Corrected

Compare Senior Living around Chicago The information below is reported by the Illinois Department of Public Health, Office of Health Care Regulation.

Filter by care type
Lakefront Nursing & Rehabilitation
NH

Nursing Home Licensed facility providing 24/7 skilled nursing care for residents with complex, ongoing medical needs. Staffed by RNs, LPNs, and CNAs. Inspected and star-rated annually by CMS. Accepts Medicare (short-term rehab) and Medicaid (long-term care).

Chicago (Rogers Park)
99
No
83
-
0
Montgomery Place
AL

Assisted Living A licensed, long-term care setting for seniors or individuals with disabilities who need help with daily activities — like bathing, dressing, and medication management — but not 24-hour skilled nursing. Offers housing, meals, and around-the-clock support while aiming to maximize resident independence.

HC

Home Care Professional care delivered in the person's own home — from companionship and errands to skilled nursing and therapy. Allows seniors to age in place. Medicare covers skilled home health when medically necessary.

IL

Independent Living Lifestyle-focused communities for older adults offering dining, activities, and transportation with minimal personal care. Best for active, independent seniors who want community without medical support.

MC

Memory Care Secured, specialized care for people living with Alzheimer's or dementia. Staff trained in cognitive impairment, with higher staff-to-resident ratios and an environment designed to reduce confusion and wandering risk.

NH

Nursing Home Licensed facility providing 24/7 skilled nursing care for residents with complex, ongoing medical needs. Staffed by RNs, LPNs, and CNAs. Inspected and star-rated annually by CMS. Accepts Medicare (short-term rehab) and Medicaid (long-term care).

Chicago (East Hyde Park)
40
No
82
A
3

Places of interest near Lakefront Nursing & Rehabilitation

Address 11.4 miles from city center — 6.1 miles to nearest hospital (Ascension Saint Joseph - Chicago)
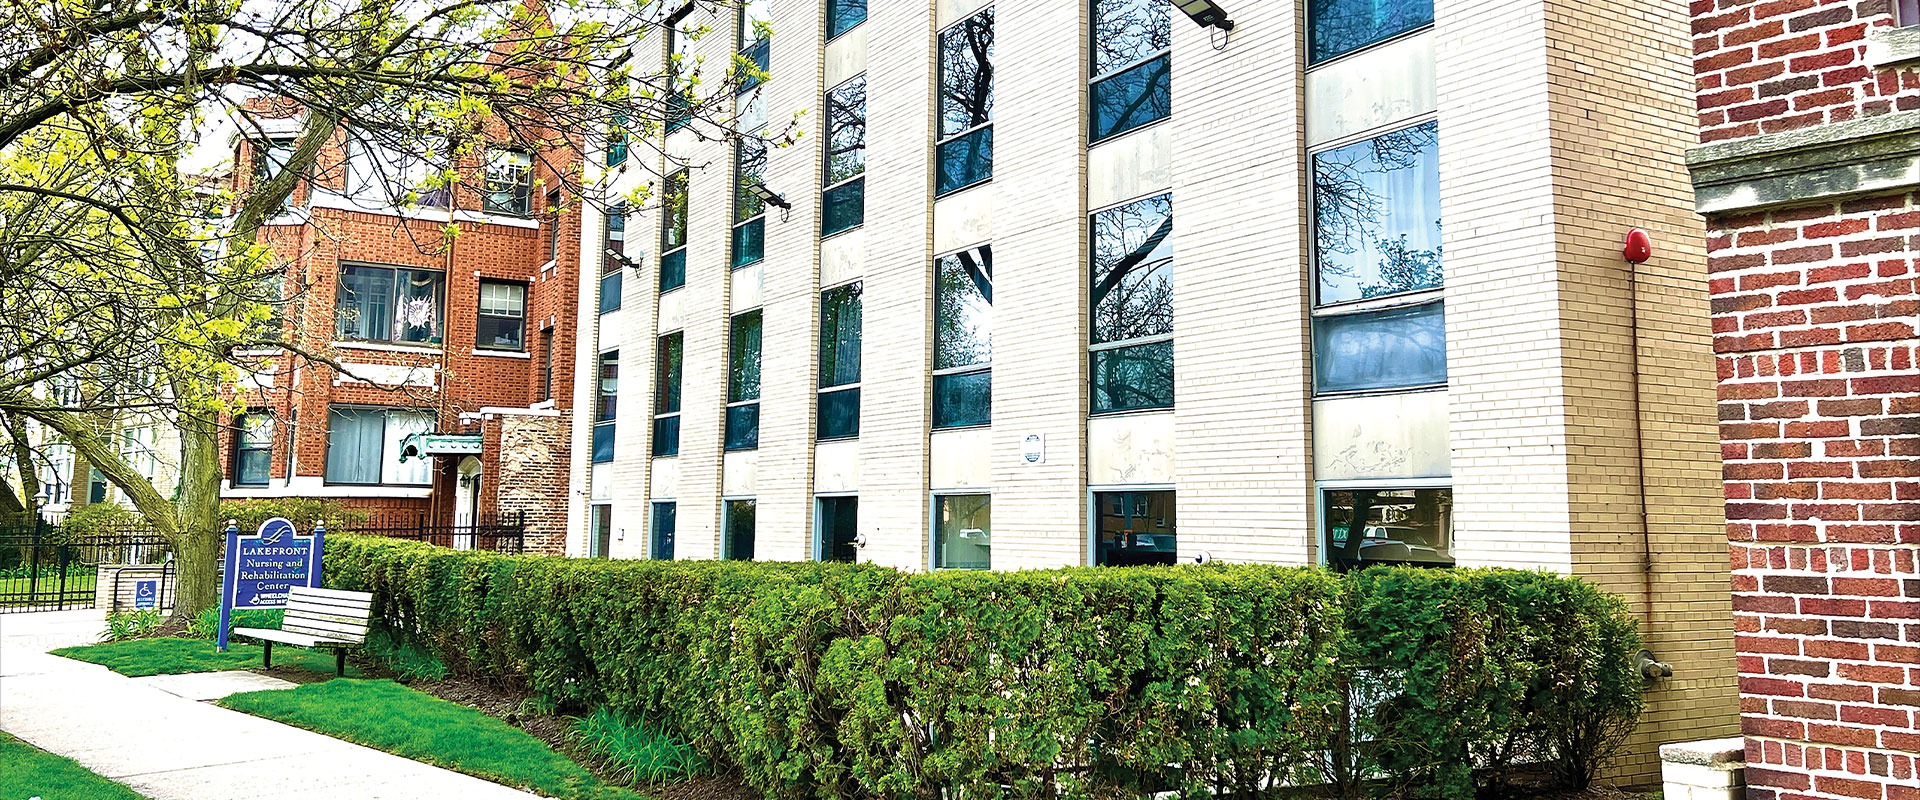
Address 7618 N Sheridan Rd, Chicago, IL 60626

Calculate Travel Distance to Lakefront Nursing & Rehabilitation

Add your location

Address

Staffing Data (Q2 2025)

This data corresponds to Q2 2025 and is based on CMS Payroll-Based Journal.

Total staff 78
Employees 67
Contractors 11
Staff to resident ratio 0.88:1
54% worse than Illinois average

Illinois average ratio: 1.90:1

Avg staff/day 40
Average shift 6.7 hours
12% worse than Illinois average

Illinois average: 7.6 hours

Total staff hours (quarter) 24,550
Nursing staff breakdown
Registered Nurse

Manages medical care and health needs.

Total count 18
Average shift length Info Average shift length. Calculated as total hours divided by days worked and average staff per day. 6.9 hours

No contractors work on this role.

Licensed Practical Nurse

Assists with medical care and medications.

Total count 6
Average shift length Info Average shift length. Calculated as total hours divided by days worked and average staff per day. 7.3 hours

No contractors work on this role.

Certified Nursing Assistant

Helps with daily care and mobility.

Total count 30
Average shift length Info Average shift length. Calculated as total hours divided by days worked and average staff per day. 7.1 hours

No contractors work on this role.

Contractor staffing

Total hours from contractors

3.2%

775 contractor hours this quarter

Respiratory Therapy Technician: 3 Physical Therapy Aide: 3 Physical Therapy Assistant: 2 Qualified Social Worker: 2 Speech Language Pathologist: 1
Staff by category
Certified Nursing Assistant3003012,01391100%7.1
Registered Nurse180184,35191100%6.9
Licensed Practical Nurse6062,47091100%7.3
Other Dietary Services Staff3031,1599099%7.3
Clinical Nurse Specialist3031,0578998%5.7
Dental Services Staff2029148998%5.6
Nurse Practitioner2025108998%5.7
Mental Health Service Worker1014888796%5.6
Speech Language Pathologist0114626470%7.2
RN Director of Nursing1014267886%5.5
Administrator1013867077%5.5
Physical Therapy Assistant0221602730%5.9
Physical Therapy Aide033651415%4.6
Respiratory Therapy Technician033582932%2
Qualified Social Worker022302426%1.3
30 Certified Nursing Assistant
% of Days 100%
18 Registered Nurse
% of Days 100%
6 Licensed Practical Nurse
% of Days 100%
3 Other Dietary Services Staff
% of Days 99%
3 Clinical Nurse Specialist
% of Days 98%
2 Dental Services Staff
% of Days 98%
2 Nurse Practitioner
% of Days 98%
1 Mental Health Service Worker
% of Days 96%
1 Speech Language Pathologist
% of Days 70%
1 RN Director of Nursing
% of Days 86%
1 Administrator
% of Days 77%
2 Physical Therapy Assistant
% of Days 30%
3 Physical Therapy Aide
% of Days 15%
3 Respiratory Therapy Technician
% of Days 32%
2 Qualified Social Worker
% of Days 26%

Facility Characteristics

Source: CMS Long-Term Care Facility Characteristics (Data as of Jan 2026)

Total census
89 residents
Residents by payment source
Medicare
4 residents (4.5%)
Medicaid
85 residents (95.5%)
Programs & Services
Residents' Group

Residents meet regularly to discuss policies, care quality, and activities

Active Resident Council

Organized group of residents that meets regularly to discuss facility policies, quality of life, and activities.

Quality of care over time

These measures show how residents usually do over time at this home, based on health outcomes and preventive care.

High-risk clinical events score Info A composite score based on pressure ulcers, falls with injury, weight loss, walking ability decline, and activities of daily living decline. 3.4
65% better than Illinois average

Illinois average: 9.7

Functional decline score Info A composite score based on activities of daily living decline, walking ability decline, and incontinence. 8.0
57% better than Illinois average

Illinois average: 18.6

Long-stay resident measures
Need for Help with Daily Activities Increased Info Percent of long-stay residents whose need for help with daily activities has increased 5.2%
66% better than Illinois average

Illinois average: 15.5%

Walking Ability Worsened Info Percent of long-stay residents whose ability to move independently worsened 3.0%
84% better than Illinois average

Illinois average: 18.4%

Low Risk Residents with Bowel/Bladder Incontinence Info Percent of low risk long-stay residents who lose control of their bowels or bladder 15.8%
27% better than Illinois average

Illinois average: 21.6%

Falls with Major Injury Info Percent of long-stay residents experiencing one or more falls with major injury 0.9%
74% better than Illinois average

Illinois average: 3.4%

High Risk Residents with Pressure Ulcers Info Percent of long-stay high risk residents with pressure ulcers 1.1%
80% better than Illinois average

Illinois average: 5.3%

Urinary Tract Infection Info Percent of long-stay residents with a urinary tract infection 0.3%
84% better than Illinois average

Illinois average: 1.8%

Lost Too Much Weight Info Percent of long-stay residents who lose too much weight 7.0%
7% worse than Illinois average

Illinois average: 6.5%

Depressive Symptoms Info Percent of long-stay residents who have depressive symptoms 97.5%
103% worse than Illinois average

Illinois average: 48.1%

Antipsychotic Use Info Percent of long-stay residents who received an antipsychotic medication 54.3%
169% worse than Illinois average

Illinois average: 20.2%

Pneumococcal Vaccine Info Percent of long-stay residents assessed and appropriately given the pneumococcal vaccine 90.8%
In line with Illinois average

Illinois average: 89.2%

Influenza Vaccine Info Percent of long-stay residents assessed and appropriately given the seasonal influenza vaccine 93.8%
In line with Illinois average

Illinois average: 91.6%

Short-stay resident measures
Pneumococcal Vaccine Info Percent of short-stay residents assessed and appropriately given the pneumococcal vaccine 33.5%
51% worse than Illinois average

Illinois average: 68.3%

Antipsychotic medication increase Info Percent of short-stay residents who newly received an antipsychotic medication 7.0%
199% worse than Illinois average

Illinois average: 2.3%

Influenza Vaccine Info Percent of short-stay residents assessed and appropriately given the seasonal influenza vaccine 48.9%
22% worse than Illinois average

Illinois average: 63.0%

Penalties and fines

Federal penalties imposed by CMS for regulatory violations, including civil money penalties (fines) and denials of payment for new Medicare/Medicaid admissions.

Source: CMS Penalties Database (Data as of Jan 2026)

Total fines amount $14K
90% lower than Illinois average

Illinois average: $143K

Number of fines 1
66% fewer fines than Illinois average

Illinois average: 3.0

Payment Denials Info Serious action where Medicare and/or Medicaid temporarily stops payments for new residents until issues are fixed. 0
100% fewer payment denials than Illinois average

Illinois average: 1.1

Fines amount comparison
This facility $14K
Illinois average $143K
Penalty History

Penalties are imposed by CMS for violations of federal nursing home regulations.

Civil Money Penalty Info Fines imposed for noncompliance, which can be assessed per day or per instance of violation. Sep 22, 2023
$14K

Last updated: Jan 2026

Guides for Better Senior Living

Care Cost Calculator: See Prices in Your Area

Nursing Home Data Explorer

Don’t Wait Too Long: 7 Red Flag Signs Your Parent Needs Assisted Living Now

The True Cost of Assisted Living in 2025 – And How Families Are Paying For It

Understanding Senior Living Costs: Pricing Models, Discounts & Financial Assistance

Financial Aid for Illinois Seniors

Get financial aid guidance

Community Care Program

Illinois CCP

Age 60+, Illinois resident, at risk of nursing home placement.

~$1,215/month (individual).

$17,500 (individual, excludes home, car).

High demand in urban areas; waitlists possible.

Illinois Respite Program

IL Respite (via NFCSP)

Caregiver of someone 60+ (or with dementia), Illinois resident.

No strict limit; prioritizes low-income.

Not applicable.

Limited slots; urban/rural balance.

Supportive Living Program (SLP)

Illinois Medicaid Supportive Living Program

Age 65+ or 22-64 with disability, Illinois resident, Medicaid-eligible, needs moderate assistance (not nursing home-level).

~$2,829/month (300% FBR, individual); QIT allowed.

$2,000 (individual), $3,000 (couple) (excludes home, car).

~200 SLP sites statewide; room/board not covered.

Persons Who Are Elderly Waiver

Illinois Medicaid Elderly Waiver

Age 65+, Illinois resident, Medicaid-eligible, nursing home-level care need.

~$2,829/month (300% FBR, individual).

$2,000 (individual), $3,000 (couple).

Part of HealthChoice Illinois; consumer-directed options available.

Medicare Savings Program (MSP)

Illinois Medicare Savings Program

Age 65+ or disabled, Illinois resident, Medicare Part A/B.

~$2,510/month (QMB), ~$3,380/month (SLMB), ~$3,598/month (QI)—individual.

$9,430 (individual), $14,130 (couple).

Three tiers; no waitlist.

Senior Community Service Employment Program (SCSEP)

Illinois SCSEP

Age 55+, unemployed, low-income, Illinois resident.

~$1,983/month (125% FPL).

Not specified; income-focused.

Priority for veterans, rural residents.

Optional State Supplementation (OSS)

Illinois Optional State Supplementation

Age 65+ or disabled, Illinois resident, in approved facility, SSI recipient or low-income.

~$1,004/month (including SSI).

$2,000 (individual), $3,000 (couple).

~$50-$500/month based on facility type.

VA Aid and Attendance (A&A) and Housebound Benefits

Illinois VA Aid and Attendance/Housebound

Age 65+ or disabled veteran/spouse, Illinois resident, wartime service, need for ADL help (A&A) or homebound.

Net income < ~$1,984/month (veteran with dependent, A&A); pension offsets income.

~$155,356 (net worth limit).

High veteran demand in urban/rural areas.