Explore Open Rooms

1 Contact details
2 What type of senior care service are you looking for?
3 What budget do you have in mind for senior care?
4 How soon do you need to find care?
5 Additional details

Thank you for your interest!

Our team will be in touch shortly to help with next steps.

Nursing Home

Life Care Center of Port Townsend

Nursing Home

Life Care Center of Port Townsend

751 Kearney St, Port Townsend, WA 98368 View map
Overview of Life Care Center of Port Townsend

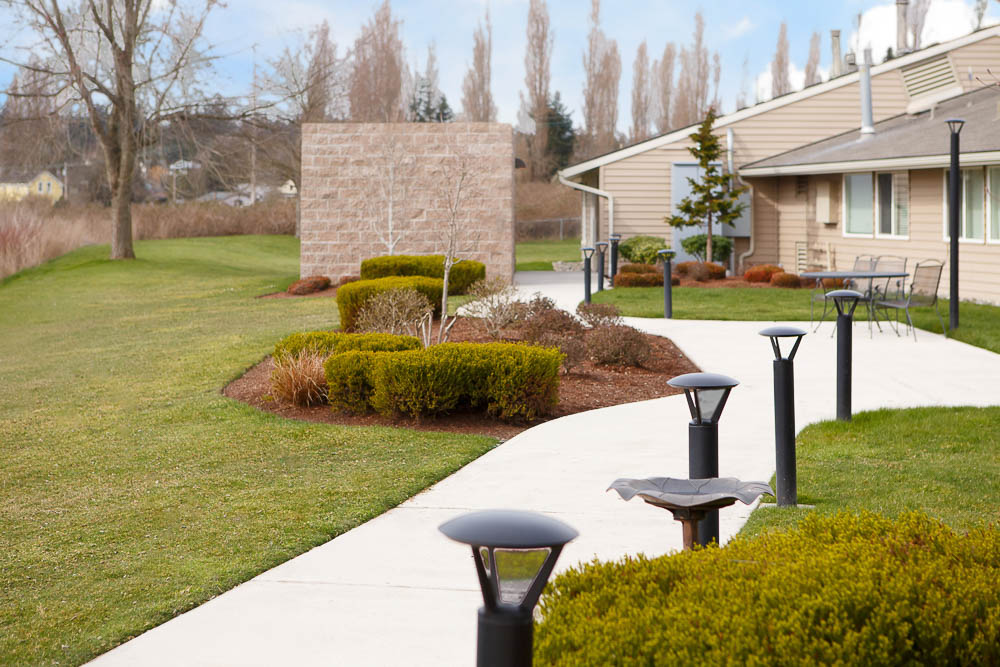
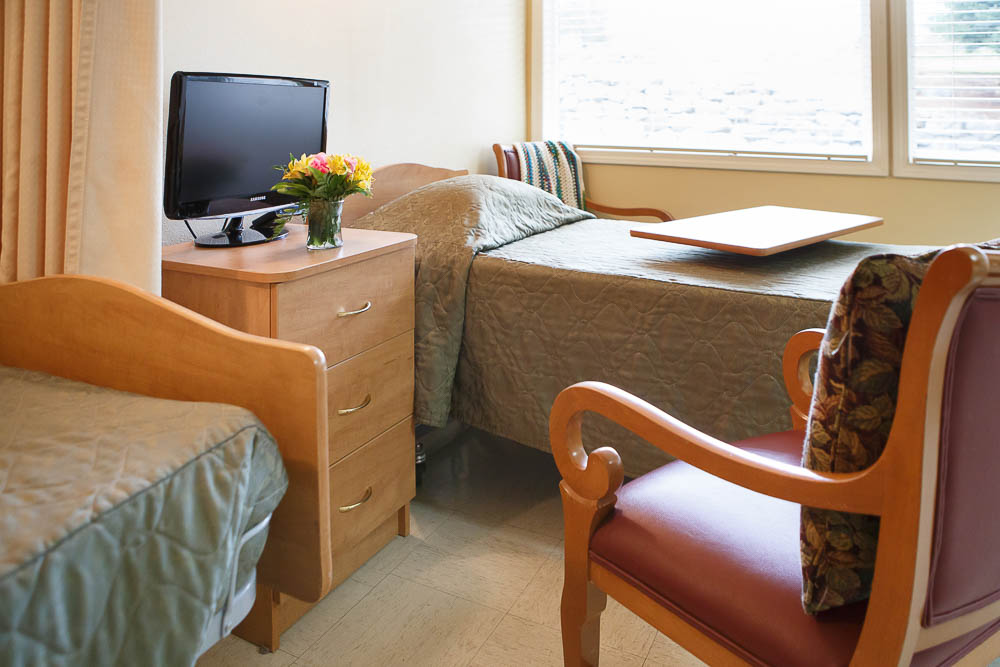
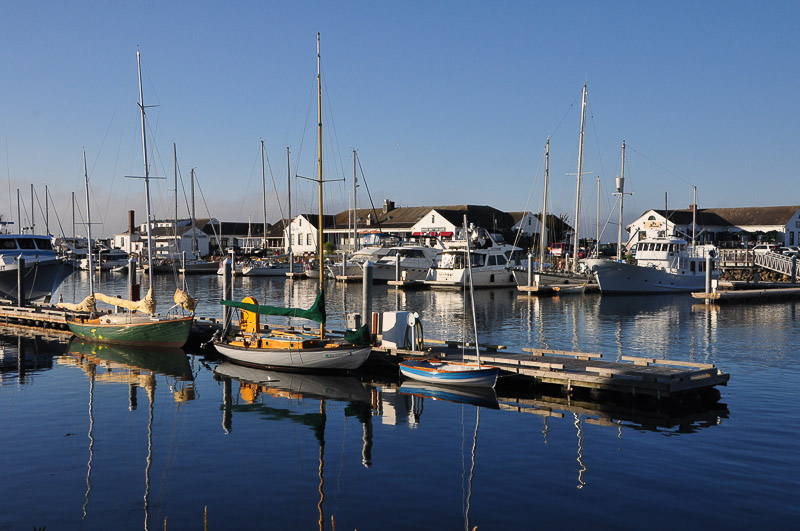
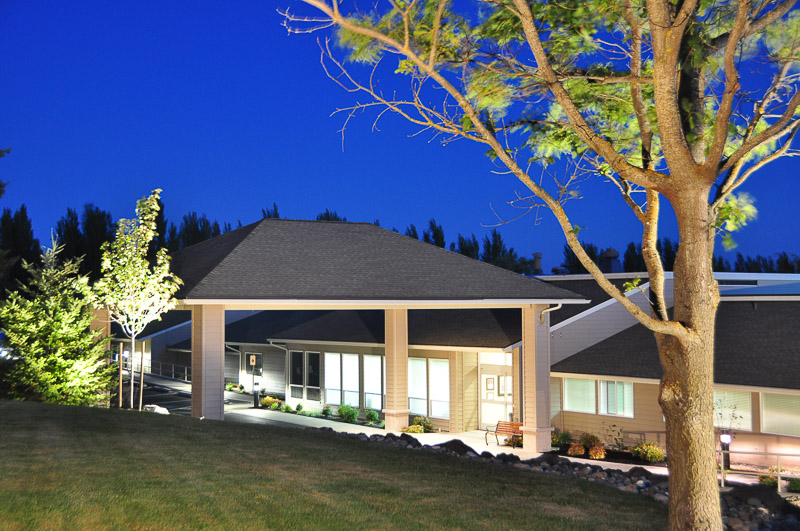
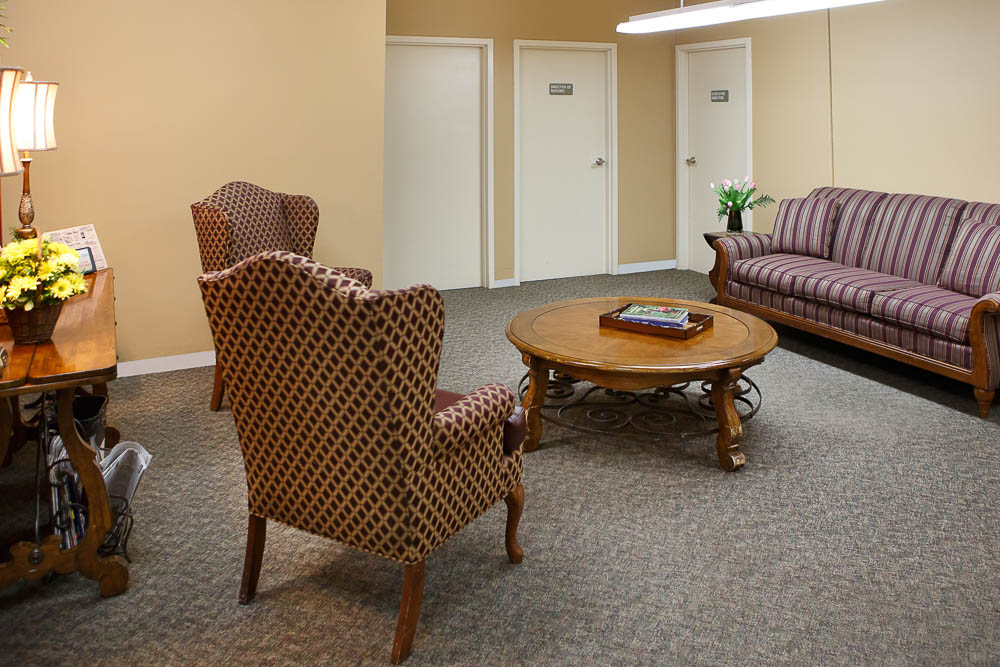
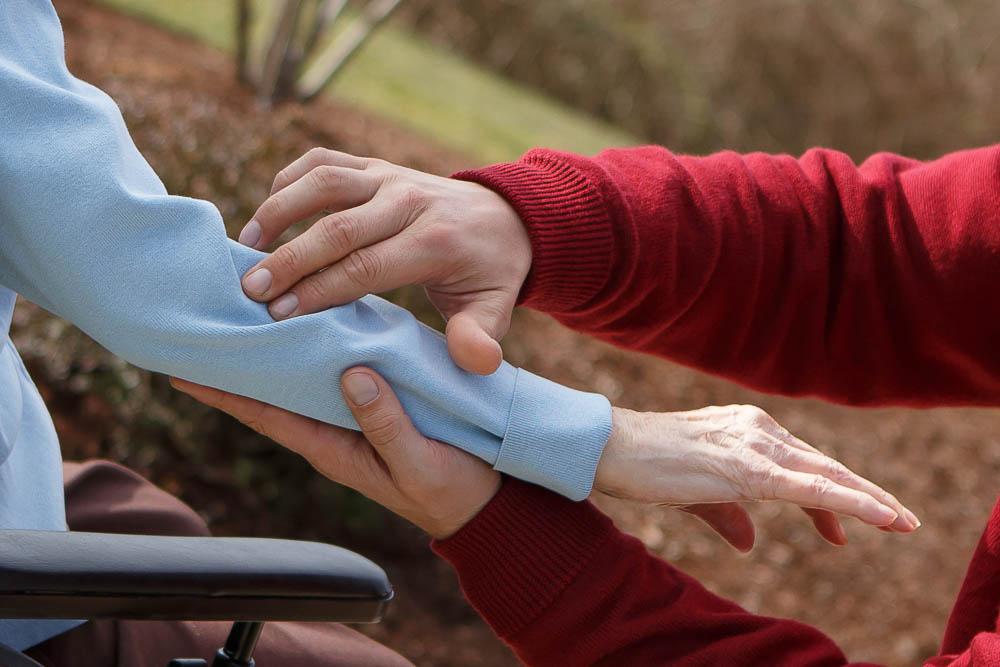
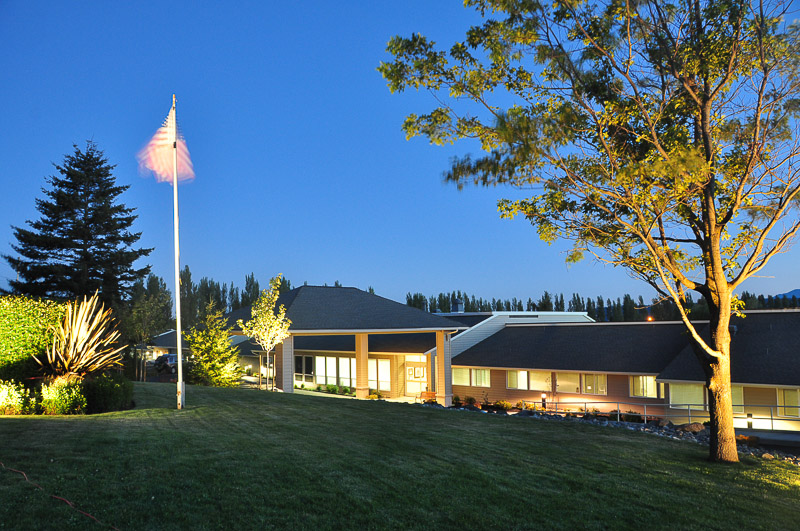
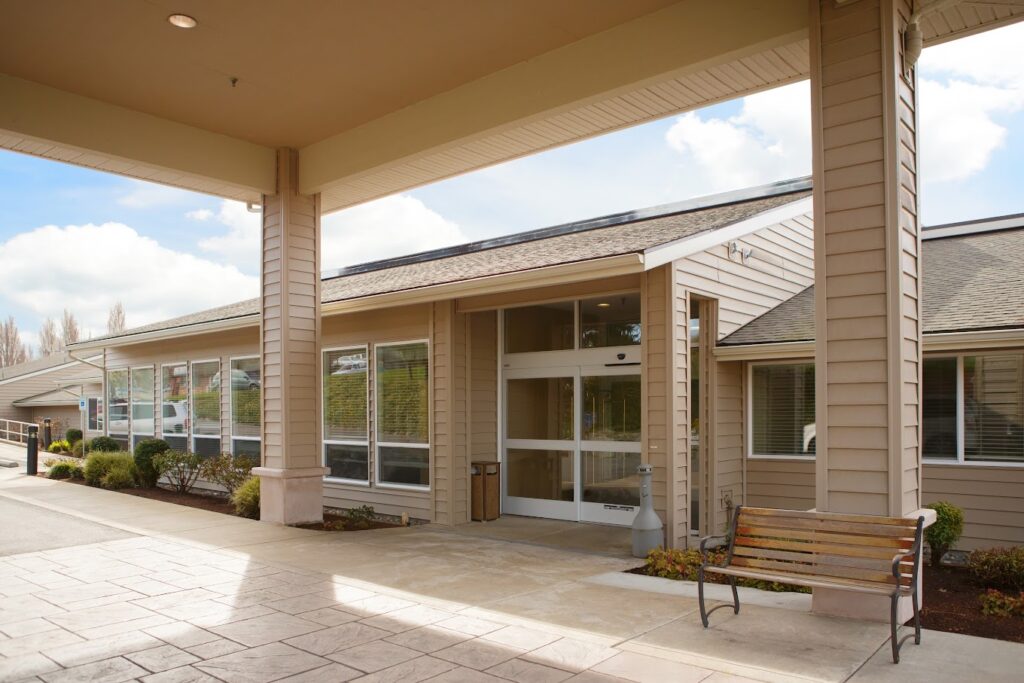
Nestled in the serene beauty of Port Townsend, WA, Life Care Center of Port Townsend overlooks the stunning Kah Tai Lagoon with a backdrop of the Olympic Mountains, offering a peaceful environment for healing and recovery. This welcoming community provides a full range of care services, including skilled nursing, long-term care, and comprehensive inpatient, and outpatient rehabilitation. Here, residents can benefit from private and semi-private accommodations designed for comfort, complemented by individualized treatment plans tailored to support their recovery and independence.

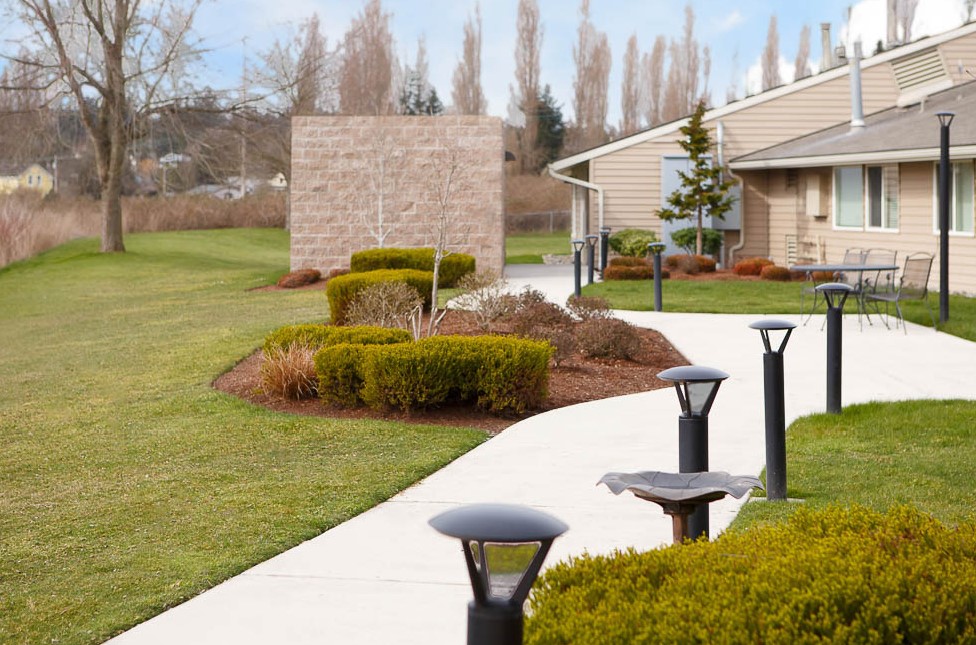
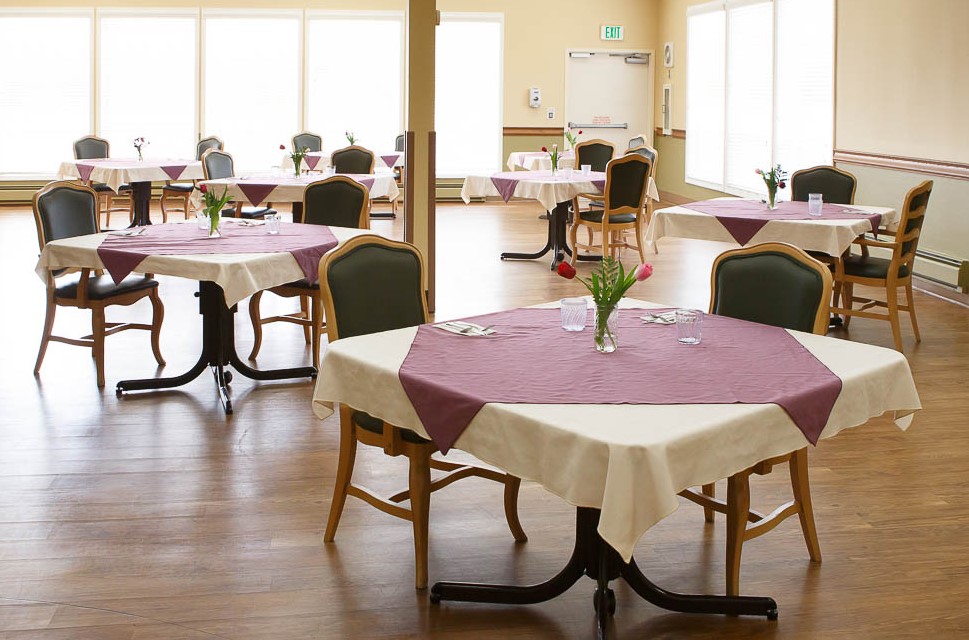
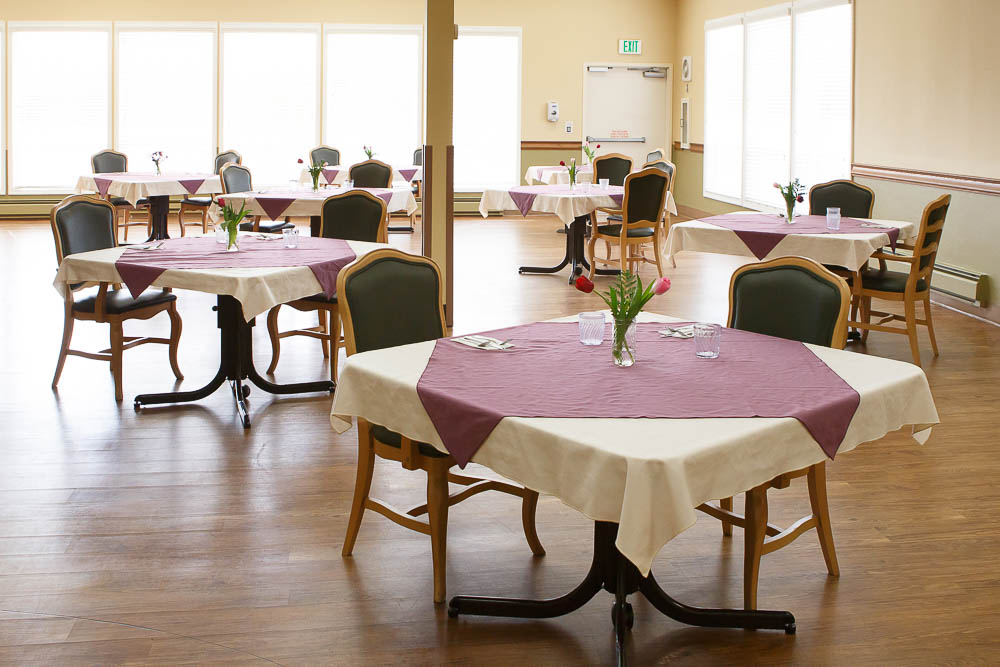
Providing top-of-the-line amenities and services, residents can enjoy delicious and nutritious meals, a library, an onsite beauty salon and barber shop, and beautifully landscaped walking paths. A robust daily activity schedule and wireless internet ensure residents stay connected and engaged. With a compassionate team and a mission to enhance well-being, this community creates an ideal space for healing and growth.

(360) 385-3555

Quality ratings

Measured by Centers for Medicare & Medicaid Services (CMS)

Overall rating Info The Overall CMS Rating combines results from health inspections, staffing levels and quality measures. Health inspections carry the most weight. Staffing and quality scores can increase or decrease the final rating based on performance compared to state and national standards.
5/5
Washington average: 3.5/5
Health Inspection Info Based on the results of the facility's three most recent standard inspections and any complaint investigations. CMS reviews the number, scope, and severity of deficiencies, with more recent findings weighted more heavily.
4/5
Washington average: 2.9/5
Staffing Info Measures average nursing staff hours per resident per day, including Registered Nurses (RNs) and total nursing staff. Ratings are adjusted based on the level of care residents require and are compared to state and national benchmarks.
3/5
Washington average: 3.9/5
Quality Measures Info Based on clinical and physical health indicators reported to CMS, such as hospital readmissions, falls, pressure ulcers, and improvements in mobility. These measures reflect how well residents' health needs are being managed.
5/5
Washington average: 4.1/5

Nursing care per resident

Info This shows how many total hours of nursing staff time are available per resident each day. Higher numbers usually mean more staff support.
3h 59m per day

This home provides 8% less nursing time per resident than the Washington average.

Washington average: 4h 22m per day

Staffing hours breakdown

Info Hours of care per resident per day, broken down by staff type. Data from CMS Medicare.
Staff type Facility State avg National avg
Registered Nurse (RN) Info Registered nurse hours per resident per day. 51m per day 53m per day 41m per day
Nurse Aide Info Nurse aide hours per resident per day. 2h 22m per day 2h 41m per day 2h 21m per day
Total Nursing (Weekend) Info Total number of nurse staff hours per resident per day on weekends. 3h 23m per day 3h 47m per day 3h 26m per day
Physical Therapist Info Physical therapist staff hours per resident per day. 8m per day 5m per day 4m per day
RN (Weekend) Info Registered nurse hours per resident per day on weekends. 43m per day 38m per day 29m per day

Capacity and availability

Smaller home

May offer a more intimate, personalized care environment.

Total beds 94

This home usually has availability

Lower occupancy suggests more openings may be available.

Lower demand than the Washington average
Occupancy rate 41.3%
Residents per day (avg) 42
Occupancy rate
41.3%
Residents per day (avg)
42

Who this home usually serves

TYPE OF STAY

Mostly short-term rehab stays

Most residents typically stay for a few weeks or months before returning home or moving on.

Might be optimal for
Short stays Recovery Medicare-covered care

Breakdown by payment type

Medicare

62% of new residents, usually for short-term rehab.

Typical stay 20 days

Private pay

25% of new residents, often for short stays.

Typical stay 2 months

Medicaid

13% of new residents, often for long-term daily care.

Typical stay 8 - 9 months

Finances and operations

Privately-owned community
Operated by a partnership between two or more business owners.
Home revenue
$7.5M
Operating loss
-$396.3K
Privately-owned community Operated by a partnership between two or more business owners.
Home revenue
$7,475,199.00
Operating loss
$-396,276.00
Payroll costs Info The portion of the home's budget spent on staff, including nurses, caregivers, and other employees who support care and operations.
$2.4M
32.5% of revenue
Other operating costs Info All remaining costs needed to run the home, such as food, utilities, building maintenance, supplies and administrative expenses.
$5.4M
Total costs $7.9M
Walk Score
Walk Score: 64 / 100
Moderately walkable. Some errands can be accomplished on foot, with a mix of nearby amenities.

About this community

Additional licensing details

CMS Certification Number: 505306
Awards: Best Nursing Home - U.S. News & World Report 2026

Safety & Compliance

Emergency Systems: 24-hour security and fire safety systems.

Staffing

Key information about the people who lead and staff this community.

Leadership

Contact: Heather Jeffers, Executive Director

Care Services

Nursing Services
Rehabilitation Services
Skilled Nursing
24-Hour Staffing

Amenities & Lifestyle

24-hour skilled nursing care
beauty salon and barber shop
library
landscaped grounds
walking paths
wireless internet
fine dining program
daily activity schedule
transportation services.

Programs & Activities

Activities
Daily activity schedule available.
Specific Programs
Skilled Nursing, Rehabilitation, Alzheimer's & Dementia Care, Independent & Assisted Living
Religious Services
Yes

Dining & Nutrition

Food Description
Fine dining program with a variety of meal options.

What does this home offer?

Accepts Medicaid icon

Accept Medicaid: Yes, Accept

Total residents icon

Total Residents: 94 Residents

Housing options icon

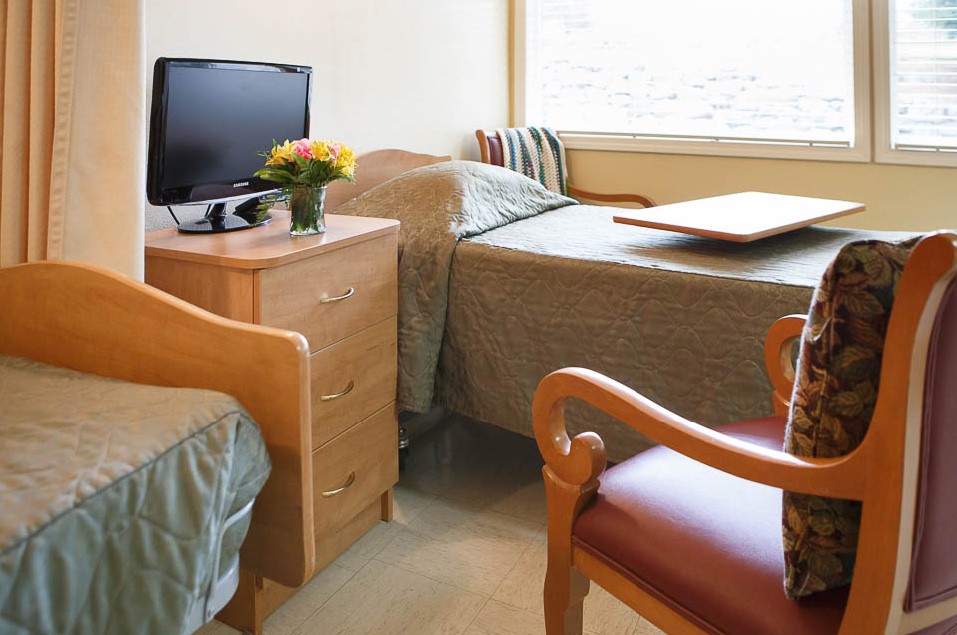
Housing Options: Private / Semi-Private Rooms

Building type icon
Building type icon

Building Type: Single-story

Types of Care at Life Care Center of Port Townsend

Nursing Home
Contact Life Care Center of Port Townsend

Inspection History

In Washington, the Department of Social and Health Services, Residential Care Services conducts unannounced inspections and issues reports on the quality of care in all licensed settings.

5 visits/inspections

1 visits/inspections triggered by complaints

2 routine inspections

Results

5 with issues

0 without issues

Washington average: 8 complaint visits

Washington average: 9 inspections

Latest inspection

Date:April 11, 2025
Type:Annual Inspection

31 deficiencies

Deficiencies indicate regulatory issues. A higher number implies the facility had several areas requiring improvement.

Health Inspection History

Inspections
Total health inspections 5

Washington average 7.8


Last Health inspection on Apr 2025

Total health citations 32

Washington average 48.9

Citations per inspection
6.4

Washington average 6.92


Health citations are formal notices following inspections when they fail to comply with safety and care standards.

29 of 32 citations resulted from standard inspections; and 3 of 32 resulted from complaint investigations.

Breakdown of citation severity (last 3 years)
Critical Health citations More info 1
233% worse than Washington average

Washington average: 0.3


Serious Health citations More info 2
18% worse than Washington average

Washington average: 1.7

1 critical citation More info Washington average: 0.3

2 serious citations More info Washington average: 1.7

27 moderate citations More info Washington average: 46.3

2 minor citations More info Washington average: 0.5
Citations history (last 3 years)
Abuse/Neglect moderate citation Info Issues related to protecting resident's from harm, including abuse, neglect, or mistreatment. Apr 11, 2025
Corrected

Infection Control moderate citation Info Issues related to preventing and controlling infections, including hygiene practices and safety protocols. Apr 11, 2025
Corrected

Nutrition moderate citation Info Issues related to food quality, meal service, and resident's nutritional needs. Apr 11, 2025
Corrected

Pharmacy moderate citation Info Issues related to medication management, including how drugs are stored, administered, and monitored. Apr 11, 2025
Corrected

Compare Nursing Homes around Port Townsend The information below is reported by the Washington Department of Social and Health Services, Residential Care Services.

1 facility compared · CMS & WA Dept. of Health data · Updated Mar 2026

Life Care Center of Port Townsend
AL

Assisted Living A licensed, long-term care setting for seniors or individuals with disabilities who need help with daily activities — like bathing, dressing, and medication management — but not 24-hour skilled nursing. Offers housing, meals, and around-the-clock support while aiming to maximize resident independence.

IL

Independent Living Lifestyle-focused communities for older adults offering dining, activities, and transportation with minimal personal care. Best for active, independent seniors who want community without medical support.

MC

Memory Care Secured, specialized care for people living with Alzheimer's or dementia. Staff trained in cognitive impairment, with higher staff-to-resident ratios and an environment designed to reduce confusion and wandering risk.

NH

Nursing Home Licensed facility providing 24/7 skilled nursing care for residents with complex, ongoing medical needs. Staffed by RNs, LPNs, and CNAs. Inspected and star-rated annually by CMS. Accepts Medicare (short-term rehab) and Medicaid (long-term care).

Port Townsend
94
41.3%
-43%
3.99
+38%
-6%
2
32
3
42
64
Cerna, Angela
$7,5M
$2,4M
32.5%
505306
Private / Semi-Private Rooms

Places of interest near Life Care Center of Port Townsend

Address 0.8 miles from city center

Address 751 Kearney St, Port Townsend, WA 98368

Calculate Travel Distance to Life Care Center of Port Townsend

Add your location

Address

Staffing Data (Q2 2025)

This data corresponds to Q2 2025 and is based on CMS Payroll-Based Journal.

Total staff 74
Employees 41
Contractors 33
Staff to resident ratio 1.90:1
0% compared with Washington average

Washington average ratio: 1.85:1

Avg staff/day 22
Average shift 8.7 hours
7% better than Washington average

Washington average: 8.1 hours

Total staff hours (quarter) 17,324
Nursing staff breakdown
Registered Nurse

Manages medical care and health needs.

Total count 14
Average shift length Info Average shift length. Calculated as total hours divided by days worked and average staff per day. 10.4 hours

This role is partially covered by contractors.

Licensed Practical Nurse

Assists with medical care and medications.

Total count 6
Average shift length Info Average shift length. Calculated as total hours divided by days worked and average staff per day. 8.3 hours

This role is partially covered by contractors.

Certified Nursing Assistant

Helps with daily care and mobility.

Total count 34
Average shift length Info Average shift length. Calculated as total hours divided by days worked and average staff per day. 9.9 hours

This role is partially covered by contractors.

Contractor staffing

Total hours from contractors

27.1%

4,695 contractor hours this quarter

Certified Nursing Assistant: 17 Registered Nurse: 8 Licensed Practical Nurse: 4 Occupational Therapy Aide: 2 Occupational Therapy Assistant: 1 Other Physician: 1
Staff by category
Certified Nursing Assistant1717348,73591100%9.9
Registered Nurse68142,25391100%10.4
Licensed Practical Nurse2461,5128290%8.3
Clinical Nurse Specialist2025226470%7.6
Administrator1015206571%8
Nurse Practitioner1014886268%7.9
Speech Language Pathologist1014716268%7.6
RN Director of Nursing1014685763%8.2
Dietitian1014455864%7.7
Mental Health Service Worker1014194752%8.9
Respiratory Therapy Technician2024105763%7.2
Physical Therapy Aide1013885965%6.6
Qualified Social Worker1013226470%5
Other Dietary Services Staff1011662932%5.7
Physical Therapy Assistant1011122932%3.9
Occupational Therapy Aide02239910%4.3
Other Physician0112933%9.5
Dental Services Staff202171011%1.5
Occupational Therapy Assistant0111122%5.5
34 Certified Nursing Assistant
% of Days 100%
14 Registered Nurse
% of Days 100%
6 Licensed Practical Nurse
% of Days 90%
2 Clinical Nurse Specialist
% of Days 70%
1 Administrator
% of Days 71%
1 Nurse Practitioner
% of Days 68%
1 Speech Language Pathologist
% of Days 68%
1 RN Director of Nursing
% of Days 63%
1 Dietitian
% of Days 64%
1 Mental Health Service Worker
% of Days 52%
2 Respiratory Therapy Technician
% of Days 63%
1 Physical Therapy Aide
% of Days 65%
1 Qualified Social Worker
% of Days 70%
1 Other Dietary Services Staff
% of Days 32%
1 Physical Therapy Assistant
% of Days 32%
2 Occupational Therapy Aide
% of Days 10%
1 Other Physician
% of Days 3%
2 Dental Services Staff
% of Days 11%
1 Occupational Therapy Assistant
% of Days 2%

Facility Characteristics

Source: CMS Long-Term Care Facility Characteristics (Data as of Jan 2026)

Total census
39 residents
Residents by payment source
Medicare
8 residents (20.5%)
Medicaid
22 residents (56.4%)
Private pay or other
9 residents (23.1%)
Programs & Services
Residents' Group

Residents meet regularly to discuss policies, care quality, and activities

Active Resident Council

Organized group of residents that meets regularly to discuss facility policies, quality of life, and activities.

Quality of care over time

These measures show how residents usually do over time at this home, based on health outcomes and preventive care.

High-risk clinical events score Info A composite score based on pressure ulcers, falls with injury, weight loss, walking ability decline, and activities of daily living decline. 8.4
17% better than Washington average

Washington average: 10.0

Functional decline score Info A composite score based on activities of daily living decline, walking ability decline, and incontinence. 20.4
In line with Washington average

Washington average: 20.9

Long-stay resident measures
Significantly above average Washington avg: 3.6 Info CMS star rating based on long-stay quality measure performance. 5 stars = significantly above average, 1 star = significantly below average.
Need for Help with Daily Activities Increased Info Percent of long-stay residents whose need for help with daily activities has increased 11.3%
31% better than Washington average

Washington average: 16.4%

Walking Ability Worsened Info Percent of long-stay residents whose ability to move independently worsened 19.2%
12% better than Washington average

Washington average: 21.8%

Low Risk Residents with Bowel/Bladder Incontinence Info Percent of low risk long-stay residents who lose control of their bowels or bladder 30.7%
26% worse than Washington average

Washington average: 24.3%

Falls with Major Injury Info Percent of long-stay residents experiencing one or more falls with major injury 3.7%
40% worse than Washington average

Washington average: 2.6%

High Risk Residents with Pressure Ulcers Info Percent of long-stay high risk residents with pressure ulcers 3.0%
40% better than Washington average

Washington average: 4.9%

Urinary Tract Infection Info Percent of long-stay residents with a urinary tract infection 0.0%
100% better than Washington average

Washington average: 1.7%

Lost Too Much Weight Info Percent of long-stay residents who lose too much weight 4.8%
18% better than Washington average

Washington average: 5.8%

Depressive Symptoms Info Percent of long-stay residents who have depressive symptoms 7.5%
54% better than Washington average

Washington average: 16.2%

Antipsychotic Use Info Percent of long-stay residents who received an antipsychotic medication 15.0%
In line with Washington average

Washington average: 14.5%

Pneumococcal Vaccine Info Percent of long-stay residents assessed and appropriately given the pneumococcal vaccine 97.8%
In line with Washington average

Washington average: 96.2%

Influenza Vaccine Info Percent of long-stay residents assessed and appropriately given the seasonal influenza vaccine 100.0%
7% better than Washington average

Washington average: 93.8%

Hospitalizations per 1,000 days Info Number of hospitalizations per 1,000 long-stay resident days. 0.89
36% better than Washington average

Washington average: 1.38

ED visits per 1,000 days Info Number of outpatient emergency department visits per 1,000 long-stay resident days. 2.70
79% worse than Washington average

Washington average: 1.51

Short-stay resident measures
Significantly above average Washington avg: 3.6 Info CMS star rating based on short-stay quality measure performance. 5 stars = much above average, 1 star = much below average.
Pneumococcal Vaccine Info Percent of short-stay residents assessed and appropriately given the pneumococcal vaccine 88.6%
In line with Washington average

Washington average: 88.1%

Antipsychotic medication increase Info Percent of short-stay residents who newly received an antipsychotic medication 2.2%
53% worse than Washington average

Washington average: 1.4%

Influenza Vaccine Info Percent of short-stay residents assessed and appropriately given the seasonal influenza vaccine 63.6%
22% worse than Washington average

Washington average: 82.0%

Re-hospitalized after SNF stay Info Percentage of short-stay residents who were re-hospitalized after their nursing home admission. 12.2%
39% better than Washington average

Washington average: 19.9%

Emergency department visits Info Percentage of short-stay residents who had an outpatient emergency department visit. 19.3%
46% worse than Washington average

Washington average: 13.2%

Falls with major injury Info Percentage of SNF residents who experience falls with major injury during their stay. 0.0%
100% better than Washington average

Washington average: 0.8%

Ability to care for self at discharge Info Percentage of residents at or above expected ability to care for themselves at discharge. 58.3%
9% better than Washington average

Washington average: 53.7%

Successful return to home or community Info Rate of successful return to home or community from a skilled nursing facility. 60.2%
19% better than Washington average

Washington average: 50.6%

Penalties and fines

Federal penalties imposed by CMS for regulatory violations, including civil money penalties (fines) and denials of payment for new Medicare/Medicaid admissions.

Source: CMS Penalties Database (Data as of Jan 2026)

Total fines amount $67K
18% lower than Washington average

Washington average: $82K

Number of fines 2
8% more fines than Washington average

Washington average: 1.8

Payment Denials Info Serious action where Medicare and/or Medicaid temporarily stops payments for new residents until issues are fixed. 0
100% fewer payment denials than Washington average

Washington average: 0.3

Fines amount comparison
This facility $67K
Washington average $82K
Penalty History

Penalties are imposed by CMS for violations of federal nursing home regulations.

Civil Money Penalty Info Fines imposed for noncompliance, which can be assessed per day or per instance of violation. Oct 4, 2023
$35K
Civil Money Penalty Info Fines imposed for noncompliance, which can be assessed per day or per instance of violation. Mar 8, 2023
$33K

Last updated: Jan 2026

Guides for Better Senior Living

Care Cost Calculator: See Prices in Your Area

Nursing Home Data Explorer

Don’t Wait Too Long: 7 Red Flag Signs Your Parent Needs Assisted Living Now

The True Cost of Assisted Living in 2025 – And How Families Are Paying For It

Understanding Senior Living Costs: Pricing Models, Discounts & Financial Assistance

Financial Aid for Washington Seniors

Get financial aid guidance

Community Options Program Entry System (COPES)

WA Medicaid COPES

Age 65+ or disabled, Washington resident, Medicaid-eligible, nursing home-level care need.

~$2,829/month (300% FBR, individual).

$2,000 (individual), $3,000 (couple).

High demand in urban areas (e.g., Seattle).

Washington Family Caregiver Support Program

WA NFCSP

Caregiver of someone 60+ (or with dementia), Washington resident.

No strict limit; prioritizes low-income.

Not applicable.

High urban demand; rural outreach.

Community First Choice (CFC)

Washington Community First Choice

Age 65+ (or disabled 18+), WA resident, Medicaid-eligible, need help with 2+ ADLs/IADLs.

~$2,829/month; QIT optional.

$2,000 (individual), $3,000 (couple).

Broader than COPES; serves ~20,000; self-directed option.

Older Americans Act (OAA) Services

Washington OAA Services

Age 60+, WA resident; no income/asset limits.

None; donations encouraged.

Not assessed.

13 AAAs; includes Meals on Wheels; rural focus.

Medicare Savings Program (MSP)

Washington Medicare Savings Program

Age 65+ or disabled, WA resident, Medicare Part A/B.

~$2,510/month (QMB), ~$3,380/month (SLMB), ~$3,598/month (QI)—individual.

$9,430 (individual), $14,130 (couple).

Includes Extra Help for Part D; no waitlist.

Low-Income Home Energy Assistance Program (LIHEAP)

Washington LIHEAP

Age 60+ prioritized, WA resident, low-income household.

~$3,970/month (185% FPL).

Not assessed.

Covers gas, electric, wood; emergency aid available.

Senior Community Service Employment Program (SCSEP)

Washington SCSEP

Age 55+, unemployed, low-income, WA resident.

~$1,983/month (125% FPL).

Not specified.

Priority for veterans, rural residents; AARP partnership.

VA Aid and Attendance (A&A) and Housebound Benefits

Washington VA Aid and Attendance/Housebound

Age 65+ or disabled veteran/spouse, WA resident, wartime service, ADL help (A&A) or homebound.

Net income < ~$1,984/month (veteran with dependent, A&A); pension offsets income.

~$155,356 (net worth).

High veteran use; supports rural/urban needs.

Senior Citizens Property Tax Exemption

Washington Senior Property Tax Exemption

Age 61+ or disabled retiree, WA resident, homeowner, income-based.

~$45,000-$70,000/year (varies by county, e.g., King: $70,000).

Not assessed; home value cap varies (~$250,000-$400,000).

Saves ~$500-$1,500/year; offered statewide.

Senior Farmers’ Market Nutrition Program (SFMNP)

Washington SFMNP

Age 60+, WA resident, low-income.

~$2,322/month (185% FPL).

Not assessed.

Vouchers (~$80/season); serves ~20,000 via AAAs.