Explore Open Rooms

1 Contact details
2 What type of senior care service are you looking for?
3 What budget do you have in mind for senior care?
4 How soon do you need to find care?
5 Additional details

Thank you for your interest!

Our team will be in touch shortly to help with next steps.

Nursing Home

Livingston Health and Rehab Center

Nursing Home

Livingston Health and Rehab Center

510 S 14th St, Livingston, MT 59047 View map
Overview of Livingston Health and Rehab Center

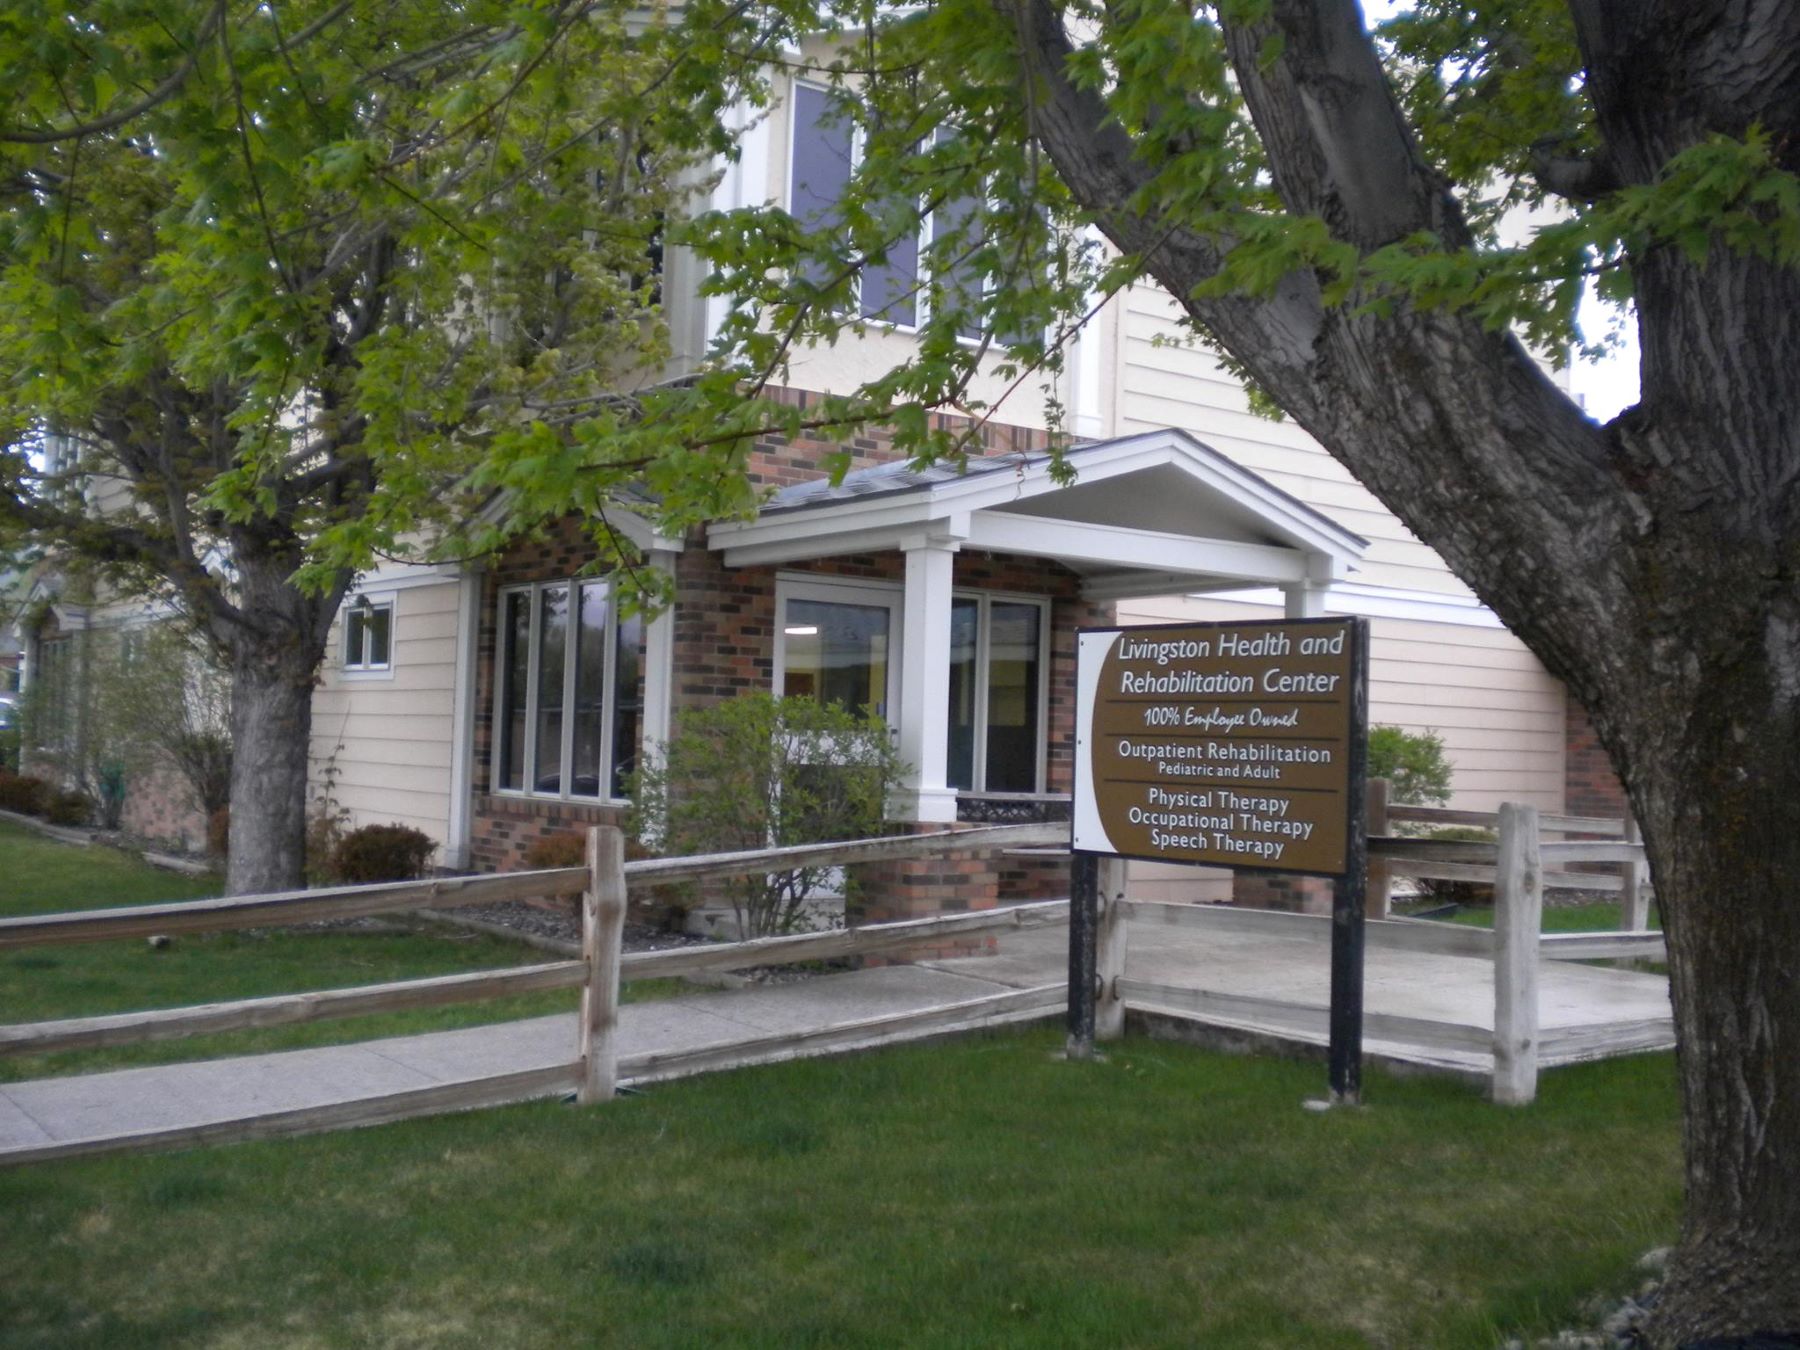
Located within the picturesque landscapes of Bozeman, Montana, Livingston Health and Rehab Center stands as a compassionate assisted living community surrounded by the beauty of four magnificent mountain range. Whether seeking short-term rehabilitation or long-term support, their dedicated team focuses on aiding recovery and facilitating a seamless return to familiar surroundings.

Here, they provide a vital link between hospital care and the comforts of home. Their comprehensive services encompass a spectrum of care, including 24-hour skilled nursing, rehabilitation therapy, post-acute care, long-term support, respite stays, hospice programs, and additional supplementary services. With a commitment to enhancing lives, Livingston Health and Rehab Center also extend outpatient therapy for individuals who have transitioned from inpatient care.

Quality ratings

Measured by Centers for Medicare & Medicaid Services (CMS)

Overall rating Info The Overall CMS Rating combines results from health inspections, staffing levels and quality measures. Health inspections carry the most weight. Staffing and quality scores can increase or decrease the final rating based on performance compared to state and national standards.
1/5
Montana average: 2.8/5
Health Inspection Info Based on the results of the facility's three most recent standard inspections and any complaint investigations. CMS reviews the number, scope, and severity of deficiencies, with more recent findings weighted more heavily.
1/5
Montana average: 2.6/5
Staffing Info Measures average nursing staff hours per resident per day, including Registered Nurses (RNs) and total nursing staff. Ratings are adjusted based on the level of care residents require and are compared to state and national benchmarks.
3/5
Montana average: 2.9/5
Quality Measures Info Based on clinical and physical health indicators reported to CMS, such as hospital readmissions, falls, pressure ulcers, and improvements in mobility. These measures reflect how well residents' health needs are being managed.
2/5
Montana average: 3.0/5

Nursing care per resident

Info This shows how many total hours of nursing staff time are available per resident each day. Higher numbers usually mean more staff support.
3h 50m per day

This home provides 2% less nursing time per resident than the Montana average.

Montana average: 3h 54m per day

Staffing hours breakdown

Info Hours of care per resident per day, broken down by staff type. Data from CMS Medicare.
Staff type Facility State avg National avg
Registered Nurse (RN) Info Registered nurse hours per resident per day. 39m per day 56m per day 41m per day
Nurse Aide Info Nurse aide hours per resident per day. 2h 2m per day 2h 32m per day 2h 21m per day
Total Nursing (Weekend) Info Total number of nurse staff hours per resident per day on weekends. 2h 58m per day 3h 29m per day 3h 26m per day
Physical Therapist Info Physical therapist staff hours per resident per day. 6m per day 4m per day 4m per day
RN (Weekend) Info Registered nurse hours per resident per day on weekends. 29m per day 41m per day 29m per day

Capacity and availability

Medium-capacity home

Offers a balance of services and community atmosphere.

Total beds 115

This home usually has availability

Lower occupancy suggests more openings may be available.

Lower demand than the Montana average
Occupancy rate 38.3%
Residents per day (avg) 47
Occupancy rate
38.3%
Residents per day (avg)
47

Who this home usually serves

TYPE OF STAY

Mostly short-term rehab stays

Most residents typically stay for a few weeks or months before returning home or moving on.

Might be optimal for
Short stays Recovery Medicare-covered care

Breakdown by payment type

Medicare

64% of new residents, usually for short-term rehab.

Typical stay 1 - 2 months

Private pay

29% of new residents, often for short stays.

Typical stay 2 - 3 months

Medicaid

7% of new residents, often for long-term daily care.

Typical stay 10 - 11 years

Finances and operations

Privately-owned community
Home revenue
$1.9M
Operating loss
-$463.1K
Privately-owned community
Home revenue
$1,876,744.00
Operating loss
$-463,084.00
Payroll costs Info The portion of the home's budget spent on staff, including nurses, caregivers, and other employees who support care and operations.
$582.1K
31% of revenue
Other operating costs Info All remaining costs needed to run the home, such as food, utilities, building maintenance, supplies and administrative expenses.
$1.8M
Total costs $2.3M
Bed community size
115-bed community
A larger shared setting that may offer more common spaces and organized community services.
Years in operation
2 years in operation
A newer community that may feature more recent facilities and programs.
Walk Score
Walk Score: 64 / 100
Moderately walkable. Some errands can be accomplished on foot, with a mix of nearby amenities.

About this community

Occupancy

Occupancy rate
38%
In line with Montana average
Occupied beds
44 / 115
Average residents 55 per day

License details

Facility type
Long Term Care
Status Current
Issuance February 29, 2024
Expiration February 28, 2027

Additional licensing details

License number: 95

Ownership & operating entity

Livingston Health and Rehab Center is administrated by Bake, Darren.

Type Of Units

Secured Beds
115 units
Total beds
115 units

Types of Care at Livingston Health and Rehab Center

Skilled Nursing Memory Care Respite Care
Contact Livingston Health and Rehab Center

Inspection History

In Montana, the Department of Public Health and Human Services, Quality Assurance Division is the state body responsible for inspecting and licensing all senior residential care facilities.

5 visits/inspections

3 visits/inspections triggered by complaints

2 routine inspections

Results

5 with issues

0 without issues

Latest inspection

Date:November 18, 2025
Type:Complaint Investigation

42 deficiencies

Deficiencies indicate regulatory issues. A higher number implies the facility had several areas requiring improvement.

Health Inspection History

Inspections
Total health inspections 4

Montana average 5.1


Last Health inspection on Jun 2025

Total health citations 33

Montana average 29.7

Citations per inspection
8.25

Montana average 5.72


Health citations are formal notices following inspections when they fail to comply with safety and care standards.

19 of 33 citations resulted from standard inspections; 12 of 33 resulted from complaint investigations; and 2 of 33 came from combined inspections (standard and complaint).

Breakdown of citation severity (last 3 years)
Critical Health citations More info 0
100% better than Montana average

Montana average: 0.3


Serious Health citations More info 2
9% better than Montana average

Montana average: 2.2

0 critical citations More info Montana average: 0.3

2 serious citations More info Montana average: 2.2

31 moderate citations More info Montana average: 26.5

0 minor citations More info Montana average: 0.7
Citations history (last 3 years)
Infection Control moderate citation Info Issues related to preventing and controlling infections, including hygiene practices and safety protocols. Jun 05, 2025
Corrected

Infection Control moderate citation Info Issues related to preventing and controlling infections, including hygiene practices and safety protocols. Jun 05, 2025
Corrected

Pharmacy moderate citation Info Issues related to medication management, including how drugs are stored, administered, and monitored. Jun 05, 2025
Corrected

Quality of Care moderate citation Info Issues related to how well residents receive appropriate treatment and support for their medical and daily care needs. Jun 05, 2025
Corrected

Compare Nursing Homes around Bozeman The information below is reported by the Montana Department of Public Health and Human Services, Quality Assurance Division.

2 facilities compared · CMS & MT Dept. of Health data · Updated Mar 2026

Gallatin Rest Home
NH

Nursing Home Licensed facility providing 24/7 skilled nursing care for residents with complex, ongoing medical needs. Staffed by RNs, LPNs, and CNAs. Inspected and star-rated annually by CMS. Accepts Medicare (short-term rehab) and Medicaid (long-term care).

AL

Assisted Living A licensed, long-term care setting for seniors or individuals with disabilities who need help with daily activities — like bathing, dressing, and medication management — but not 24-hour skilled nursing. Offers housing, meals, and around-the-clock support while aiming to maximize resident independence.

Bozeman
69
72.4%
+17%
5.11
-7%
+13%
2
15
2
50
51
Gallatin County
$5,9M
$1,5M
26.2%
275066
Livingston Health and Rehab Center
NH

Nursing Home Licensed facility providing 24/7 skilled nursing care for residents with complex, ongoing medical needs. Staffed by RNs, LPNs, and CNAs. Inspected and star-rated annually by CMS. Accepts Medicare (short-term rehab) and Medicaid (long-term care).

AL

Assisted Living A licensed, long-term care setting for seniors or individuals with disabilities who need help with daily activities — like bathing, dressing, and medication management — but not 24-hour skilled nursing. Offers housing, meals, and around-the-clock support while aiming to maximize resident independence.

Livingston
88
41.7%
-32%
3.83
+3%
-15%
1
33
2
47
64
-
$1,8M
$0,6M
31.9%
275047

Places of interest near Livingston Health and Rehab Center

Address 25.4 miles from city center — 2.79 miles to nearest hospital (Livingston HealthCare)

Address 510 S 14th St, Livingston, MT 59047

Calculate Travel Distance to Livingston Health and Rehab Center

Add your location

Address

Staffing Data (Q2 2025)

This data corresponds to Q2 2025 and is based on CMS Payroll-Based Journal.

Total staff 82
Employees 40
Contractors 42
Staff to resident ratio 1.74:1
0% compared with Montana average

Montana average ratio: 1.77:1

Avg staff/day 19
Average shift 9 hours
5% better than Montana average

Montana average: 8.6 hours

Total staff hours (quarter) 15,486
Nursing staff breakdown
Registered Nurse

Manages medical care and health needs.

Total count 13
Average shift length Info Average shift length. Calculated as total hours divided by days worked and average staff per day. 10 hours

This role is partially covered by contractors.

Licensed Practical Nurse

Assists with medical care and medications.

Total count 11
Average shift length Info Average shift length. Calculated as total hours divided by days worked and average staff per day. 8.5 hours

This role is partially covered by contractors.

Certified Nursing Assistant

Helps with daily care and mobility.

Total count 48
Average shift length Info Average shift length. Calculated as total hours divided by days worked and average staff per day. 9.7 hours

This role is partially covered by contractors.

Contractor staffing

Total hours from contractors

19.4%

3,010 contractor hours this quarter

Certified Nursing Assistant: 29 Licensed Practical Nurse: 7 Registered Nurse: 6
Staff by category
Certified Nursing Assistant1929488,30691100%9.7
Registered Nurse76132,94891100%10
Licensed Practical Nurse47111,3718593%8.5
Clinical Nurse Specialist4047405662%7.2
Dietitian1015396875%7.9
Nurse Practitioner2025166470%7.9
Other Dietary Services Staff1014895965%8.3
Mental Health Service Worker1014676167%7.6
Administrator1011121415%8
48 Certified Nursing Assistant
% of Days 100%
13 Registered Nurse
% of Days 100%
11 Licensed Practical Nurse
% of Days 93%
4 Clinical Nurse Specialist
% of Days 62%
1 Dietitian
% of Days 75%
2 Nurse Practitioner
% of Days 70%
1 Other Dietary Services Staff
% of Days 65%
1 Mental Health Service Worker
% of Days 67%
1 Administrator
% of Days 15%

Facility Characteristics

Source: CMS Long-Term Care Facility Characteristics (Data as of Jan 2026)

Total census
47 residents
Residents by payment source
Medicare
4 residents (8.5%)
Medicaid
38 residents (80.9%)
Private pay or other
5 residents (10.6%)
Programs & Services
Residents' Group

Residents meet regularly to discuss policies, care quality, and activities

Nurse Aide Training

State-approved Nurse Aide Training and Competency Evaluation Program on-site

Active Resident Council

Organized group of residents that meets regularly to discuss facility policies, quality of life, and activities.

Quality of care over time

These measures show how residents usually do over time at this home, based on health outcomes and preventive care.

High-risk clinical events score Info A composite score based on pressure ulcers, falls with injury, weight loss, walking ability decline, and activities of daily living decline. 10.5
6% better than Montana average

Montana average: 11.2

Functional decline score Info A composite score based on activities of daily living decline, walking ability decline, and incontinence. 17.0
22% better than Montana average

Montana average: 21.8

Long-stay resident measures
Below average Montana avg: 2.8 Info CMS star rating based on long-stay quality measure performance. 5 stars = significantly above average, 1 star = significantly below average.
Need for Help with Daily Activities Increased Info Percent of long-stay residents whose need for help with daily activities has increased 15.6%
20% better than Montana average

Montana average: 19.4%

Walking Ability Worsened Info Percent of long-stay residents whose ability to move independently worsened 17.7%
15% better than Montana average

Montana average: 20.8%

Low Risk Residents with Bowel/Bladder Incontinence Info Percent of low risk long-stay residents who lose control of their bowels or bladder 17.7%
30% better than Montana average

Montana average: 25.2%

Falls with Major Injury Info Percent of long-stay residents experiencing one or more falls with major injury 6.1%
41% worse than Montana average

Montana average: 4.3%

High Risk Residents with Pressure Ulcers Info Percent of long-stay high risk residents with pressure ulcers 8.1%
29% worse than Montana average

Montana average: 6.3%

Urinary Tract Infection Info Percent of long-stay residents with a urinary tract infection 0.0%
100% better than Montana average

Montana average: 2.8%

Lost Too Much Weight Info Percent of long-stay residents who lose too much weight 5.1%
17% better than Montana average

Montana average: 6.1%

Depressive Symptoms Info Percent of long-stay residents who have depressive symptoms 0.0%
100% better than Montana average

Montana average: 4.7%

Antipsychotic Use Info Percent of long-stay residents who received an antipsychotic medication 22.3%
17% worse than Montana average

Montana average: 19.1%

Pneumococcal Vaccine Info Percent of long-stay residents assessed and appropriately given the pneumococcal vaccine 93.2%
In line with Montana average

Montana average: 93.8%

Influenza Vaccine Info Percent of long-stay residents assessed and appropriately given the seasonal influenza vaccine 88.1%
6% worse than Montana average

Montana average: 93.7%

Hospitalizations per 1,000 days Info Number of hospitalizations per 1,000 long-stay resident days. 1.25
In line with Montana average

Montana average: 1.27

ED visits per 1,000 days Info Number of outpatient emergency department visits per 1,000 long-stay resident days. 2.63
21% worse than Montana average

Montana average: 2.17

Short-stay resident measures
Significantly below average Montana avg: 2.1 Info CMS star rating based on short-stay quality measure performance. 5 stars = much above average, 1 star = much below average.
Pneumococcal Vaccine Info Percent of short-stay residents assessed and appropriately given the pneumococcal vaccine 64.7%
15% worse than Montana average

Montana average: 76.4%

Antipsychotic medication increase Info Percent of short-stay residents who newly received an antipsychotic medication 6.4%
260% worse than Montana average

Montana average: 1.8%

Influenza Vaccine Info Percent of short-stay residents assessed and appropriately given the seasonal influenza vaccine 65.9%
11% worse than Montana average

Montana average: 73.8%

Re-hospitalized after SNF stay Info Percentage of short-stay residents who were re-hospitalized after their nursing home admission. 39.6%
104% worse than Montana average

Montana average: 19.4%

Emergency department visits Info Percentage of short-stay residents who had an outpatient emergency department visit. 18.9%
26% worse than Montana average

Montana average: 15.0%

Falls with major injury Info Percentage of SNF residents who experience falls with major injury during their stay. 1.3%
65% worse than Montana average

Montana average: 0.8%

Ability to care for self at discharge Info Percentage of residents at or above expected ability to care for themselves at discharge. 41.8%
22% worse than Montana average

Montana average: 53.7%

Successful return to home or community Info Rate of successful return to home or community from a skilled nursing facility. 55.8%
10% better than Montana average

Montana average: 50.6%

Penalties and fines

Federal penalties imposed by CMS for regulatory violations, including civil money penalties (fines) and denials of payment for new Medicare/Medicaid admissions.

Source: CMS Penalties Database (Data as of Jan 2026)

Total fines amount $27K
69% lower than Montana average

Montana average: $87K

Number of fines 1
57% fewer fines than Montana average

Montana average: 2.3

Payment Denials Info Serious action where Medicare and/or Medicaid temporarily stops payments for new residents until issues are fixed. 0
100% fewer payment denials than Montana average

Montana average: 0.2

Fines amount comparison
This facility $27K
Montana average $87K
Penalty History

Penalties are imposed by CMS for violations of federal nursing home regulations.

Civil Money Penalty Info Fines imposed for noncompliance, which can be assessed per day or per instance of violation. Dec 31, 2024
$27K

Last updated: Jan 2026

Guides for Better Senior Living

Care Cost Calculator: See Prices in Your Area

Nursing Home Data Explorer

Don’t Wait Too Long: 7 Red Flag Signs Your Parent Needs Assisted Living Now

The True Cost of Assisted Living in 2025 – And How Families Are Paying For It

Understanding Senior Living Costs: Pricing Models, Discounts & Financial Assistance

Financial Aid for Montana Seniors

Get financial aid guidance

Big Sky Waiver

Montana Medicaid Big Sky Waiver

Age 65+ or disabled, Montana resident, Medicaid- eligible, nursing home-level care need.

~$2,829/month (300% FBR, individual).

$2,000 (individual), $3,000 (couple).

Rural state; limited providers in some areas.

Montana Community First Choice

MT CFC

Age 65+ or disabled, Montana resident, Medicaid- eligible.

~$1,732/month (individual, Medicaid threshold).

$2,000 (individual).

Less intensive than waiver; rural focus.

Big Sky Rx

Montana Big Sky Rx

Age 65+ or disabled, Montana resident, enrolled in Medicare Part D, income below limit.

~$2,510/month (individual), ~$3,380/month (couple).

Not assessed.

Covers up to $38.75/month premium; statewide via AAAs.

Medicare Savings Program (MSP)

Montana Medicare Savings Program

Age 65+ or disabled, Montana resident, Medicare Part A/B.

~$2,510/month (QMB), ~$3,380/month (SLMB), ~$3,598/month (QI)—individual.

$9,430 (individual), $14,130 (couple).

Three tiers; no waitlist; includes Extra Help for Part D.

Montana Caregiver Support Program (via NFCSP)

Montana Caregiver Support Program

Caregivers of 60+ needing care or 55+ caregivers of others; Montana resident; functional needs (2+ ADLs).

Prioritizes ~$24,980/year (individual); no strict cap.

Not assessed; need-based.

10 AAAs; prioritizes low-income, rural caregivers.

Senior Community Service Employment Program (SCSEP)

Montana SCSEP

Age 55+, unemployed, low-income, Montana resident.

~$1,983/month (125% FPL).

Not specified; income-focused.

Priority for veterans, rural residents; AARP partnership.

VA Aid and Attendance (A&A) and Housebound Benefits

Montana VA Aid and Attendance/Housebound

Age 65+ or disabled veteran/spouse, Montana resident, wartime service, need for ADL help (A&A) or homebound.

Net income < ~$1,984/month (veteran with dependent, A&A); pension offsets income.

~$155,356 (net worth limit).

High veteran demand in rural areas.