Facility type
Residential Care Facility
Status
Active

We arrange tours, appointments, and even moving support so you don’t have to
Thank you for your interest!
Our team will be in touch shortly to help with next steps.

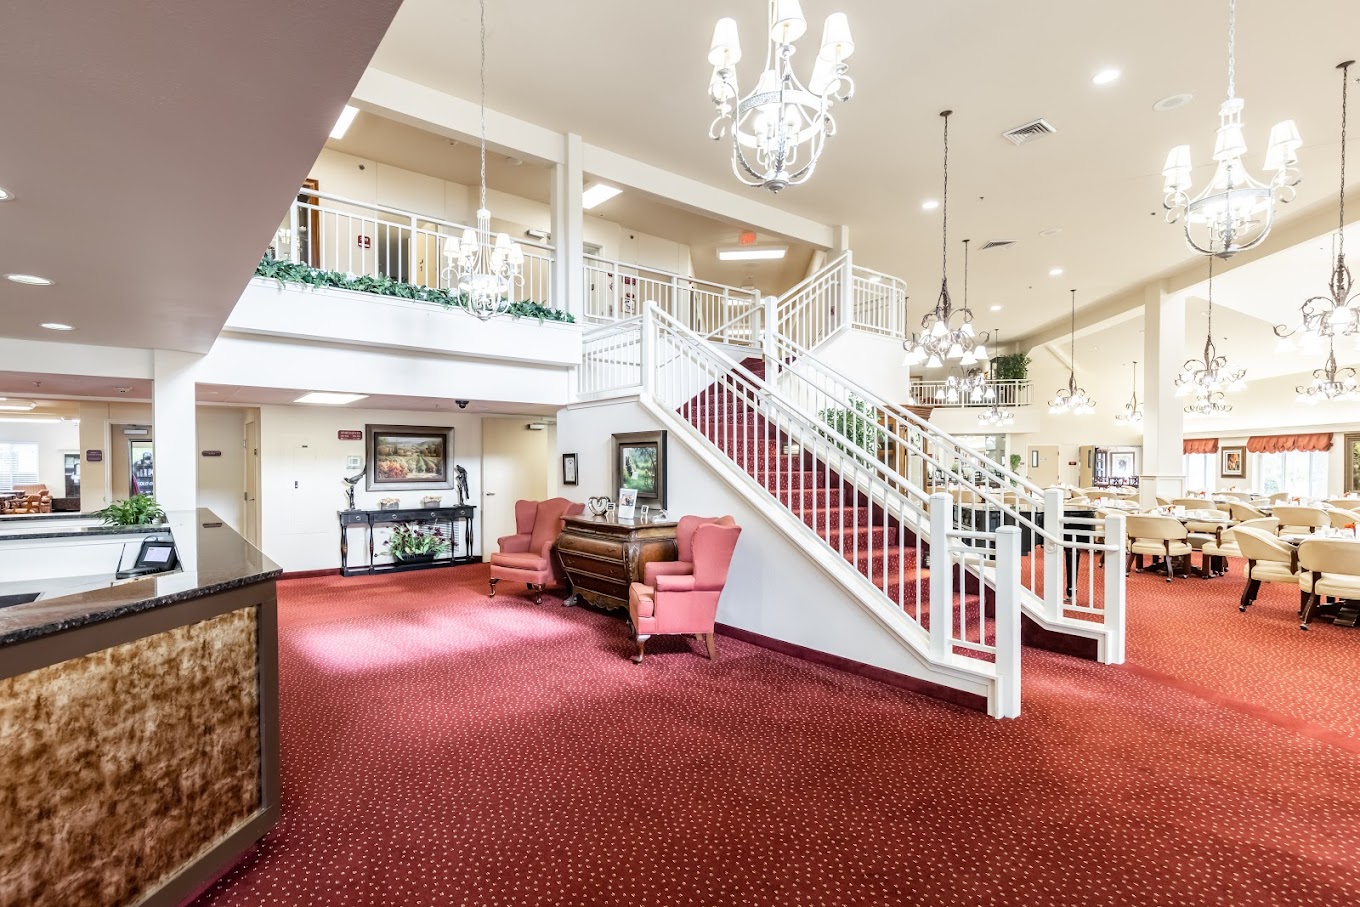
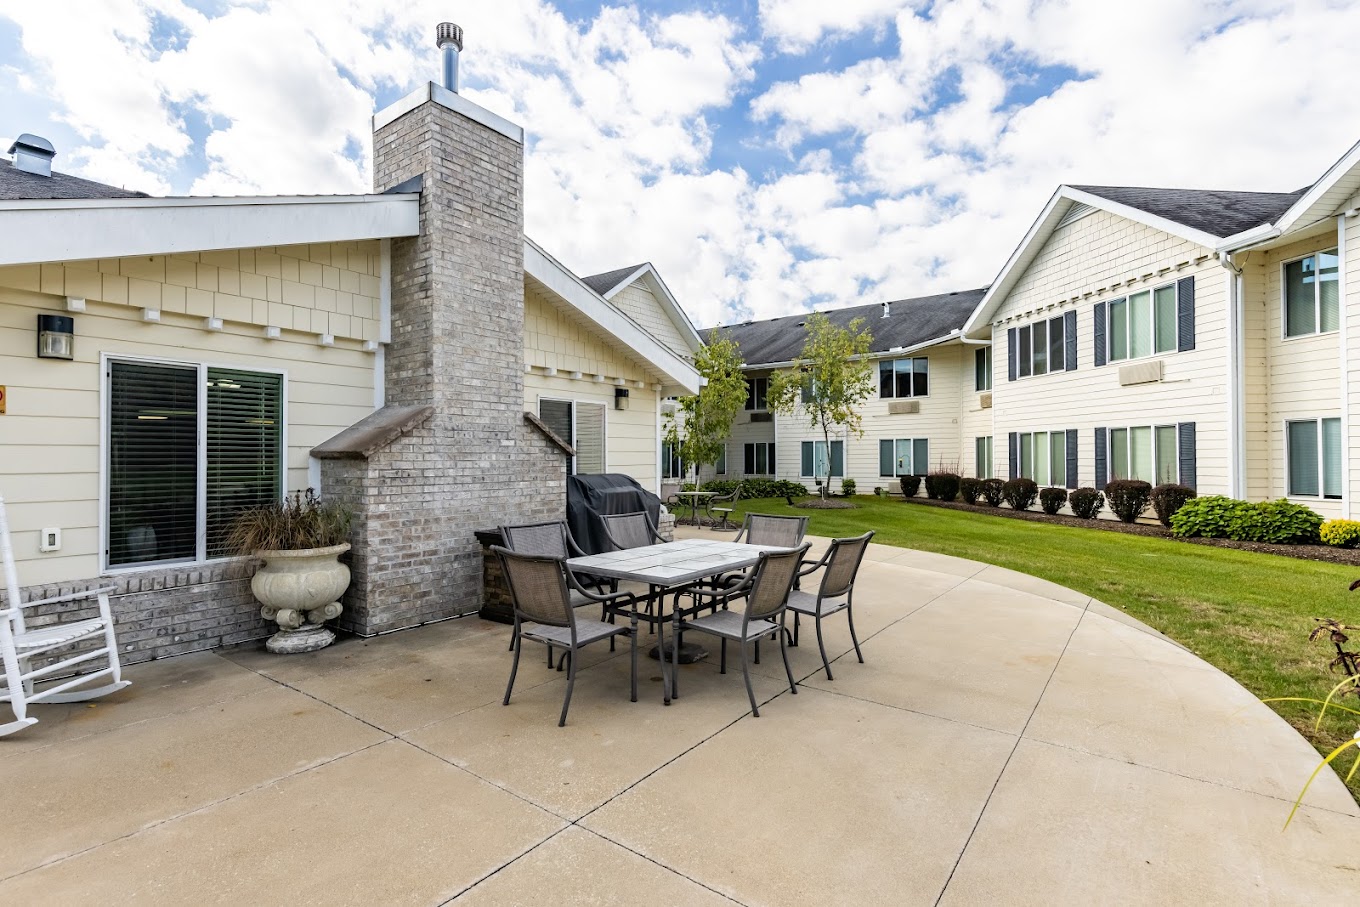
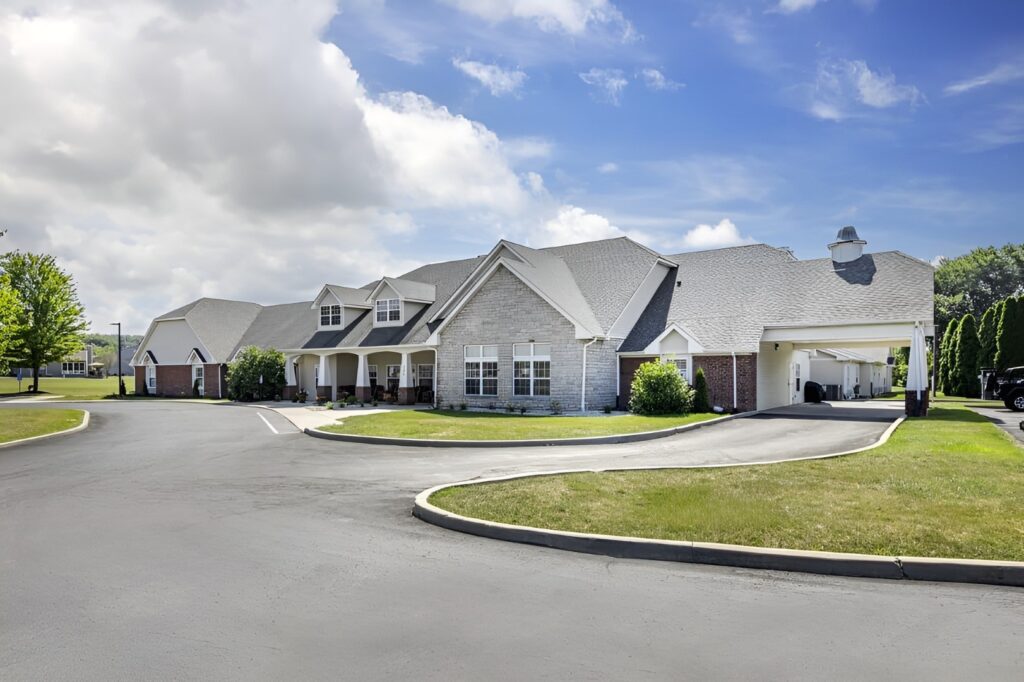
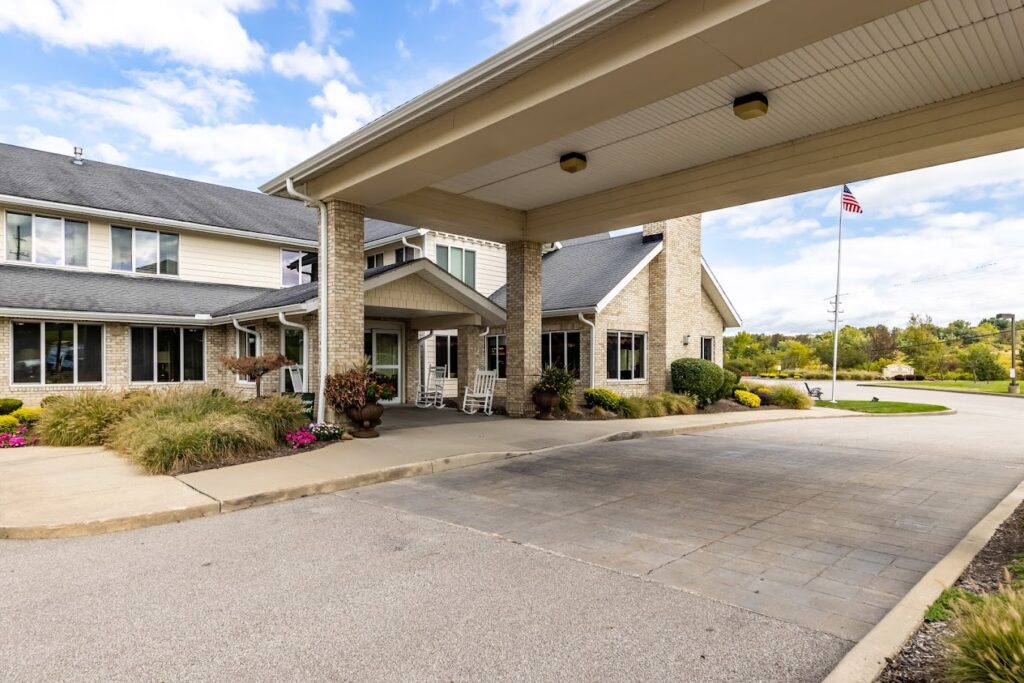
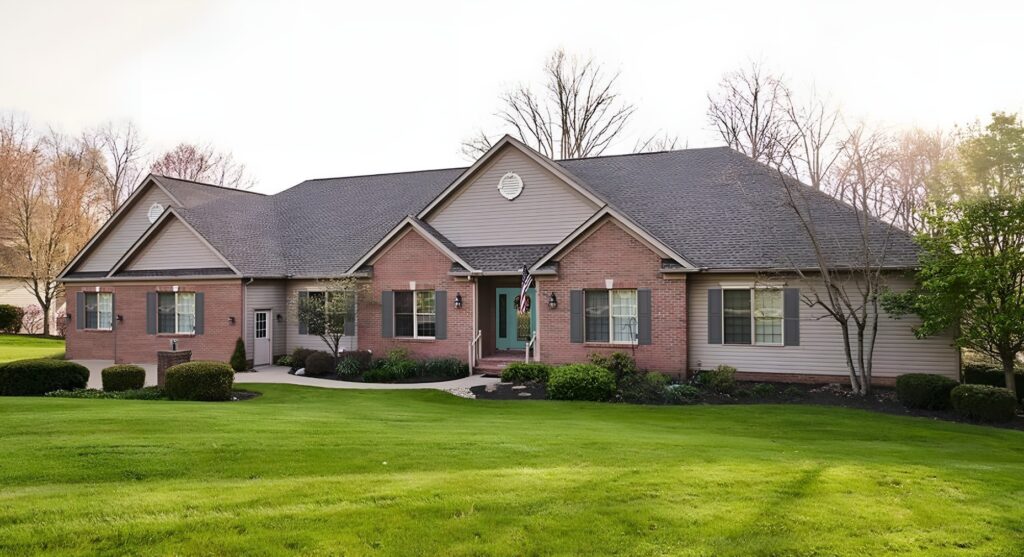
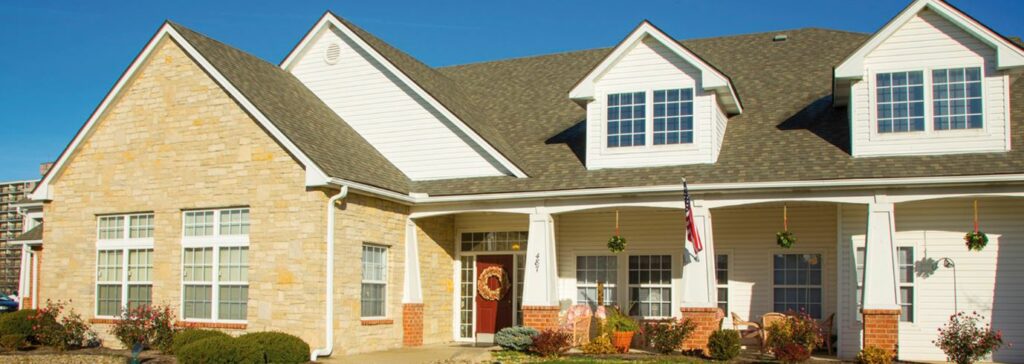
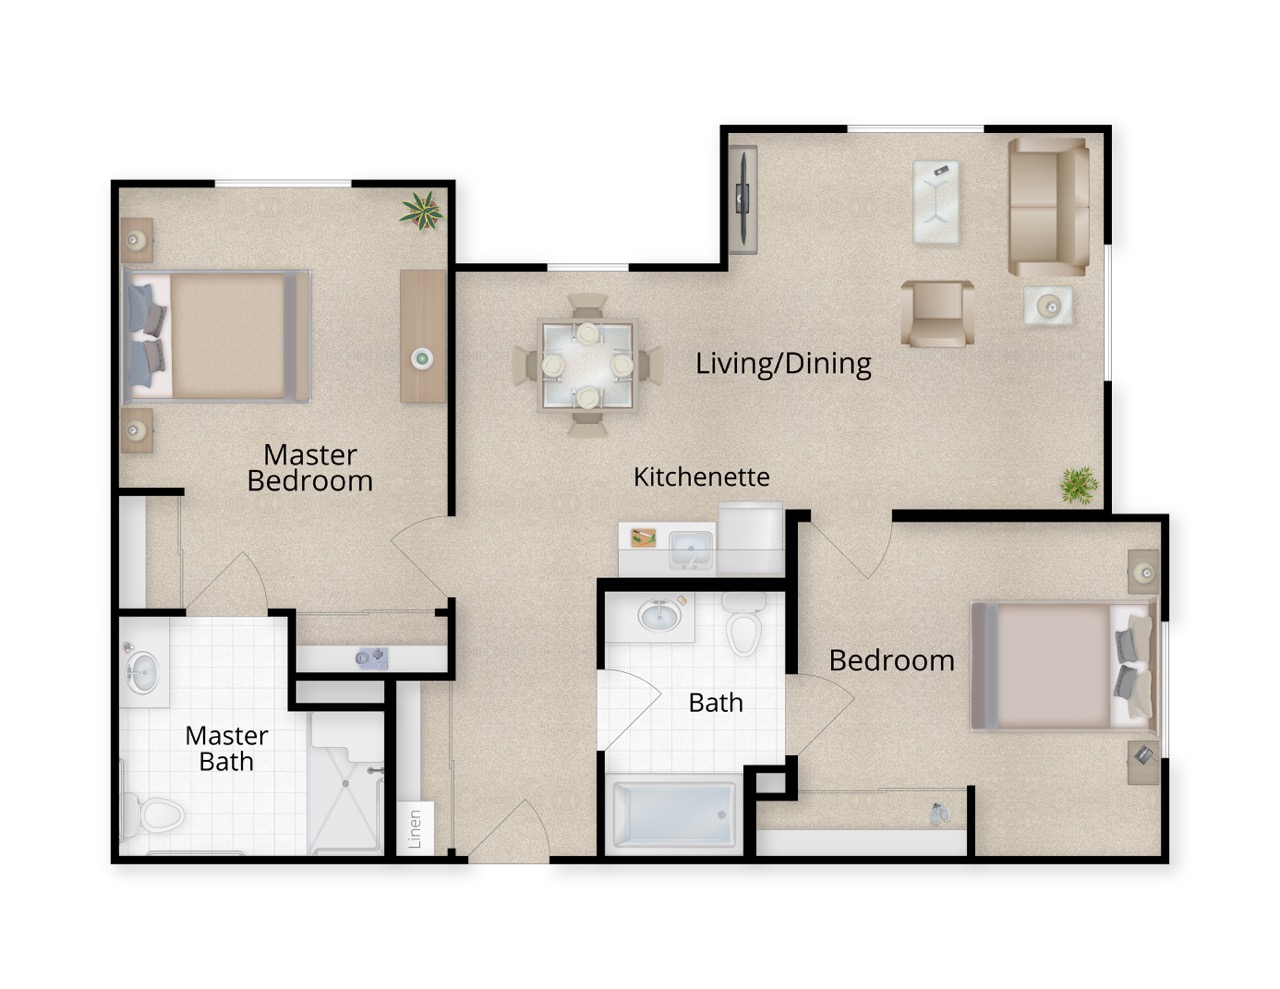
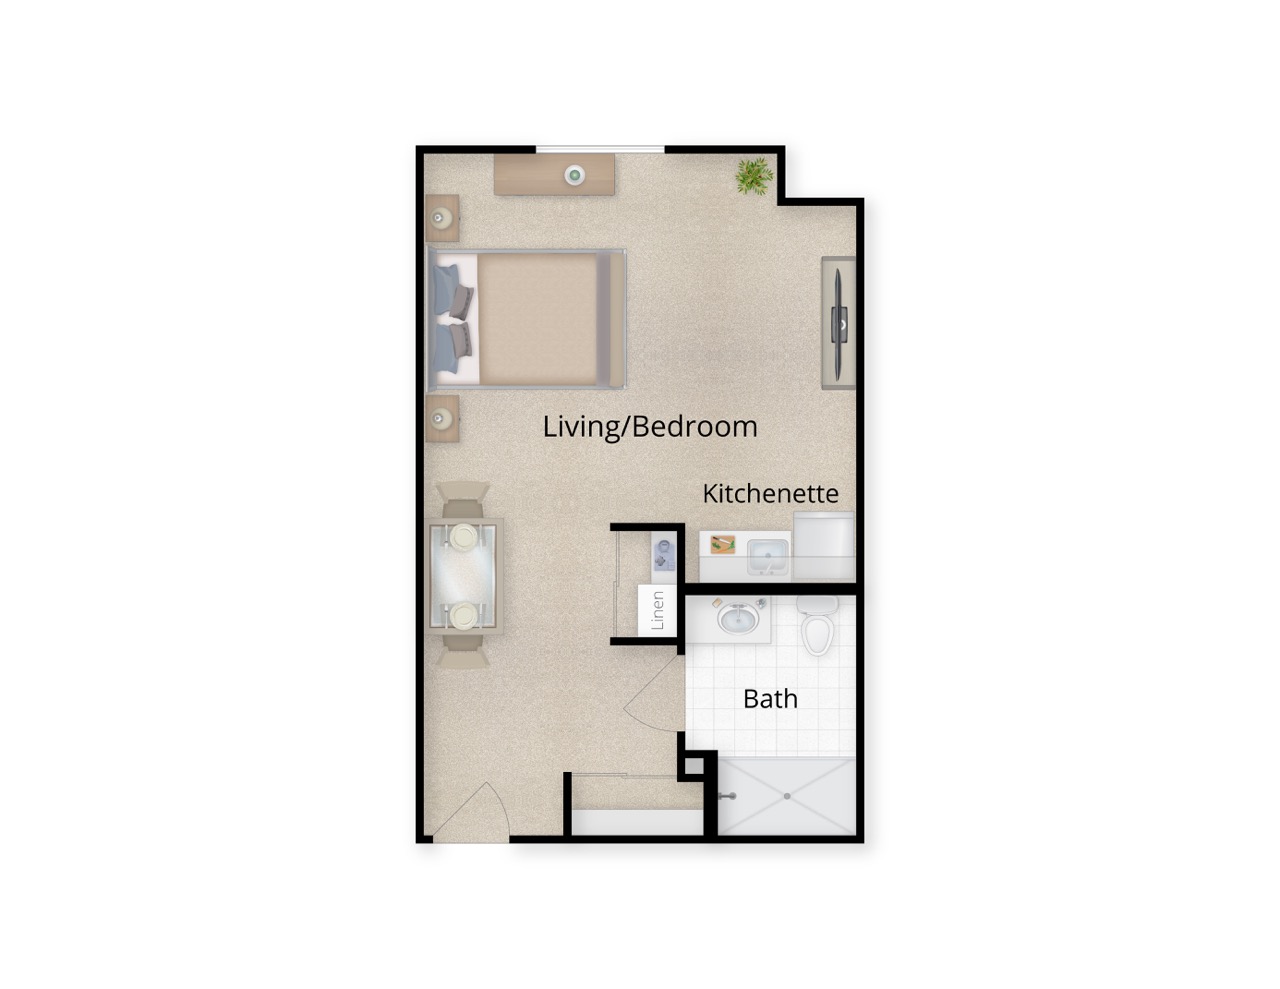
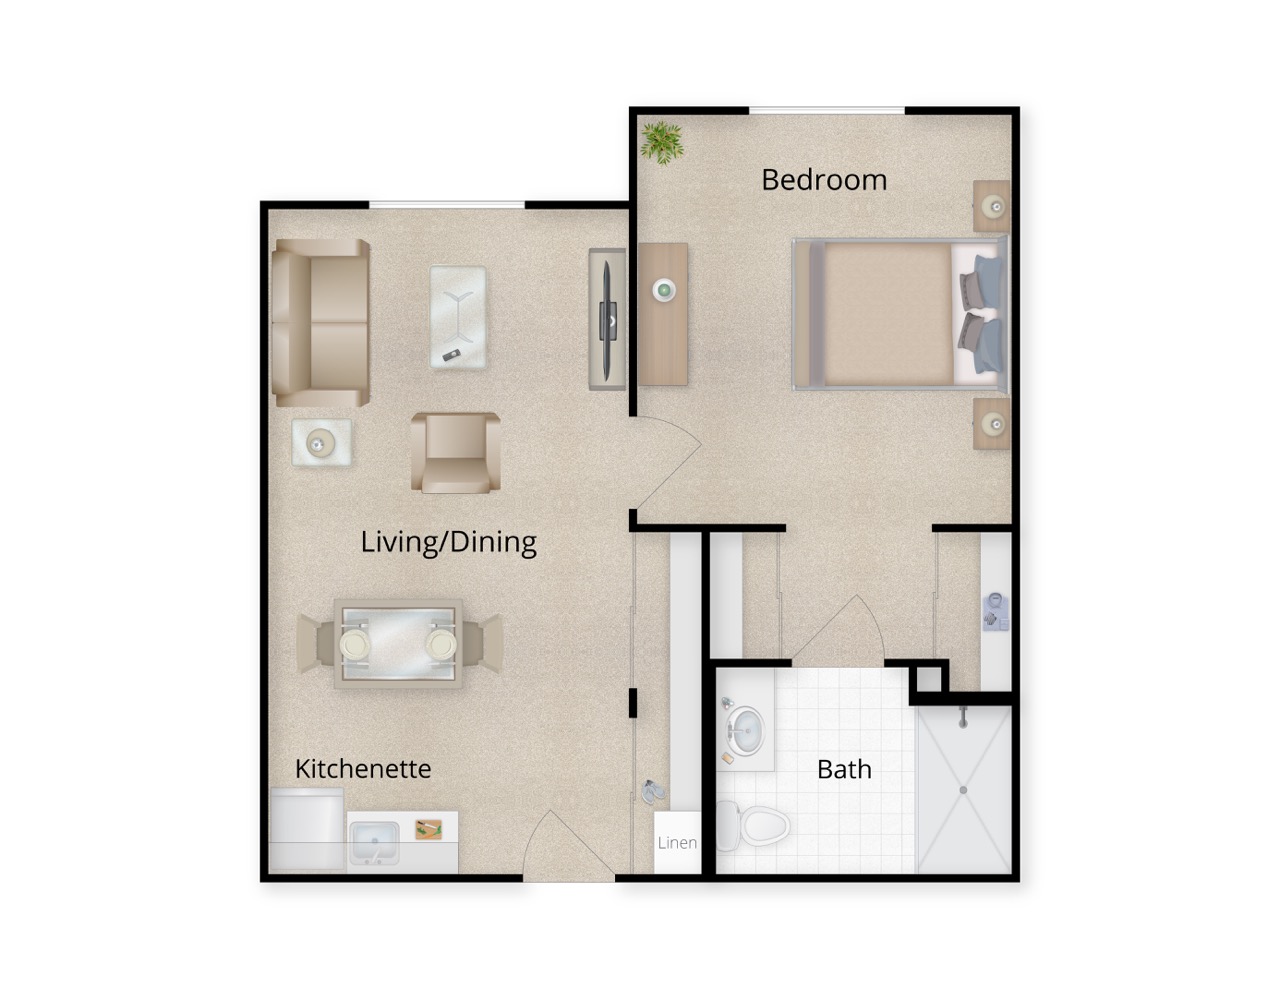
Settled on the harmonious grounds of South Main Street, Munroe Falls, OH, Mulberry Gardens Senior Living is an esteemed senior living community offering assisted living and respite care. Treat yourself to unmatched comfort and convenience with the snug and spacious residences of Mulberry Gardens Senior Living in various studio, one-bedroom, and two-bedroom floor plans. With a kind and compassionate team delivering the highest quality of care and support, seniors enjoy their independence and live their lives to the fullest.
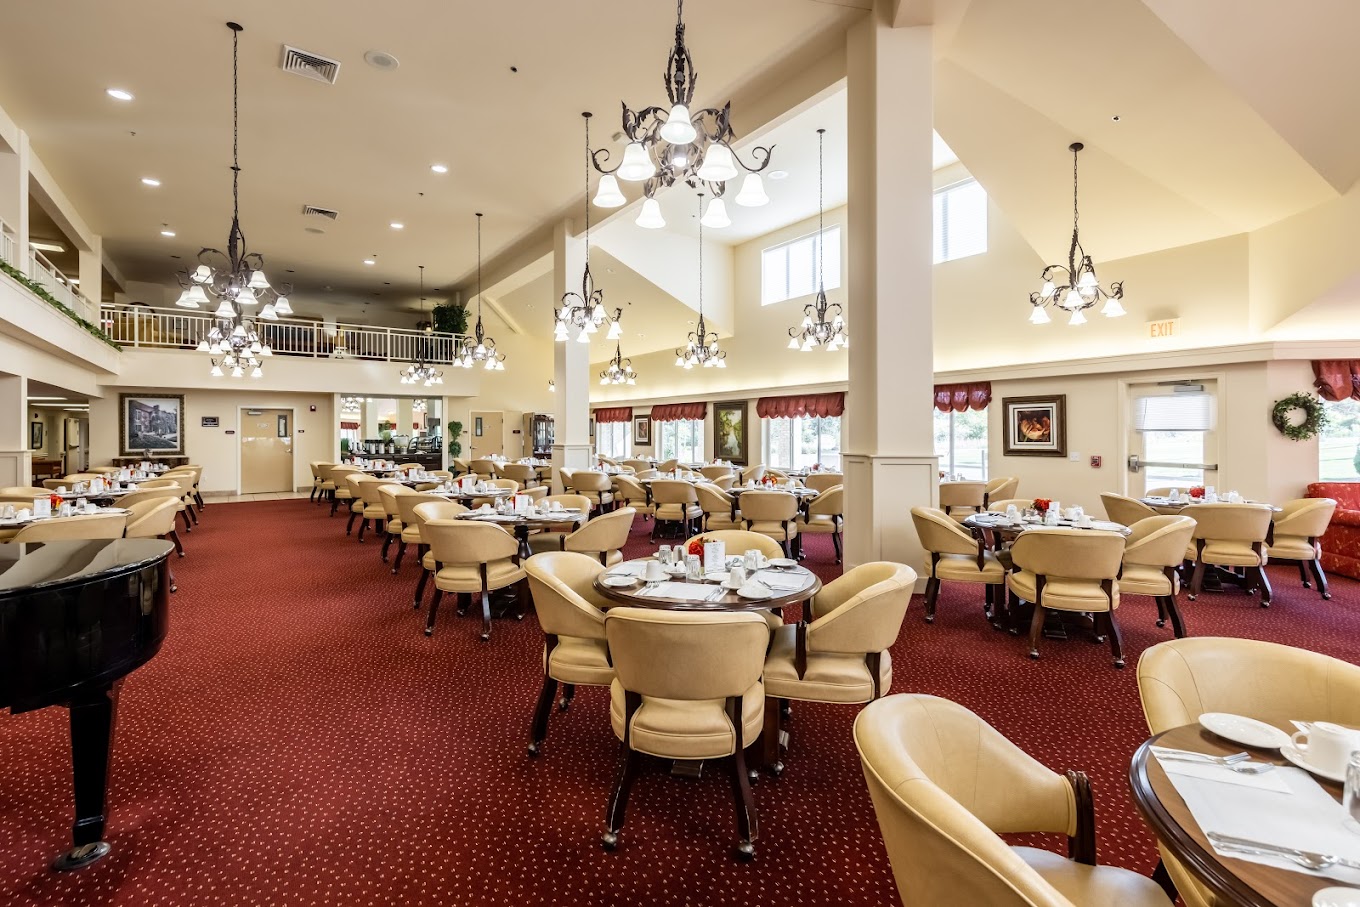
With exciting activities and enjoyable programs, residents explore new interests and rekindle past hobbies for leisure and wellness. Have a delightful dining experience with healthy and tasty meals catering to dietary needs and preferences. Mulberry Gardens Senior Living is great for seniors looking to live an active retirement with its state-of-the-art amenities and welcoming community.
Mulberry Gardens Senior Living is administrated by STEPHANIE CHAMBERS.
Key information about the people who lead and staff this community.
Housing Options: Studio / 1 Bed / 2 Bed
In Ohio, the Department of Health, Bureau of Survey and Certification conducts unannounced onsite inspections to evaluate the quality of care and environment in all licensed facilities.
Every two years, the Ohio Department of Aging and the Office of the State Long-Term Care Ombudsman organizations conduct a satisfaction survey among residents in long-term care facilities to assess their quality of care and life.
Ohio average: 86 / 100
Ohio average: 88 / 100
Ohio average: 95 / 100
Ohio average: 90 / 100
Ohio average: 86 / 100
Ohio average: 89 / 100
Ohio average: 79 / 100
Ohio average: 72 / 100
Based on the RCF Resident Satisfaction Survey 2022-23, Final Results
Scores represent percent of positive resident responses for each item, excluding "don't know" and "not applicable" responses and instances where the question was skipped.
Based on the RCF Resident Satisfaction Survey 2022-23, Final Results
Scores represent percent of positive resident responses for each item, excluding "don't know" and "not applicable" responses and instances where the question was skipped.
Based on the RCF Resident Satisfaction Survey 2022-23, Final Results
Scores represent percent of positive resident responses for each item, excluding "don't know" and "not applicable" responses and instances where the question was skipped.
Based on the RCF Resident Satisfaction Survey 2022-23, Final Results
Scores represent percent of positive resident responses for each item, excluding "don't know" and "not applicable" responses and instances where the question was skipped.
Based on the RCF Resident Satisfaction Survey 2022-23, Final Results
Scores represent percent of positive resident responses for each item, excluding "don't know" and "not applicable" responses and instances where the question was skipped.
Based on the RCF Resident Satisfaction Survey 2022-23, Final Results
Scores represent percent of positive resident responses for each item, excluding "don't know" and "not applicable" responses and instances where the question was skipped.
Based on the RCF Resident Satisfaction Survey 2022-23, Final Results
Scores represent percent of positive resident responses for each item, excluding "don't know" and "not applicable" responses and instances where the question was skipped.
The Scripps Gerontology Center at Miami University conducts a satisfaction survey among residents' family members, friends and guardians to assess quality of care and life.
Ohio average: 77 / 100
Ohio average: 80 / 100
Ohio average: 78 / 100
Ohio average: 85 / 100
Ohio average: 78 / 100
Ohio average: 78 / 100
Ohio average: 68 / 100
Ohio average: 67 / 100
Profile of respondents of this survey
100=Definitely Yes, 67=Probably Yes, 33=Probably No, 0=Definitely No
Does this living arrangement help the resident maintain their independence?:
This facility85/100
Ohio average84/100
Do you have enough opportunities for input into decisions about your resident’s care?:
This facility80/100
Ohio average78/100
Do you get enough information to make decisions with or about your resident?:
This facility82/100
Ohio average77/100
Scores represent percent of positive responses for each item based on the latest Family Satisfaction Survey results
100=Definitely Yes, 67=Probably Yes, 33=Probably No, 0=Definitely No
Is the residential care facility thoroughly clean?:
This facility68/100
Ohio average83/100
Can the resident get outside often enough?:
This facility75/100
Ohio average74/100
Are the resident’s belongings safe?:
This facility79/100
Ohio average79/100
Scores represent percent of positive responses for each item based on the latest Family Satisfaction Survey results
100=Definitely Yes, 67=Probably Yes, 33=Probably No, 0=Definitely No
When the resident moved in, were you given thorough information to help you know
This facility—/100
Ohio average—/100
what to expect?:
This facility94/100
Ohio average85/100
Was the resident given a thorough orientation to residential care?:
This facility87/100
Ohio average80/100
Did you feel warmly welcomed as a new family member?:
This facility90/100
Ohio average90/100
Scores represent percent of positive responses for each item based on the latest Family Satisfaction Survey results
100=Definitely Yes, 67=Probably Yes, 33=Probably No, 0=Definitely No
Are you encouraged to speak up when you have a problem?:
This facility84/100
Ohio average83/100
Are your concerns addressed in a timely way?:
This facility71/100
Ohio average78/100
Are you kept well informed about how things are going with your resident?:
This facility74/100
Ohio average76/100
Do the staff seem happy to work at the residential care facility?:
This facility68/100
Ohio average77/100
Do the staff go above and beyond to give your resident a good life?:
This facility67/100
Ohio average76/100
Do you feel confident that staff would help your resident beyond their personal care
This facility—/100
Ohio average—/100
needs if you could not (eg, paperwork, purchasing clothing)?:
This facility59/100
Ohio average69/100
Do you have peace of mind about the care your resident is getting when you aren’t at
This facility—/100
Ohio average—/100
the residential care facility?:
This facility74/100
Ohio average82/100
Would you highly recommend this residential care facility to a family member or friend?:
This facility68/100
Ohio average79/100
Scores represent percent of positive responses for each item based on the latest Family Satisfaction Survey results
100=Definitely Yes, 67=Probably Yes, 33=Probably No, 0=Definitely No
Do you feel confident the staff is knowledgeable about the resident’s medical
This facility—/100
Ohio average—/100
condition(s) and treatment(s)?:
This facility80/100
Ohio average79/100
Do the staff know what the resident likes and doesn’t like?:
This facility76/100
Ohio average79/100
Do the staff regularly check to see if the resident needs anything?:
This facility74/100
Ohio average77/100
Have you gotten to know the staff who care for your resident?:
This facility78/100
Ohio average78/100
Do the staff encourage your resident to be as independent as they are able to be?:
This facility80/100
Ohio average82/100
Do you feel confident staff would come quickly anytime your resident needed help?:
This facility73/100
Ohio average77/100
Scores represent percent of positive responses for each item based on the latest Family Satisfaction Survey results
100=Definitely Yes, 67=Probably Yes, 33=Probably No, 0=Definitely No
Does the resident have something enjoyable to look forward to most days?:
This facility64/100
Ohio average71/100
Do the staff do a good job keeping the resident connected to the community?:
This facility62/100
Ohio average72/100
Does the resident have plenty of opportunities to do things that are meaningful to them?:
This facility63/100
Ohio average71/100
Does the residential care facility have enough opportunities for your resident to go on
This facility—/100
Ohio average—/100
special outings and events?:
This facility52/100
Ohio average63/100
Does the resident like the provided activities?:
This facility52/100
Ohio average69/100
Does the residential care facility provide things the resident enjoys doing on the
This facility—/100
Ohio average—/100
weekend?:
This facility47/100
Ohio average56/100
Do you have plenty of opportunities to be involved in the residential care facility?:
This facility64/100
Ohio average72/100
Scores represent percent of positive responses for each item based on the latest Family Satisfaction Survey results
100=Definitely Yes, 67=Probably Yes, 33=Probably No, 0=Definitely No
Is there a lot of variety in the meals?:
This facility71/100
Ohio average70/100
Are you included in mealtimes if you want to be?:
This facility90/100
Ohio average65/100
Is the food good?:
This facility68/100
Ohio average68/100
Scores represent percent of positive responses for each item based on the latest Family Satisfaction Survey results
Assisted Living A licensed, long-term care setting for seniors or individuals with disabilities who need help with daily activities — like bathing, dressing, and medication management — but not 24-hour skilled nursing. Offers housing, meals, and around-the-clock support while aiming to maximize resident independence.
Assisted Living A licensed, long-term care setting for seniors or individuals with disabilities who need help with daily activities — like bathing, dressing, and medication management — but not 24-hour skilled nursing. Offers housing, meals, and around-the-clock support while aiming to maximize resident independence.
Respite Care Short-term temporary care — days to weeks — to give family caregivers a break. Full care provided during the stay. Often used after hospitalization or to trial a facility before a permanent placement decision.
Assisted Living A licensed, long-term care setting for seniors or individuals with disabilities who need help with daily activities — like bathing, dressing, and medication management — but not 24-hour skilled nursing. Offers housing, meals, and around-the-clock support while aiming to maximize resident independence.
Independent Living Lifestyle-focused communities for older adults offering dining, activities, and transportation with minimal personal care. Best for active, independent seniors who want community without medical support.
Memory Care Secured, specialized care for people living with Alzheimer's or dementia. Staff trained in cognitive impairment, with higher staff-to-resident ratios and an environment designed to reduce confusion and wandering risk.
Assisted Living A licensed, long-term care setting for seniors or individuals with disabilities who need help with daily activities — like bathing, dressing, and medication management — but not 24-hour skilled nursing. Offers housing, meals, and around-the-clock support while aiming to maximize resident independence.
Assisted Living A licensed, long-term care setting for seniors or individuals with disabilities who need help with daily activities — like bathing, dressing, and medication management — but not 24-hour skilled nursing. Offers housing, meals, and around-the-clock support while aiming to maximize resident independence.
![]() 1.2 miles from city center
1.2 miles from city center
![]() 395 S Main St, Munroe Falls, OH 44262
395 S Main St, Munroe Falls, OH 44262
Add your location
Care Cost Calculator: See Prices in Your Area
Nursing Home Data Explorer
Don’t Wait Too Long: 7 Red Flag Signs Your Parent Needs Assisted Living Now
The True Cost of Assisted Living in 2025 – And How Families Are Paying For It
Understanding Senior Living Costs: Pricing Models, Discounts & Financial Assistance

Touring a community? Use this expert-backed checklist to stay organized, ask the right questions, and find the perfect fit.
We'll send you a PDF version of the touring checklist.