Explore Open Rooms

1 Contact details
2 What type of senior care service are you looking for?
3 What budget do you have in mind for senior care?
4 How soon do you need to find care?
5 Additional details

Thank you for your interest!

Our team will be in touch shortly to help with next steps.

Memory Care Home

Neville Place at Fresh Pond

Memory Care Home

Neville Place at Fresh Pond

650 Concord Ave, Cambridge, MA 02138 View map
Overview of Neville Place at Fresh Pond

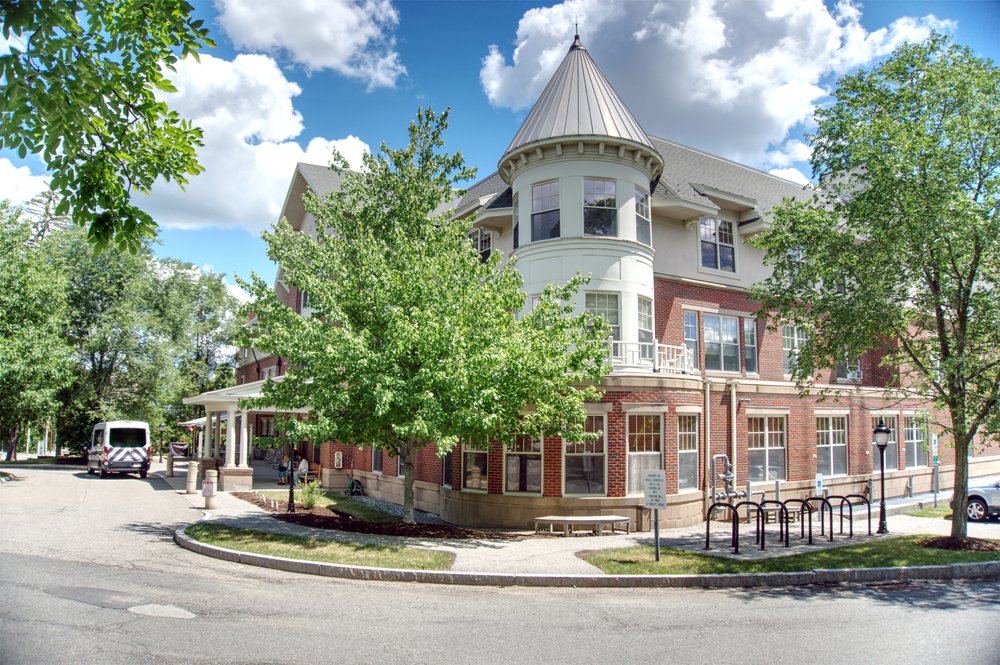
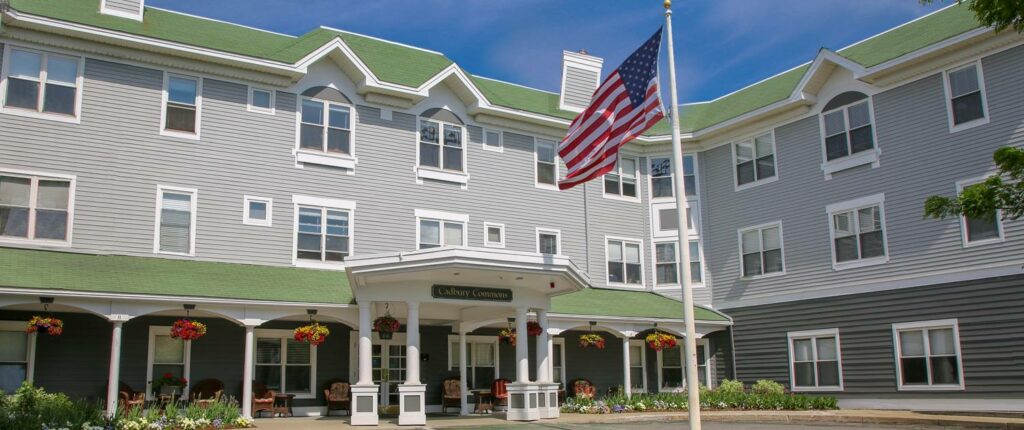
Located in the charming city of Cambridge, Massachusetts, Neville Place Assisted Living presents an exceptional opportunity for seniors seeking a blend of memory care with assisted living and skilled nursing. This inviting community extends a warm invitation to those looking for a perfect balance between compassionate assistance and top-notch healthcare. With its idyllic location surrounded by tranquil woodlands and a serene pond, Neville Place creates an ideal haven where residents can enjoy the comfort and care they deserve while benefiting from skilled nursing support.

Regarded as an urban jewel, the home boasts a design crafted by the esteemed landscape architect Frederick Law Olmsted, known for his masterful creations. The expansive grounds and picturesque neighborhood pay homage to this legacy, offering residents a scenic escape from the hustle and bustle of city life. Beyond its aesthetic charm, Neville Place excels in providing a spectrum of services, from short-term rehabilitation to comprehensive long-term care, all while adhering to rigorous nursing home quality measures. As a beacon of high-quality and affordable options, Neville Place Assisted Living is not merely a residence, but a wellspring of comfort and care.

(617) 497-8700

Quality ratings

Measured by Centers for Medicare & Medicaid Services (CMS)

Overall rating Info The Overall CMS Rating combines results from health inspections, staffing levels and quality measures. Health inspections carry the most weight. Staffing and quality scores can increase or decrease the final rating based on performance compared to state and national standards.
4/5
Massachusetts average: 2.9/5
Health Inspection Info Based on the results of the facility's three most recent standard inspections and any complaint investigations. CMS reviews the number, scope, and severity of deficiencies, with more recent findings weighted more heavily.
4/5
Massachusetts average: 2.8/5
Staffing Info Measures average nursing staff hours per resident per day, including Registered Nurses (RNs) and total nursing staff. Ratings are adjusted based on the level of care residents require and are compared to state and national benchmarks.
3/5
Massachusetts average: 3.0/5
Quality Measures Info Based on clinical and physical health indicators reported to CMS, such as hospital readmissions, falls, pressure ulcers, and improvements in mobility. These measures reflect how well residents' health needs are being managed.
4/5
Massachusetts average: 3.2/5

Nursing care per resident

Info This shows how many total hours of nursing staff time are available per resident each day. Higher numbers usually mean more staff support.
4h 12m per day

This home provides 7% more nursing time per resident than the Massachusetts average.

Massachusetts average: 3h 56m per day

Capacity and availability

Medium-capacity home

Offers a balance of services and community atmosphere.

Total beds 112

This home usually has limited availability

Occupancy is moderate, suggesting balanced demand.

Similar demand to the Massachusetts average
Occupancy rate 92.1%
Residents per day (avg) 92
Occupancy rate
92.1%
Residents per day (avg)
92

Who this home usually serves

TYPE OF STAY

Mostly short-term rehab stays

Most residents typically stay for a few weeks or months before returning home or moving on.

Might be optimal for
Short stays Recovery Medicare-covered care

Breakdown by payment type

Medicare

71% of new residents, usually for short-term rehab.

Typical stay 25 days

Private pay

28% of new residents, often for short stays.

Typical stay 1 - 2 months

Medicaid

1% of new residents, often for long-term daily care.

Typical stay 11 years

Finances and operations

Voluntary non-profit community
Home revenue
$23.6M
Operating deficit
-$1.2M
Voluntary non-profit community
Home revenue
$23,555,995.00
Operating deficit
$-1,226,038.00
Payroll costs Info The portion of the home's budget spent on staff, including nurses, caregivers, and other employees who support care and operations.
$10.3M
43.7% of revenue
Other operating costs Info All remaining costs needed to run the home, such as food, utilities, building maintenance, supplies and administrative expenses.
$14.5M
Total costs $24.8M

What does this home offer?

Pets allowed icon
Pets allowed icon

Pets Allowed: Yes, Pets Allowed

Housing options icon

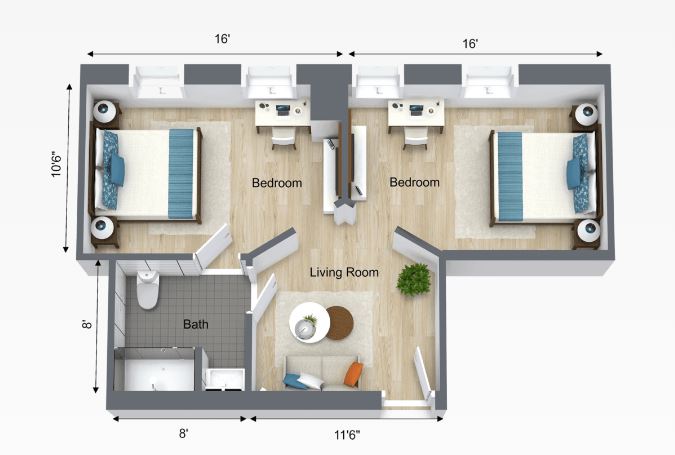
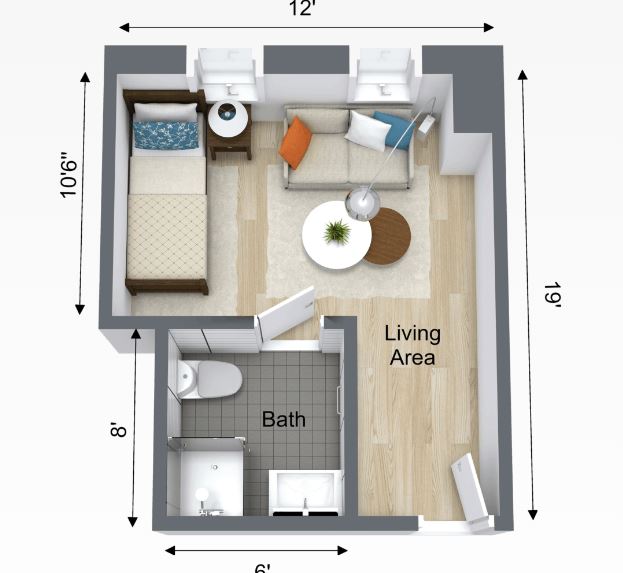
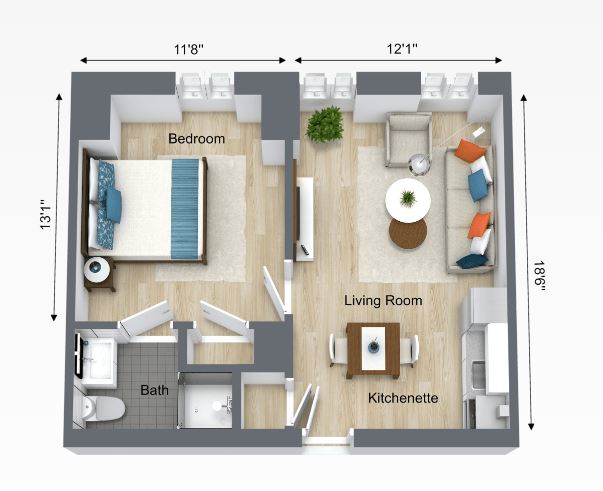
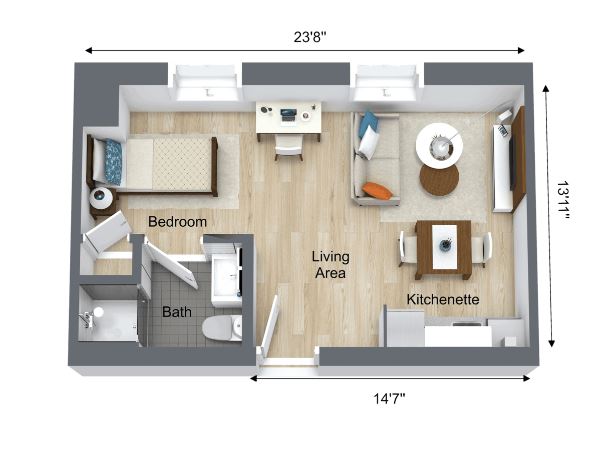
Housing Options: Studio / Suite / 1 Bed

Building type icon
Building type icon

Building Type: 3-story

Fitness and recreation icon

Fitness and Recreation

Types of Care at Neville Place at Fresh Pond

Assisted Living Memory Care Nursing Home

Health Inspection History

Inspections
Total health inspections 4

Massachusetts average 4.5


Last Health inspection on May 2025

Total health citations 20

Massachusetts average 32.7

Citations per inspection
5

Massachusetts average 7.24


Health citations are formal notices following inspections when they fail to comply with safety and care standards.

19 of 20 citations resulted from standard inspections; and 1 of 20 resulted from complaint investigations.

Breakdown of citation severity (last 3 years)
Critical Health citations More info 0
100% better than Massachusetts average

Massachusetts average: 0.3


Serious Health citations More info 0
100% better than Massachusetts average

Massachusetts average: 1.5

0 critical citations More info Massachusetts average: 0.3

0 serious citations More info Massachusetts average: 1.5

20 moderate citations More info Massachusetts average: 29.7

0 minor citations More info Massachusetts average: 1.3
Citations history (last 3 years)
Pharmacy moderate citation Info Issues related to medication management, including how drugs are stored, administered, and monitored. May 28, 2025
Corrected

Pharmacy moderate citation Info Issues related to medication management, including how drugs are stored, administered, and monitored. May 28, 2025
Corrected

Quality of Care moderate citation Info Issues related to how well residents receive appropriate treatment and support for their medical and daily care needs. May 28, 2025
Corrected

Quality of Care moderate citation Info Issues related to how well residents receive appropriate treatment and support for their medical and daily care needs. May 28, 2025
Corrected

Compare Memory Care around Cambridge The information below is reported by the Massachusetts Executive Office of Elder Affairs and Department of Public Health.

Neville Place at Fresh Pond
AL

Assisted Living A licensed, long-term care setting for seniors or individuals with disabilities who need help with daily activities — like bathing, dressing, and medication management — but not 24-hour skilled nursing. Offers housing, meals, and around-the-clock support while aiming to maximize resident independence.

MC

Memory Care Secured, specialized care for people living with Alzheimer's or dementia. Staff trained in cognitive impairment, with higher staff-to-resident ratios and an environment designed to reduce confusion and wandering risk.

NH

Nursing Home Licensed facility providing 24/7 skilled nursing care for residents with complex, ongoing medical needs. Staffed by RNs, LPNs, and CNAs. Inspected and star-rated annually by CMS. Accepts Medicare (short-term rehab) and Medicaid (long-term care).

Cambridge (Cambridge Highlands)
112
Yes
-
56
Studio / Suite / 1 Bed
Cadbury Commons
AL

Assisted Living A licensed, long-term care setting for seniors or individuals with disabilities who need help with daily activities — like bathing, dressing, and medication management — but not 24-hour skilled nursing. Offers housing, meals, and around-the-clock support while aiming to maximize resident independence.

IL

Independent Living Lifestyle-focused communities for older adults offering dining, activities, and transportation with minimal personal care. Best for active, independent seniors who want community without medical support.

MC

Memory Care Secured, specialized care for people living with Alzheimer's or dementia. Staff trained in cognitive impairment, with higher staff-to-resident ratios and an environment designed to reduce confusion and wandering risk.

RC

Respite Care Short-term temporary care — days to weeks — to give family caregivers a break. Full care provided during the stay. Often used after hospitalization or to trial a facility before a permanent placement decision.

Cambridge (Neighborhood Nine)
74
No
A+
86
Studio / Suite / 1 Bed

Living Spaces & Floor Plans

Neville Place At Fresh Pond P1
Neville Place At Fresh Pond P2
Neville Place At Fresh Pond P3
Neville Place At Fresh Pond P4

Places of interest near Neville Place at Fresh Pond

Address 2.6 miles from city center — 2.17 miles to nearest hospital (McLean Hospital)

Address 650 Concord Ave, Cambridge, MA 02138

Calculate Travel Distance to Neville Place at Fresh Pond

Add your location

Address

Staffing Data (Q2 2025)

This data corresponds to Q2 2025 and is based on CMS Payroll-Based Journal.

Total staff 176
Employees 152
Contractors 24
Staff to resident ratio 1.89:1
11% better than Massachusetts average

Massachusetts average ratio: 1.70:1

Avg staff/day 60
Average shift 8.6 hours
9% better than Massachusetts average

Massachusetts average: 7.9 hours

Total staff hours (quarter) 47,060
Nursing staff breakdown
Registered Nurse

Manages medical care and health needs.

Total count 21
Average shift length Info Average shift length. Calculated as total hours divided by days worked and average staff per day. 9.5 hours

No contractors work on this role.

Licensed Practical Nurse

Assists with medical care and medications.

Total count 24
Average shift length Info Average shift length. Calculated as total hours divided by days worked and average staff per day. 10.7 hours

No contractors work on this role.

Certified Nursing Assistant

Helps with daily care and mobility.

Total count 60
Average shift length Info Average shift length. Calculated as total hours divided by days worked and average staff per day. 8.8 hours

No contractors work on this role.

Contractor staffing

Total hours from contractors

1.7%

823 contractor hours this quarter

Mental Health Service Worker: 6 Other Physician: 5 Medical Director: 4 Qualified Activities Professional: 4 Occupational Therapy Assistant: 3 Other Dietary Services Staff: 2
Staff by category
Certified Nursing Assistant 60 0 60 18,329 91 100% 8.8
Licensed Practical Nurse 24 0 24 9,370 91 100% 10.7
Registered Nurse 21 0 21 6,656 91 100% 9.5
Respiratory Therapy Technician 10 0 10 2,194 82 90% 7.7
Physical Therapy Assistant 8 0 8 1,895 90 99% 7.5
Clinical Nurse Specialist 5 0 5 1,616 64 70% 8.3
Mental Health Service Worker 4 6 10 1,279 73 80% 6
Speech Language Pathologist 5 0 5 1,241 71 78% 7.8
Qualified Social Worker 5 0 5 832 71 78% 6.9
Other Dietary Services Staff 2 2 4 822 83 91% 7
Administrator 2 0 2 512 64 70% 8
Occupational Therapy Aide 2 0 2 491 62 68% 7.9
Physical Therapy Aide 1 0 1 426 56 62% 7.6
Dietitian 1 0 1 368 46 51% 8
Therapeutic Recreation Specialist 1 0 1 328 42 46% 7.8
Medical Director 0 4 4 306 42 46% 6.1
Nurse Practitioner 1 0 1 160 20 22% 8
Qualified Activities Professional 0 4 4 91 30 33% 2.9
Other Physician 0 5 5 88 15 16% 3.7
Occupational Therapy Assistant 0 3 3 57 50 55% 1
60 Certified Nursing Assistant
% of Days 100%
24 Licensed Practical Nurse
% of Days 100%
21 Registered Nurse
% of Days 100%
10 Respiratory Therapy Technician
% of Days 90%
8 Physical Therapy Assistant
% of Days 99%
5 Clinical Nurse Specialist
% of Days 70%
10 Mental Health Service Worker
% of Days 80%
5 Speech Language Pathologist
% of Days 78%
5 Qualified Social Worker
% of Days 78%
4 Other Dietary Services Staff
% of Days 91%
2 Administrator
% of Days 70%
2 Occupational Therapy Aide
% of Days 68%
1 Physical Therapy Aide
% of Days 62%
1 Dietitian
% of Days 51%
1 Therapeutic Recreation Specialist
% of Days 46%
4 Medical Director
% of Days 46%
1 Nurse Practitioner
% of Days 22%
4 Qualified Activities Professional
% of Days 33%
5 Other Physician
% of Days 16%
3 Occupational Therapy Assistant
% of Days 55%

Facility Characteristics

Source: CMS Long-Term Care Facility Characteristics (Data as of Jan 2026)

Total census
93 residents
Residents by payment source
Medicare
28 residents (30.1%)
Medicaid
42 residents (45.2%)
Private pay or other
23 residents (24.7%)
Programs & Services
Residents' Group

Residents meet regularly to discuss policies, care quality, and activities

Active Resident Council

Organized group of residents that meets regularly to discuss facility policies, quality of life, and activities.

Quality of care over time

These measures show how residents usually do over time at this home, based on health outcomes and preventive care.

High-risk clinical events score Info A composite score based on pressure ulcers, falls with injury, weight loss, walking ability decline, and activities of daily living decline. 6.3
39% better than Massachusetts average

Massachusetts average: 10.2

Functional decline score Info A composite score based on activities of daily living decline, walking ability decline, and incontinence. 10.6
47% better than Massachusetts average

Massachusetts average: 20.0

Long-stay resident measures
Need for Help with Daily Activities Increased Info Percent of long-stay residents whose need for help with daily activities has increased 9.6%
49% better than Massachusetts average

Massachusetts average: 18.7%

Walking Ability Worsened Info Percent of long-stay residents whose ability to move independently worsened 8.6%
56% better than Massachusetts average

Massachusetts average: 19.3%

Low Risk Residents with Bowel/Bladder Incontinence Info Percent of low risk long-stay residents who lose control of their bowels or bladder 13.5%
39% better than Massachusetts average

Massachusetts average: 22.1%

Falls with Major Injury Info Percent of long-stay residents experiencing one or more falls with major injury 1.6%
56% better than Massachusetts average

Massachusetts average: 3.6%

High Risk Residents with Pressure Ulcers Info Percent of long-stay high risk residents with pressure ulcers 5.8%
24% worse than Massachusetts average

Massachusetts average: 4.7%

Urinary Tract Infection Info Percent of long-stay residents with a urinary tract infection 4.1%
96% worse than Massachusetts average

Massachusetts average: 2.1%

Lost Too Much Weight Info Percent of long-stay residents who lose too much weight 5.8%
12% worse than Massachusetts average

Massachusetts average: 5.2%

Depressive Symptoms Info Percent of long-stay residents who have depressive symptoms 2.7%
74% better than Massachusetts average

Massachusetts average: 10.7%

Antipsychotic Use Info Percent of long-stay residents who received an antipsychotic medication 17.6%
13% better than Massachusetts average

Massachusetts average: 20.3%

Pneumococcal Vaccine Info Percent of long-stay residents assessed and appropriately given the pneumococcal vaccine 96.5%
5% better than Massachusetts average

Massachusetts average: 91.9%

Influenza Vaccine Info Percent of long-stay residents assessed and appropriately given the seasonal influenza vaccine 100.0%
5% better than Massachusetts average

Massachusetts average: 94.8%

Short-stay resident measures
Pneumococcal Vaccine Info Percent of short-stay residents assessed and appropriately given the pneumococcal vaccine 91.8%
20% better than Massachusetts average

Massachusetts average: 76.7%

Antipsychotic medication increase Info Percent of short-stay residents who newly received an antipsychotic medication 0.6%
53% better than Massachusetts average

Massachusetts average: 1.3%

Influenza Vaccine Info Percent of short-stay residents assessed and appropriately given the seasonal influenza vaccine 93.3%
20% better than Massachusetts average

Massachusetts average: 77.7%

Guides for Better Senior Living

Care Cost Calculator: See Prices in Your Area

Nursing Home Data Explorer

Don’t Wait Too Long: 7 Red Flag Signs Your Parent Needs Assisted Living Now

The True Cost of Assisted Living in 2025 – And How Families Are Paying For It

Understanding Senior Living Costs: Pricing Models, Discounts & Financial Assistance

Financial Aid for Massachusetts Seniors

Get financial aid guidance

Home Care Program

MassHealth Home Care

Age 60+, Massachusetts resident, at risk of nursing home placement.

~$1,500/month (individual, varies by region).

$2,000 (individual, excludes home, car).

Coordinated through Aging Services Access Points (ASAPs); high demand in urban areas.

Frail Elder Waiver

Massachusetts Medicaid FE Waiver

Age 65+, Massachusetts resident, Medicaid-eligible, nursing home-level care need.

~$2,829/month (300% FBR, individual).

$2,000 (individual), $3,000 (couple).

Requires clinical eligibility determination.

Senior Care Options (SCO)

Massachusetts Senior Care Options

Age 65+, Massachusetts resident, eligible for MassHealth (Medicare optional), nursing home-level care need.

~$2,829/month (300% FBR, individual); QIT allowed.

$2,000 (individual), $3,000 (couple) (excludes home up to $713,000, car).

Not available in Dukes/Nantucket Counties; multiple SCO providers (e.g., CCA, Tufts).

Medicare Savings Program (MSP)

Massachusetts Medicare Savings Program (MassHealth Buy-In)

Age 65+ or disabled, Massachusetts resident, Medicare Part A/B.

~$2,510/month (QMB), ~$3,380/month (SLMB), ~$3,598/month (QI)—individual.

$9,430 (individual), $14,130 (couple).

Three tiers; no waitlist; includes Extra Help for Part D.

National Family Caregiver Support Program (NFCSP) Respite

Massachusetts NFCSP Respite Care

Caregivers of 60+ needing care or 55+ caregivers of others; Massachusetts resident; functional needs (2+ ADLs).

Prioritizes ~$24,980/year (individual); no strict cap.

Not assessed; need-based.

27 ASAPs; prioritizes low-income, rural caregivers.

Prescription Advantage

Massachusetts Prescription Advantage

Age 65+ or disabled, Massachusetts resident, enrolled in Medicare Part D (or ineligible for Medicare).

No strict limit; copays vary by income (~$24,980-$75,000/year individual).

Not assessed.

Supplements Medicare Part D; no enrollment fee for low-income.

Senior Community Service Employment Program (SCSEP)

Massachusetts SCSEP

Age 55+, unemployed, low-income, Massachusetts resident.

~$1,983/month (125% FPL).

Not specified; income-focused.

Priority for veterans, rural residents; AARP partnership.

VA Aid and Attendance (A&A) and Housebound Benefits

Massachusetts VA Aid and Attendance/Housebound

Age 65+ or disabled veteran/spouse, Massachusetts resident, wartime service, need for ADL help (A&A) or homebound.

Net income < ~$1,984/month (veteran with dependent, A&A); pension offsets income.

~$155,356 (net worth limit).

High veteran demand statewide.

Tour Icon
Planning a tour? Check our touring checklist.
Chat Icon
Thinking of living here? We can help you speak to a current resident