


Total health inspections
5
Nevada average 5.1
Last Health inspection on Aug 2025
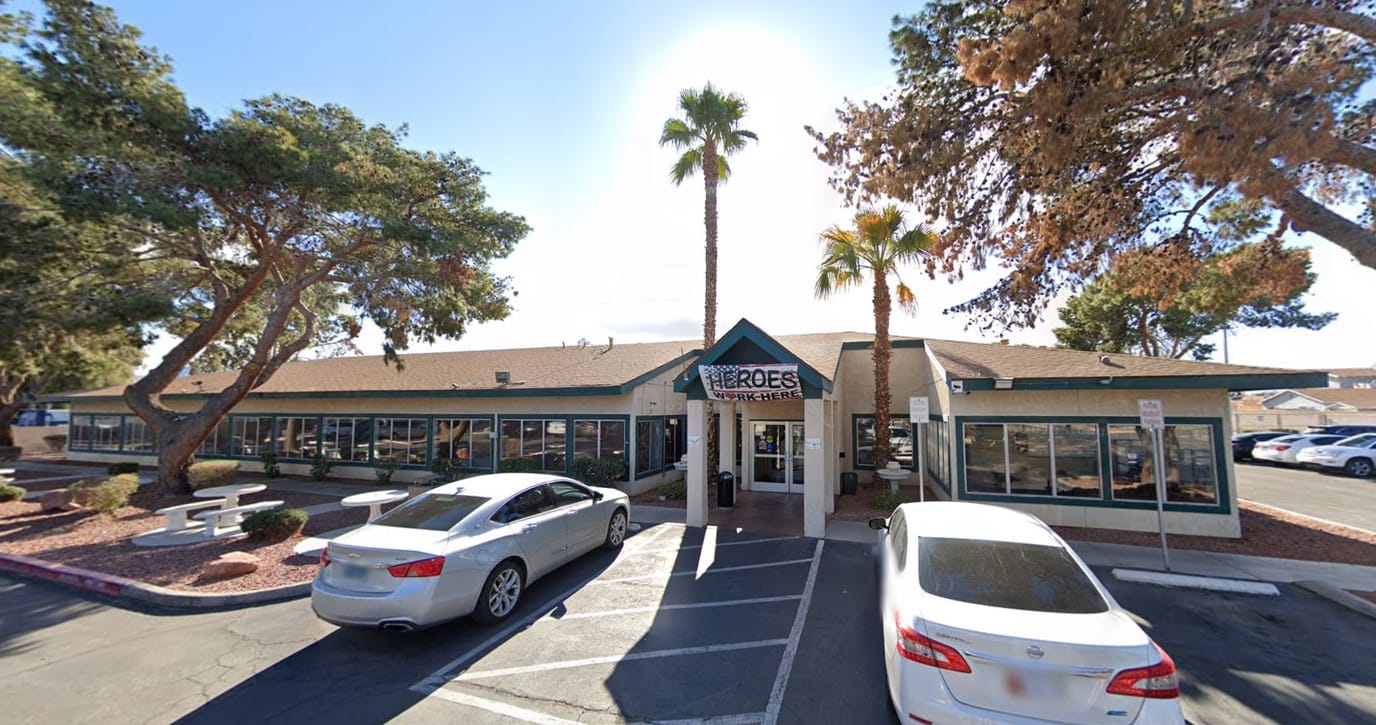
North Las Vegas Care Center is situated right on East Cheyenne Avenue in North Las Vegas. It’s an 182-bed, single-story facility managed by Mistie Montes. They’ve really carved out a niche for nursing home and hospice care. With an occupancy rate of around 85% and an average stay of about 294 days, it definitely leans more toward long-term residency than a place people just stop by for a quick rehab stint.
They offer 3 hours and 22 minutes of nursing care per person, per day. That’s broken down into 27 minutes of RN time, 56 minutes of LPN/LVN care, and 2 hours and 9 minutes from nurse aides. They have contracted teams for physical, occupational, speech, and respiratory therapy, too. They have an active Resident Council. It’s a really necessary structural check to make sure the people living there actually have a voice in their own daily experience.
Financially, it’s accessible since they take Medicare, Medicaid, and private pay. It’s about 2 miles from the city center, and with a Walk Score of 62, you can reasonably get to some errands without a car, though keeping a vehicle handy is probably the smarter bet.
Regarding their history, state inspections have been looking at the fundamentals: how they handle medication, keep up with care plans, manage food service, and uphold resident rights. If you’re trying to navigate the search for a large-scale facility in the area that balances long-term care with hospice, this place is essentially the standard, functional option.
Staffing hours
![]() Daily nursing hours per resident by staff type, reported to CMS. Higher is generally better — compare this facility to state and national averages to see where staffing stands.
Daily nursing hours per resident by staff type, reported to CMS. Higher is generally better — compare this facility to state and national averages to see where staffing stands.
Hours per resident per day vs Nevada averages
Total nursing care
![]() This home is ranked 24th out of 40 homes in Nevada for nurse hours. Total adjusted nursing hours per resident per day, combining RN, LPN, and aide time. CMS adjusts this for case-mix so facilities can be fairly compared.
This home is ranked 24th out of 40 homes in Nevada for nurse hours. Total adjusted nursing hours per resident per day, combining RN, LPN, and aide time. CMS adjusts this for case-mix so facilities can be fairly compared.
3h 22m
17% below state avg5 of 6 metrics below state avg
North Las Vegas Care Center is administered by Mistie Montes.
In Nevada, the Department of Health and Human Services, Bureau of Health Care Quality and Compliance performs unannounced onsite surveys to evaluate resident safety and care quality.
Deficiencies
| This Facility | NV Average | vs. NV Avg |
|---|---|---|---|
|
Total deficiencies
| 459 | 62 | This facility has 640% more total deficiencies than a typical Nevada nursing home (459 vs. NV avg 62).↑ 640% worse |
Inspections
| This Facility | NV Average | vs. NV Avg |
|---|---|---|---|
|
Total inspections
| 101 | 21 | This facility has had 381% more total inspections than the Nevada average (101 vs. NV avg 21). More inspections can mean more regulatory scrutiny rather than worse care.↑ 381% more |
Nevada average 5.1
Last Health inspection on Aug 2025
Nevada average 36.2
Nevada average 7.08
Health citations are formal notices following inspections when they fail to comply with safety and care standards.
27 of 34 citations resulted from standard inspections; 4 of 34 resulted from complaint investigations; and 3 of 34 came from combined inspections (standard and complaint).
Nevada average: 0.1
Nevada average: 0.5
Reporting period: October 1 – December 31, 2025 (Q4 2025). Source: CMS Payroll-Based Journal report.
Manages medical care and health needs.
Assists with medical care and medications.
Helps with daily care and mobility.
Total hours from contractors
5,823 contractor hours this quarter
| Certified Nursing Assistant | 73 | 10 | 83 | 30,037 | 92 | 100% | 9.7 |
| Licensed Practical Nurse | 29 | 8 | 37 | 11,173 | 92 | 100% | 9.4 |
| Registered Nurse | 13 | 0 | 13 | 4,835 | 92 | 100% | 11 |
| RN Director of Nursing | 5 | 0 | 5 | 1,817 | 67 | 73% | 8.4 |
| Speech Language Pathologist | 0 | 3 | 3 | 1,560 | 71 | 77% | 8.9 |
| Physical Therapy Aide | 0 | 3 | 3 | 1,524 | 79 | 86% | 8.6 |
| Other Dietary Services Staff | 3 | 0 | 3 | 1,447 | 91 | 99% | 7.8 |
| Respiratory Therapy Technician | 0 | 3 | 3 | 1,102 | 77 | 84% | 9.5 |
| Clinical Nurse Specialist | 4 | 1 | 5 | 1,053 | 68 | 74% | 8.4 |
| Mental Health Service Worker | 2 | 0 | 2 | 804 | 81 | 88% | 7.8 |
| Physical Therapy Assistant | 0 | 2 | 2 | 728 | 72 | 78% | 7.3 |
| Qualified Social Worker | 0 | 3 | 3 | 544 | 61 | 66% | 8.9 |
| Dietitian | 1 | 0 | 1 | 502 | 66 | 72% | 7.6 |
| Dental Services Staff | 1 | 0 | 1 | 500 | 54 | 59% | 9.3 |
| Nurse Practitioner | 1 | 0 | 1 | 464 | 58 | 63% | 8 |
| Administrator | 1 | 0 | 1 | 432 | 54 | 59% | 8 |
| Occupational Therapy Aide | 1 | 0 | 1 | 373 | 48 | 52% | 7.8 |
| Occupational Therapy Assistant | 0 | 1 | 1 | 70 | 13 | 14% | 5.4 |
| Medical Director | 0 | 1 | 1 | 26 | 26 | 28% | 1 |
Includes penalties issued in 2023
Federal penalties imposed by CMS for regulatory violations, including civil money penalties (fines) and denials of payment for new Medicare/Medicaid admissions.
Source: CMS Penalties Database (Data as of Jan 2026)
Nevada average: $34K
Nevada average: 1.4
Nevada average: 0.1
Penalties are imposed by CMS for violations of federal nursing home regulations.
1 penalty in the past 3 years
Sep 1, 2023 · $9K
Last updated: Jan 2026
These measures show how residents usually do over time at this home, based on health outcomes and preventive care.
Nevada average: 9.7
Nevada average: 17.5
Nevada average: 15.6%
Nevada average: 20.8%
Nevada average: 16.9%
Nevada average: 2.5%
Nevada average: 5.5%
Nevada average: 1.4%
Nevada average: 5.4%
Nevada average: 4.2%
Nevada average: 14.1%
Nevada average: 91.0%
Nevada average: 89.6%
Nevada average: 1.82
Nevada average: 1.50
Nevada average: 83.9%
Nevada average: 2.0%
Nevada average: 80.7%
Nevada average: 23.4%
Nevada average: 9.8%
Nevada average: 0.8%
Nevada average: 53.7%
Nevada average: 50.6%
Quality measures are calculated from Minimum Data Set (MDS) assessments. For most measures, lower percentages indicate better care quality.
15% of new residents, usually for short-term rehab.
7% of new residents, often for short stays.
78% of new residents, often for long-term daily care.
Source: CMS Long-Term Care Facility Characteristics (Data as of Jan 2026)
Residents meet regularly to discuss policies, care quality, and activities
Organized group of residents that meets regularly to discuss facility policies, quality of life, and activities.
Data sourced from CMS Long-Term Care Facility Characteristics quarterly report. Payer mix reflects the current resident census by primary payment source.
Historical financial and operational data for North Las Vegas Care Center from 2012–2024, based on CMS SNF Cost Reports.
Key figures below are for fiscal year ending in 05/2024.
Based on CMS SNF Cost Report for fiscal year ending in 05/2024.
No pets allowed
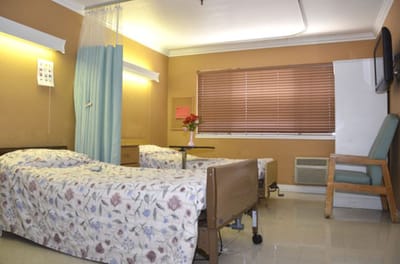
Housing Options: Private Rooms / Semi-Private Rooms
Building Type: Single-story
Transportation Services
Fitness and Recreation
Most residents stay for extended periods and receive ongoing daily care.
Most new residents arrive under Medicaid (78% of admissions), and a typical Medicaid stay runs around 11 - 12 months.
Coverage residents most often arrive under.
Coverage residents most often leave under.
![]() 2.3 miles from city center
2.3 miles from city center
![]() Estimated distance in miles from North Las Vegas's city center to North Las Vegas Care Center's address, calculated via Google Maps.
Estimated distance in miles from North Las Vegas's city center to North Las Vegas Care Center's address, calculated via Google Maps.
Add your location
Info below is compiled from CMS reports & the NV Dept. of Health & Human Services, senior community websites & trusted data sources such as Walk Score & BBB.
Communities are listed from highest to lowest based on our ranking methodology.
| Advanced Health Care Of Paradise | NH SNF | Las Vegas | 38
Facility
38
NV AVG
41
Rank
#96 / 319 |
92.1%
Facility
92.1%
NV AVG
79.4
Rank
#71 / 262 | +16% | 4.06
Facility
4.06
NV AVG
4.03
Rank
#5 / 40 | +38% | +1% | $0
Facility
$0
NV AVG
$34.1k
Rank
#1 / 42 | 22
Facility
22
NV AVG
36.2
Rank
#5 / 42 | 5.5
Facility
5.5
NV AVG
7.1
Rank
#11 / 42 | - | 35 | A+ |
76
Facility
76
NV AVG
46
Rank
#16 / 404 | Jason Gubler | $10.6MFiscal year ending 12/2023
Facility
$10.6MFiscal year ending 12/2023
NV AVG
$17.4M
Rank
#31 / 36 | $4.9MFiscal year ending 12/2023
Facility
$4.9MFiscal year ending 12/2023
NV AVG
$8.9M
Rank
#30 / 36 | 46.6%Fiscal year ending 12/2023
Facility
46.6%Fiscal year ending 12/2023
NV AVG
52.4%
Rank
#29 / 36 | 295107 | ||||
| College Park Rehabilitation Center | NH HOS SNF | North Las Vegas (East Cheyenne Avenue) | 98
Facility
98
NV AVG
41
Rank
#62 / 319 |
83.7%
Facility
83.7%
NV AVG
79.4
Rank
#124 / 262 | +5% | 2.78
Facility
2.78
NV AVG
4.03
Rank
#39 / 40 | +9% | -31% | $7.4k
Facility
$7.4k
NV AVG
$34.1k
Rank
#27 / 42 | 19
Facility
19
NV AVG
36.2
Rank
#2 / 42 | 3.8
Facility
3.8
NV AVG
7.1
Rank
#3 / 42 | - | 82 | - |
46
Facility
46
NV AVG
46
Rank
#220 / 404 | Lauren Aufiero | $13.8MFiscal year ending 12/2023
Facility
$13.8MFiscal year ending 12/2023
NV AVG
$17.4M
Rank
#26 / 36 | $7.5MFiscal year ending 12/2023
Facility
$7.5MFiscal year ending 12/2023
NV AVG
$8.9M
Rank
#26 / 36 | 54.1%Fiscal year ending 12/2023
Facility
54.1%Fiscal year ending 12/2023
NV AVG
52.4%
Rank
#12 / 36 | 295055 | ||||
| The Heights of Summerlin, Llc | NH HOS RC SNF | Las Vegas (Summerlin North) | 190
Facility
190
NV AVG
41
Rank
#6 / 319 |
82.6%
Facility
82.6%
NV AVG
79.4
Rank
#136 / 262 | +4% | 3.60
Facility
3.60
NV AVG
4.03
Rank
#15 / 40 | -6% | -11% | $0
Facility
$0
NV AVG
$34.1k
Rank
#1 / 42 | 35
Facility
35
NV AVG
36.2
Rank
#22 / 42 | 7.0
Facility
7.0
NV AVG
7.1
Rank
#20 / 42 | - | 157 | B- |
67
Facility
67
NV AVG
46
Rank
#62 / 404 | - | $19.1MFiscal year ending 12/2023
Facility
$19.1MFiscal year ending 12/2023
NV AVG
$17.4M
Rank
#15 / 36 | $9.6MFiscal year ending 12/2023
Facility
$9.6MFiscal year ending 12/2023
NV AVG
$8.9M
Rank
#15 / 36 | 50.4%Fiscal year ending 12/2023
Facility
50.4%Fiscal year ending 12/2023
NV AVG
52.4%
Rank
#21 / 36 | 295083 | ||||
| North Las Vegas Care Center | NH HOS SNF | North Las Vegas | 182
Facility
182
NV AVG
41
Rank
#9 / 319 | - | - | 3.37
Facility
3.37
NV AVG
4.03
Rank
#24 / 40 | -49% | -17% | $9.3k
Facility
$9.3k
NV AVG
$34.1k
Rank
#29 / 42 | 34
Facility
34
NV AVG
36.2
Rank
#19 / 42 | 6.8
Facility
6.8
NV AVG
7.1
Rank
#19 / 42 | 1 | 31 | C+ |
62
Facility
62
NV AVG
46
Rank
#96 / 404 | Mistie Montes | $19.9MFiscal year ending 05/2024
Facility
$19.9MFiscal year ending 05/2024
NV AVG
$17.4M
Rank
#13 / 36 | $9.2MFiscal year ending 05/2024
Facility
$9.2MFiscal year ending 05/2024
NV AVG
$8.9M
Rank
#19 / 36 | 46.4%Fiscal year ending 05/2024
Facility
46.4%Fiscal year ending 05/2024
NV AVG
52.4%
Rank
#31 / 36 | 295036 |
North Las Vegas Care Center is located in North Las Vegas, Nevada.
Here are the financial assistance programs available to residents in Nevada.
North Las Vegas Care Center has a walk score of 62. Moderately walkable. Some errands can be accomplished on foot, with a mix of nearby amenities.
According to NV state health department records, North Las Vegas Care Center's license expires on December 31, 2026.
North Las Vegas Care Center's occupancy is 85.3%.
North Las Vegas Care Center has been operating for approximately 29 years, based on available licensing and registration records.
No, North Las Vegas Care Center has a no-pet policy.
North Las Vegas Care Center is registered as a for-profit in NV.
Mistie Montes is the administrator of North Las Vegas Care Center.
Care Cost Calculator: See Prices in Your Area
Nursing Home Data Explorer
Don’t Wait Too Long: 7 Red Flag Signs Your Parent Needs Assisted Living Now
The True Cost of Assisted Living in 2025 – And How Families Are Paying For It
Understanding Senior Living Costs: Pricing Models, Discounts & Financial Assistance


