Total health inspections
3
Ohio average 6.7
Last Health inspection on Oct 2025

We arrange tours, appointments, and even moving support so you don’t have to
Thank you for your interest!
Our team will be in touch shortly to help with next steps.

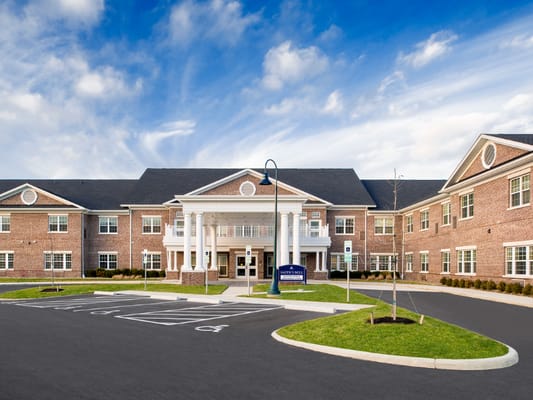
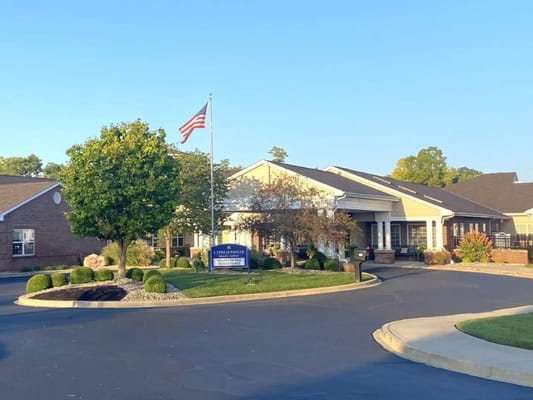
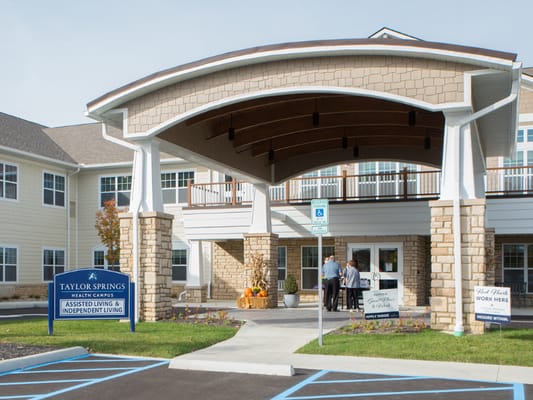
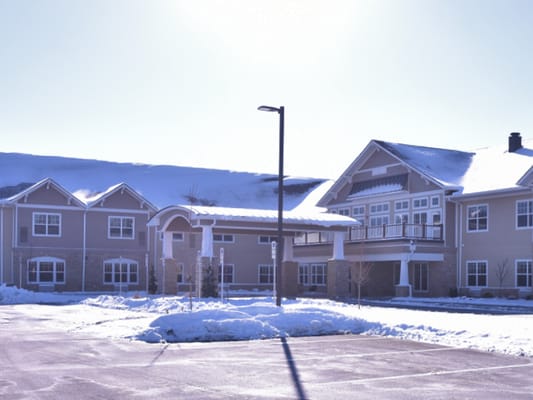
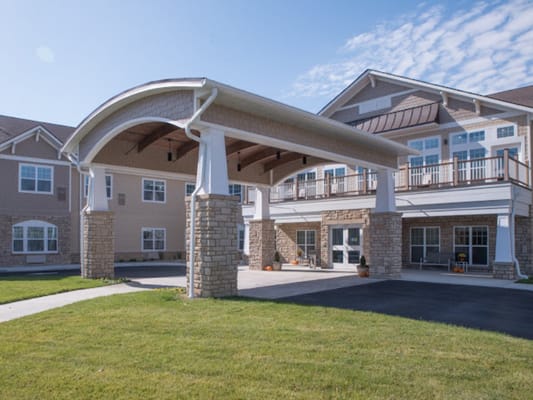
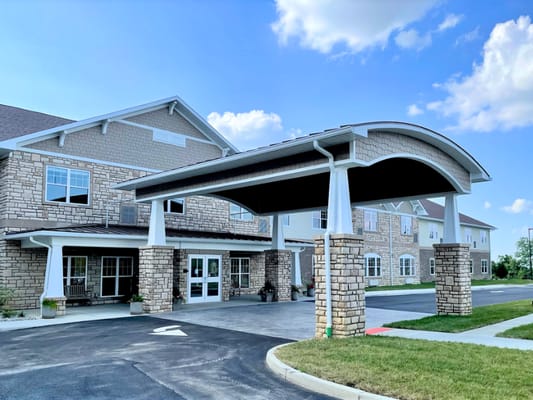
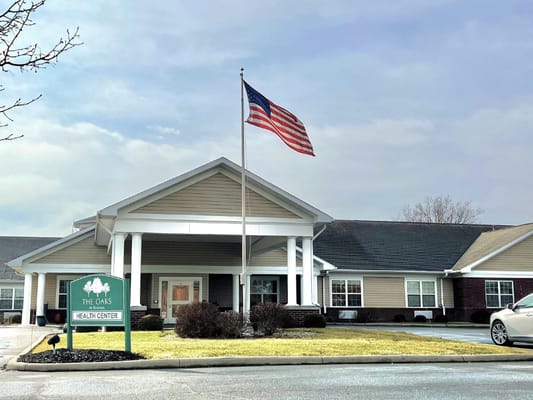
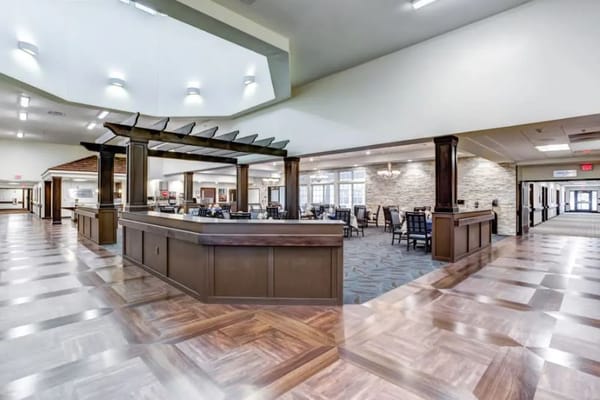
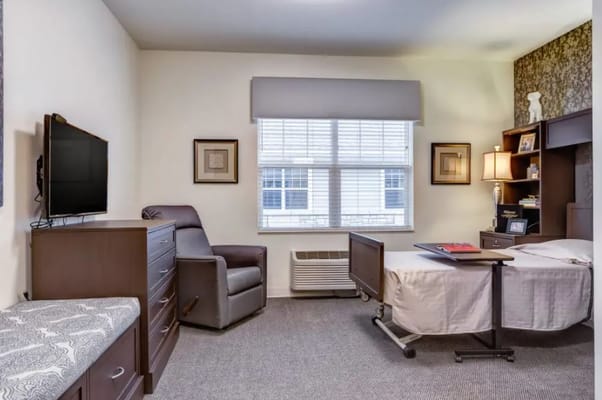


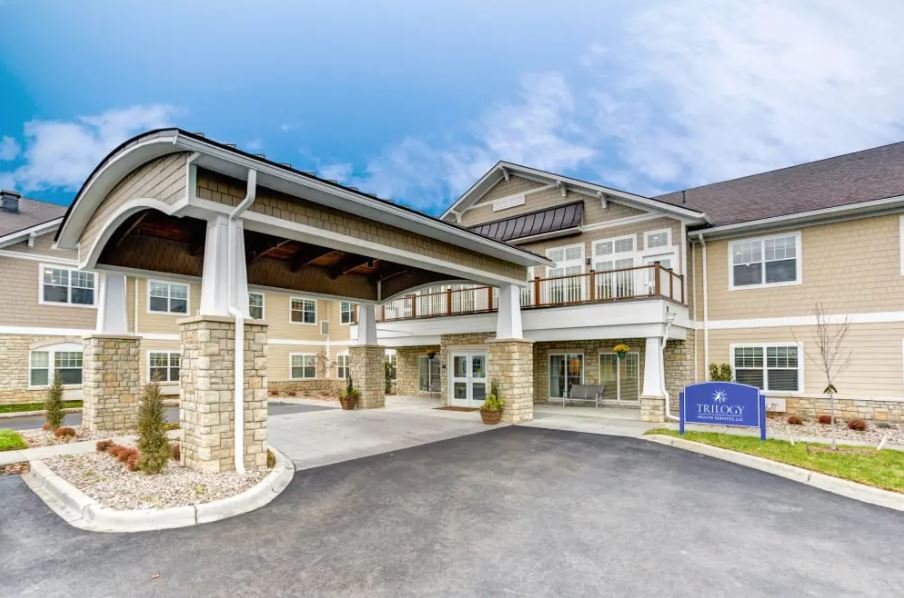
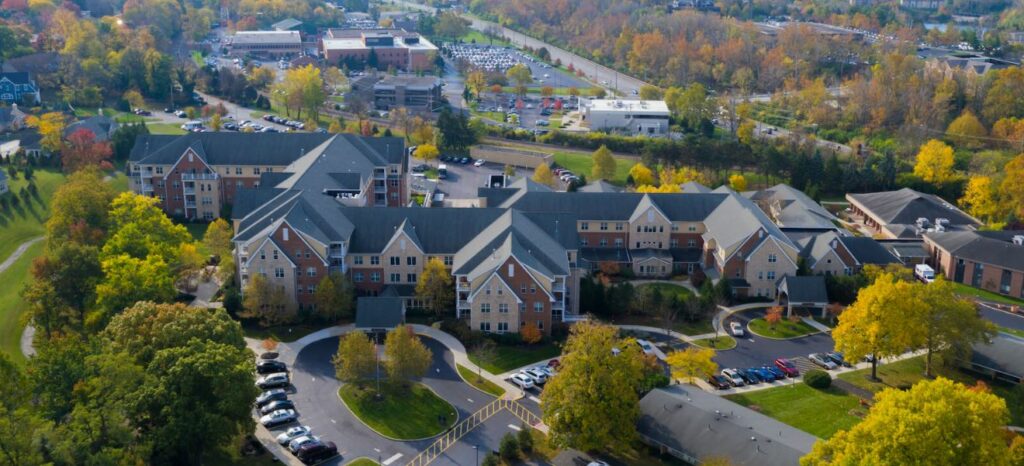
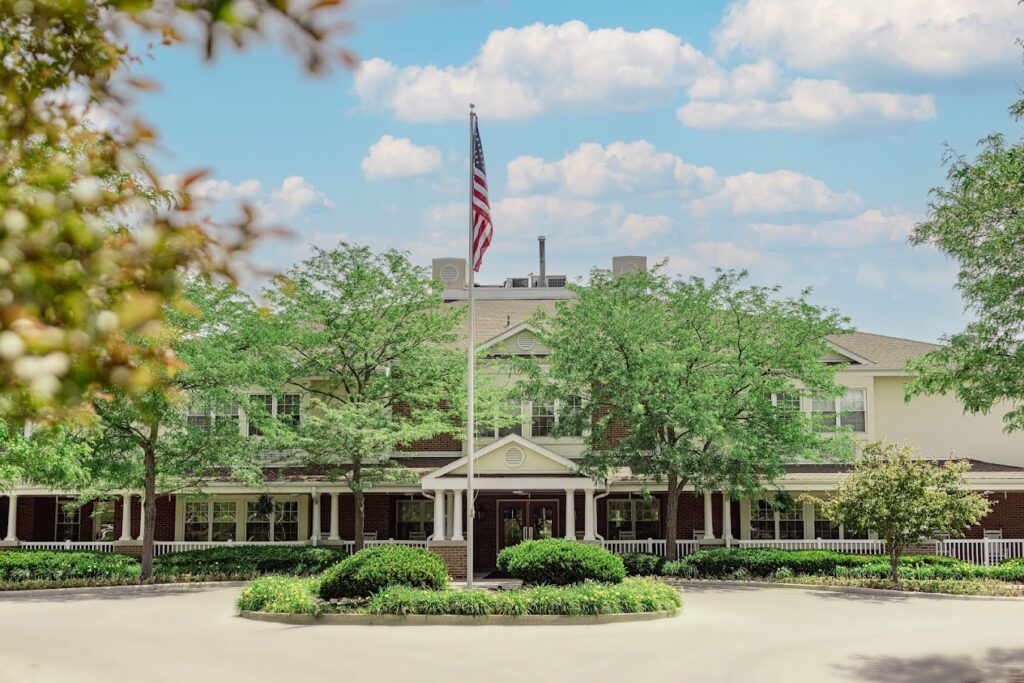
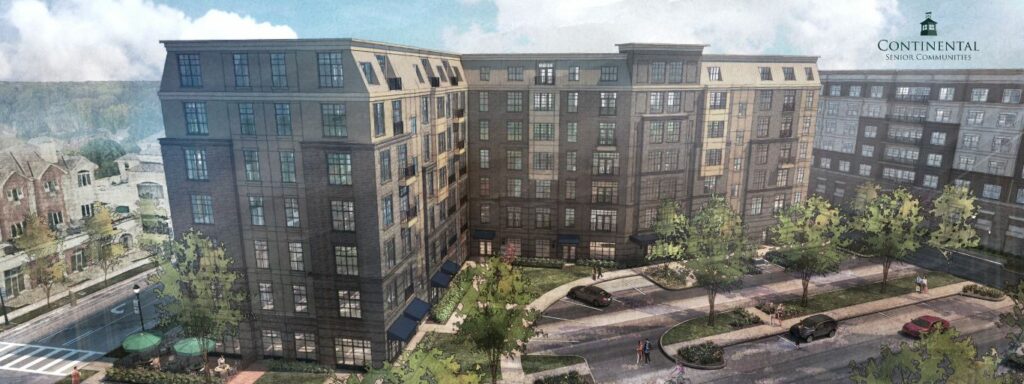
Situated in the peaceful neighborhood of Library Way, Hilliard, OH, Norwich Springs Health Campus is an eminent senior living community that offers assisted living, independent living, memory care, and skilled nursing. The community features snug and sophisticated private suites to ensure seniors’ relaxation and security. With a team of reliable and highly skilled professionals delivering top-tier care and assistance around the clock, seniors keep their peace of mind and experience a glorious retirement.
Create unforgettable moments and participate in engaging activities for leisure and wellness. Ideally situated near local amenities and stunning attractions, Norwich Springs Health Campus ensures seniors’ needs and interests are within a few steps away. Eat well and feel good with healthy and tasty foods catering to dietary needs and preferences. Surrounded by ethereal landscapes and serene walking paths, Norwich Springs Health Campus is ideal for seniors seeking solace in their golden years.
May offer a more intimate, personalized care environment.
Lower occupancy suggests more openings may be available.
This home supports both short-term rehab and long-term care, with residents staying for a wide range of durations.
46% of new residents, usually for short-term rehab.
50% of new residents, often for short stays.
4% of new residents, often for long-term daily care.
Housing Options: Studio / 1 Bed
Building Type: 2-story
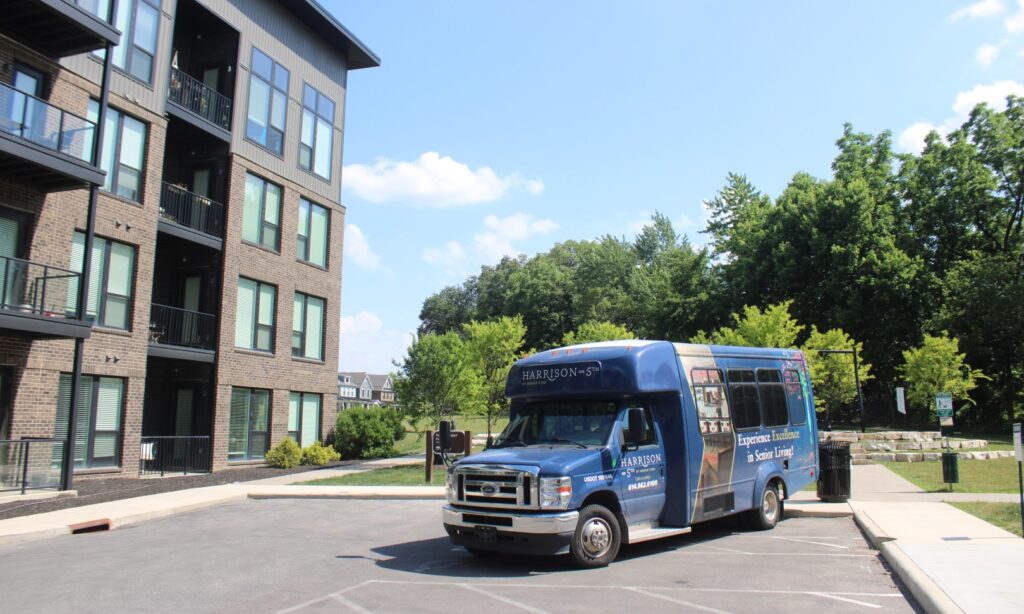
Transportation Services
Fitness and Recreation
Ways to qualify for care at this community, including accepted programs and payment options.
This facility is certified for eligible Medicare services.
In Ohio, the Department of Health, Bureau of Survey and Certification conducts unannounced onsite inspections to evaluate the quality of care and environment in all licensed facilities.
Citations indicate regulatory violations. A higher number implies the facility had several areas requiring improvement.
Ohio average: 2 citations
Every two years, the Ohio Department of Aging and the Office of the State Long-Term Care Ombudsman organizations conduct a satisfaction survey among residents in long-term care facilities to assess their quality of care and life.
Ohio average: 86 / 100
Ohio average: 89 / 100
Ohio average: 95 / 100
Ohio average: 82 / 100
Ohio average: 86 / 100
Ohio average: 89 / 100
Ohio average: 80 / 100
Ohio average: 81 / 100
Based on the RCF Resident Satisfaction Survey 2022-23, Final Results
Have you gotten or are you getting physical therapy, occupational therapy or speech therapy, while living at this care facility?
This facility44/100
Ohio average46/100
Did (Do) you know who to speak to about your therapy progress?
This facility100/100
Ohio average85/100
Did (Does) the therapy help you meet your goals?
This facility100/100
Ohio average88/100
Can you decide how to spend your day?
This facility100/100
Ohio average94/100
Did (Do) the therapists help you set goals?
This facility100/100
Ohio average89/100
Scores represent percent of positive resident responses for each item, excluding "don't know" and "not applicable" responses and instances where the question was skipped.
Based on the RCF Resident Satisfaction Survey 2022-23, Final Results
Are your personal items safe here?
This facility76/100
Ohio average92/100
Can you enjoy the outdoors if you want to?
This facility81/100
Ohio average91/100
Can you find a place to be alone if you want to be alone?
This facility94/100
Ohio average96/100
Is it very clean here?
This facility94/100
Ohio average96/100
Is it easy for you to get around in your room (or apartment)?
This facility94/100
Ohio average96/100
Do you feel safe here?
This facility100/100
Ohio average98/100
Are you able to get around the building if you want to?
This facility100/100
Ohio average95/100
Do you feel you have enough privacy?
This facility100/100
Ohio average95/100
Scores represent percent of positive resident responses for each item, excluding "don't know" and "not applicable" responses and instances where the question was skipped.
Based on the RCF Resident Satisfaction Survey 2022-23, Final Results
Did you receive a thorough orientation to NORWICH SPRINGS HEALTH CAMPUS?
This facility57/100
Ohio average70/100
Were you given enough information to learn how things work here?
This facility75/100
Ohio average82/100
Did you feel warmly welcomed as a new resident?
This facility100/100
Ohio average93/100
Scores represent percent of positive resident responses for each item, excluding "don't know" and "not applicable" responses and instances where the question was skipped.
Based on the RCF Resident Satisfaction Survey 2022-23, Final Results
Do the people who work here tell you when rules, policies, and procedures change?
This facility62/100
Ohio average78/100
Are you friends with anyone who lives here?
This facility71/100
Ohio average81/100
Are you encouraged to speak up about things you don’t like here?
This facility79/100
Ohio average81/100
Do the people who work here help you with technology, if needed?
This facility79/100
Ohio average89/100
Do the people who work here go above and beyond to give you a good life?
This facility88/100
Ohio average87/100
Are your concerns taken care of in a timely way?
This facility94/100
Ohio average86/100
Do the people who work here seem happy to work here?
This facility94/100
Ohio average92/100
Overall, are you satisfied with the care you receive here?
This facility100/100
Ohio average94/100
Are you as involved in decisions about your care as you want to be?
This facility100/100
Ohio average85/100
Would you highly recommend NORWICH SPRINGS HEALTH CAMPUS to someone who needs this type of care?
This facility100/100
Ohio average89/100
Scores represent percent of positive resident responses for each item, excluding "don't know" and "not applicable" responses and instances where the question was skipped.
Based on the RCF Resident Satisfaction Survey 2022-23, Final Results
Do the same people take care of you most of the time?
This facility63/100
Ohio average84/100
Do the people who care for you explain your care and services to you?
This facility80/100
Ohio average85/100
Do the people who work here do things the way you want them done?
This facility88/100
Ohio average88/100
Do you feel confident the people who work here would come quickly anytime you needed help?
This facility88/100
Ohio average85/100
Do you have opportunities to maintain your health and wellness, if you want?
This facility88/100
Ohio average92/100
Are the people who work here knowledgeable about your medical conditions and treatments?
This facility92/100
Ohio average90/100
Do the people who work here do everything they can to protect you from getting sick?
This facility93/100
Ohio average94/100
Do the people who work here check on you often enough to see if you need anything?
This facility94/100
Ohio average81/100
Do the people who work here support you to do as much for yourself as you are able to do?
This facility94/100
Ohio average96/100
Do the people who work here ever get angry at you?
This facility94/100
Ohio average88/100
Do the people who work here make sure you are comfortable when they provide care or services?
This facility100/100
Ohio average95/100
Scores represent percent of positive resident responses for each item, excluding "don't know" and "not applicable" responses and instances where the question was skipped.
Based on the RCF Resident Satisfaction Survey 2022-23, Final Results
Are there enjoyable things to do on the weekends, if you want?
This facility75/100
Ohio average63/100
Do you have enough opportunities to go on outings and special events?
This facility80/100
Ohio average73/100
Do you have something to look forward to most days?
This facility81/100
Ohio average77/100
Are you as connected to the community as you want to be?
This facility88/100
Ohio average71/100
Do you feel included in life here?
This facility88/100
Ohio average89/100
Do you usually enjoy how you spend your time?
This facility88/100
Ohio average87/100
Do you like the activities here?
This facility94/100
Ohio average83/100
Do you have plenty of opportunities to do things that are meaningful to you?
This facility100/100
Ohio average83/100
Are you able to do the activities offered here, if you want?
This facility100/100
Ohio average93/100
Scores represent percent of positive resident responses for each item, excluding "don't know" and "not applicable" responses and instances where the question was skipped.
Based on the RCF Resident Satisfaction Survey 2022-23, Final Results
Do you have input on the food that is served?
This facility77/100
Ohio average68/100
Do you get enough fresh food options here?
This facility88/100
Ohio average81/100
Does the menu change often enough?
This facility93/100
Ohio average77/100
Do you look forward to mealtimes?
This facility94/100
Ohio average80/100
Do you get enough to eat here?
This facility100/100
Ohio average95/100
Do you like the food here?
This facility100/100
Ohio average81/100
Scores represent percent of positive resident responses for each item, excluding "don't know" and "not applicable" responses and instances where the question was skipped.
Ohio average 6.7
Last Health inspection on Oct 2025
Ohio average 30.9
Ohio average 4.59
Health citations are formal notices following inspections when they fail to comply with safety and care standards.
9 of 12 citations resulted from standard inspections; and 3 of 12 resulted from complaint investigations.
Ohio average: 0.3
Ohio average: 0.9
Data sourced from CMS Health Deficiencies reports. Citation severity codes range from A (least serious) to L (most serious). Immediate Jeopardy (J-L) citations indicate situations where the facility's noncompliance has placed residents at risk of death or serious harm.
Nursing Home Licensed facility providing 24/7 skilled nursing care for residents with complex, ongoing medical needs. Staffed by RNs, LPNs, and CNAs. Inspected and star-rated annually by CMS. Accepts Medicare (short-term rehab) and Medicaid (long-term care).
Assisted Living A licensed, long-term care setting for seniors or individuals with disabilities who need help with daily activities — like bathing, dressing, and medication management — but not 24-hour skilled nursing. Offers housing, meals, and around-the-clock support while aiming to maximize resident independence.
Independent Living Lifestyle-focused communities for older adults offering dining, activities, and transportation with minimal personal care. Best for active, independent seniors who want community without medical support.
Memory Care Secured, specialized care for people living with Alzheimer's or dementia. Staff trained in cognitive impairment, with higher staff-to-resident ratios and an environment designed to reduce confusion and wandering risk.
Nursing Home Licensed facility providing 24/7 skilled nursing care for residents with complex, ongoing medical needs. Staffed by RNs, LPNs, and CNAs. Inspected and star-rated annually by CMS. Accepts Medicare (short-term rehab) and Medicaid (long-term care).
Assisted Living A licensed, long-term care setting for seniors or individuals with disabilities who need help with daily activities — like bathing, dressing, and medication management — but not 24-hour skilled nursing. Offers housing, meals, and around-the-clock support while aiming to maximize resident independence.
Memory Care Secured, specialized care for people living with Alzheimer's or dementia. Staff trained in cognitive impairment, with higher staff-to-resident ratios and an environment designed to reduce confusion and wandering risk.
Assisted Living A licensed, long-term care setting for seniors or individuals with disabilities who need help with daily activities — like bathing, dressing, and medication management — but not 24-hour skilled nursing. Offers housing, meals, and around-the-clock support while aiming to maximize resident independence.
Independent Living Lifestyle-focused communities for older adults offering dining, activities, and transportation with minimal personal care. Best for active, independent seniors who want community without medical support.
Memory Care Secured, specialized care for people living with Alzheimer's or dementia. Staff trained in cognitive impairment, with higher staff-to-resident ratios and an environment designed to reduce confusion and wandering risk.
Assisted Living A licensed, long-term care setting for seniors or individuals with disabilities who need help with daily activities — like bathing, dressing, and medication management — but not 24-hour skilled nursing. Offers housing, meals, and around-the-clock support while aiming to maximize resident independence.
Independent Living Lifestyle-focused communities for older adults offering dining, activities, and transportation with minimal personal care. Best for active, independent seniors who want community without medical support.
![]() 17.5 miles from city center
17.5 miles from city center
Add your location
This data corresponds to Q2 2025 and is based on CMS Payroll-Based Journal.
Ohio average ratio: 2.14:1
Ohio average: 8.1 hours
Manages medical care and health needs.
No contractors work on this role.
Assists with medical care and medications.
No contractors work on this role.
Helps with daily care and mobility.
No contractors work on this role.
Total hours from contractors
2,845 contractor hours this quarter
| Certified Nursing Assistant | 27 | 0 | 27 | 7,504 | 91 | 100% | 8.9 |
| Registered Nurse | 12 | 0 | 12 | 3,920 | 91 | 100% | 9.7 |
| Licensed Practical Nurse | 11 | 0 | 11 | 3,237 | 91 | 100% | 9.7 |
| Other Dietary Services Staff | 8 | 0 | 8 | 2,870 | 91 | 100% | 8.1 |
| Clinical Nurse Specialist | 6 | 0 | 6 | 1,051 | 64 | 70% | 7.8 |
| Speech Language Pathologist | 0 | 4 | 4 | 854 | 70 | 77% | 6.5 |
| Nurse Aide in Training | 5 | 0 | 5 | 682 | 65 | 71% | 8.4 |
| RN Director of Nursing | 2 | 0 | 2 | 561 | 66 | 73% | 8.3 |
| Dietitian | 1 | 0 | 1 | 557 | 62 | 68% | 9 |
| Mental Health Service Worker | 1 | 0 | 1 | 546 | 65 | 71% | 8.4 |
| Physical Therapy Assistant | 0 | 2 | 2 | 537 | 76 | 84% | 7 |
| Administrator | 1 | 0 | 1 | 496 | 62 | 68% | 8 |
| Qualified Social Worker | 0 | 3 | 3 | 490 | 63 | 69% | 7.6 |
| Physical Therapy Aide | 0 | 2 | 2 | 467 | 64 | 70% | 7.3 |
| Respiratory Therapy Technician | 0 | 4 | 4 | 448 | 62 | 68% | 6.9 |
| Nurse Practitioner | 1 | 0 | 1 | 441 | 51 | 56% | 8.7 |
| Medical Director | 0 | 1 | 1 | 49 | 51 | 56% | 1 |
| Occupational Therapy Assistant | 1 | 0 | 1 | 33 | 45 | 49% | 0.7 |
Source: CMS Long-Term Care Facility Characteristics (Data as of Jan 2026)
Residents meet regularly to discuss policies, care quality, and activities
Family members meet regularly to discuss policies, care quality, and activities
Part of a Continuing Care Retirement Community offering multiple care levels
Organized group of family members that meets regularly to discuss facility policies, resident care, and activities.
Organized group of residents that meets regularly to discuss facility policies, quality of life, and activities.
Data sourced from CMS Long-Term Care Facility Characteristics quarterly report. Payer mix reflects the current resident census by primary payment source.
These measures show how residents usually do over time at this home, based on health outcomes and preventive care.
Ohio average: 5.8
Ohio average: 12.7
Ohio average: 6.8%
Ohio average: 22.0%
Ohio average: 3.4%
Ohio average: 3.9%
Ohio average: 0.5%
Ohio average: 6.2%
Ohio average: 24.0%
Ohio average: 8.4%
Ohio average: 92.4%
Ohio average: 94.5%
Ohio average: 78.0%
Ohio average: 1.3%
Ohio average: 75.6%
Quality measures are calculated from Minimum Data Set (MDS) assessments. For most measures, lower percentages indicate better care quality.
Historical financial and operational data for Norwich Springs Health Campus based on CMS SNF Cost Reports.
Loading trend charts...
Care Cost Calculator: See Prices in Your Area
Nursing Home Data Explorer
Don’t Wait Too Long: 7 Red Flag Signs Your Parent Needs Assisted Living Now
The True Cost of Assisted Living in 2025 – And How Families Are Paying For It
Understanding Senior Living Costs: Pricing Models, Discounts & Financial Assistance
Touring a community? Use this expert-backed checklist to stay organized, ask the right questions, and find the perfect fit.
We'll send you a PDF version of the touring checklist.