Peachtree Centre

Senior Communities Home
Overview of Peachtree Centre

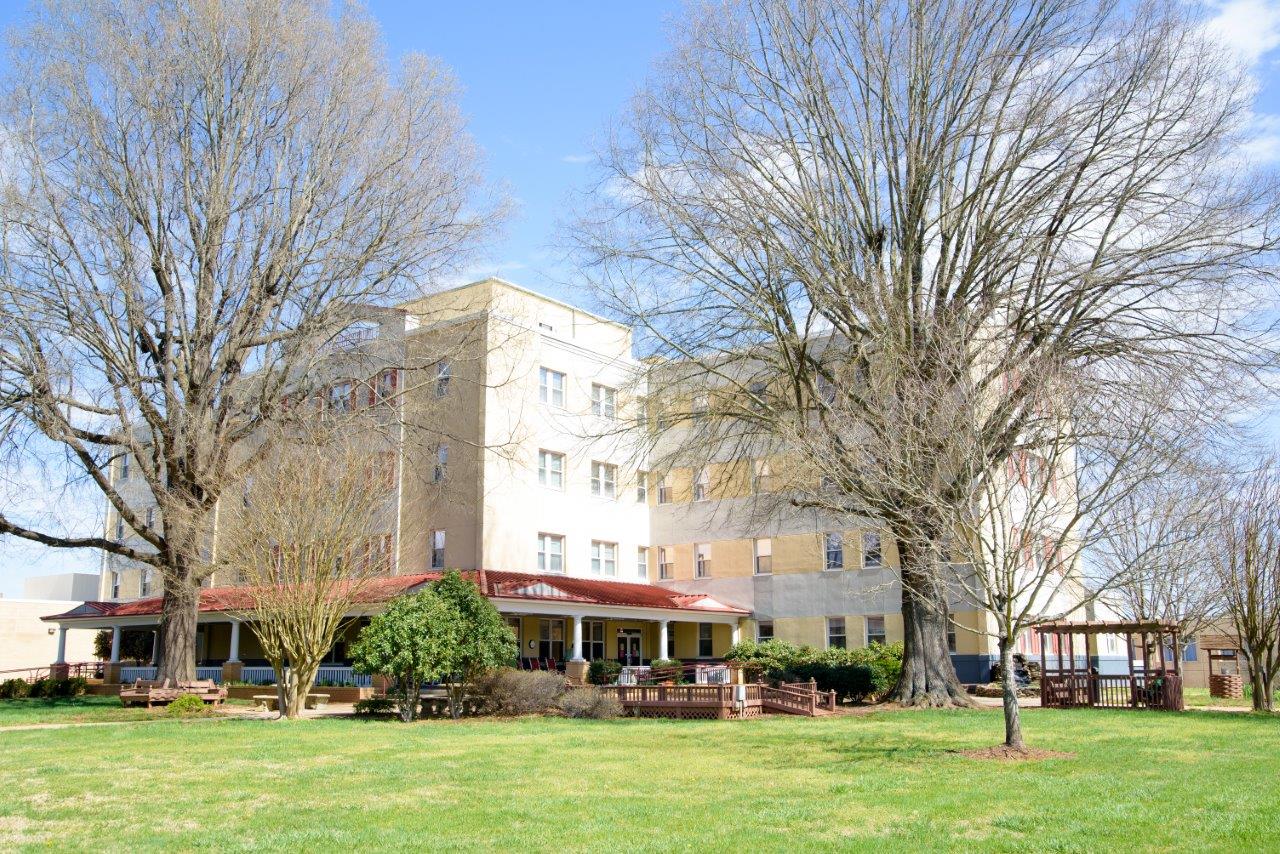
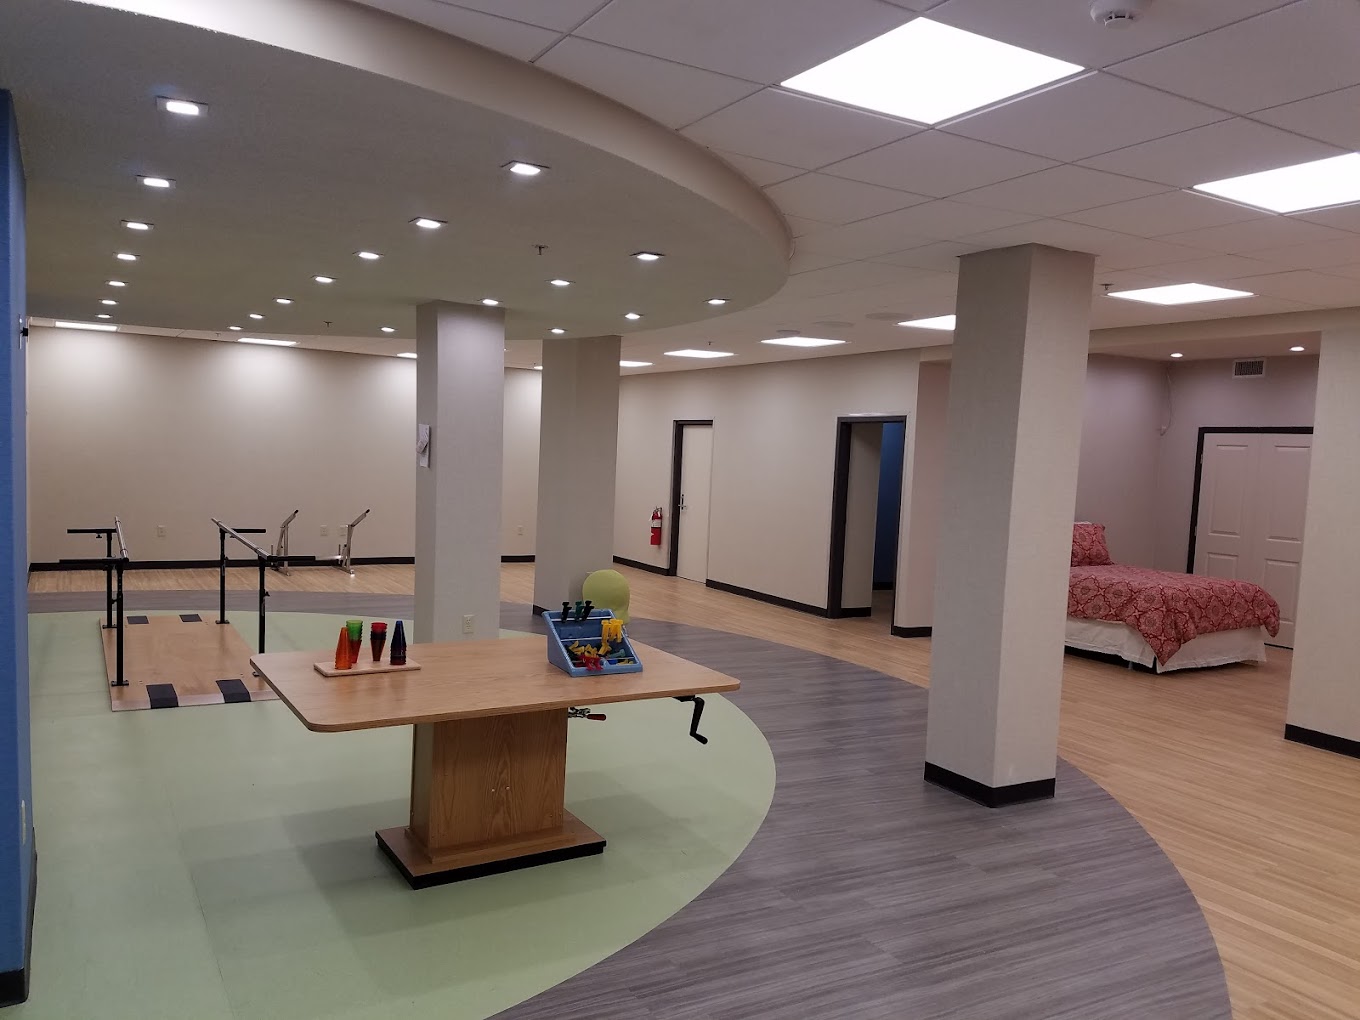
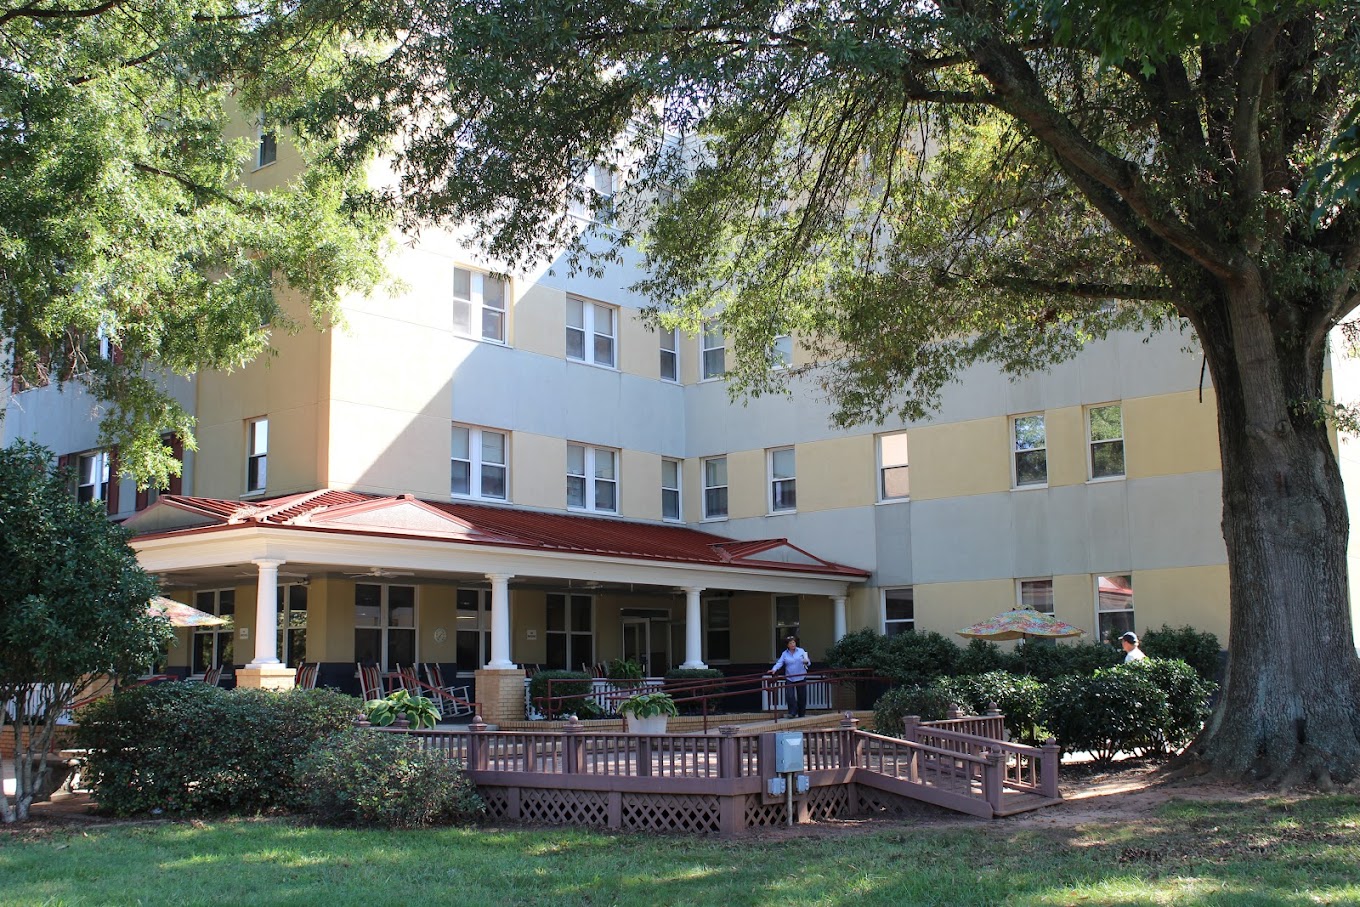
Located in Gaffney, South Carolina, Peachtree Centre is a trusted senior care provider that offers comprehensive medical services, including skilled rehabilitation, respite care, outpatient therapy, and long-term care. The community offers a cozy healing environment with their comfortable and secure private suites and semi-private rooms. Their caring and compassionate team of professionals is trained to provide all types of support and assistance. Whether you require specialized wound care, customized rehabilitation services or a special diet, their team is there to ensure all of your needs are met.

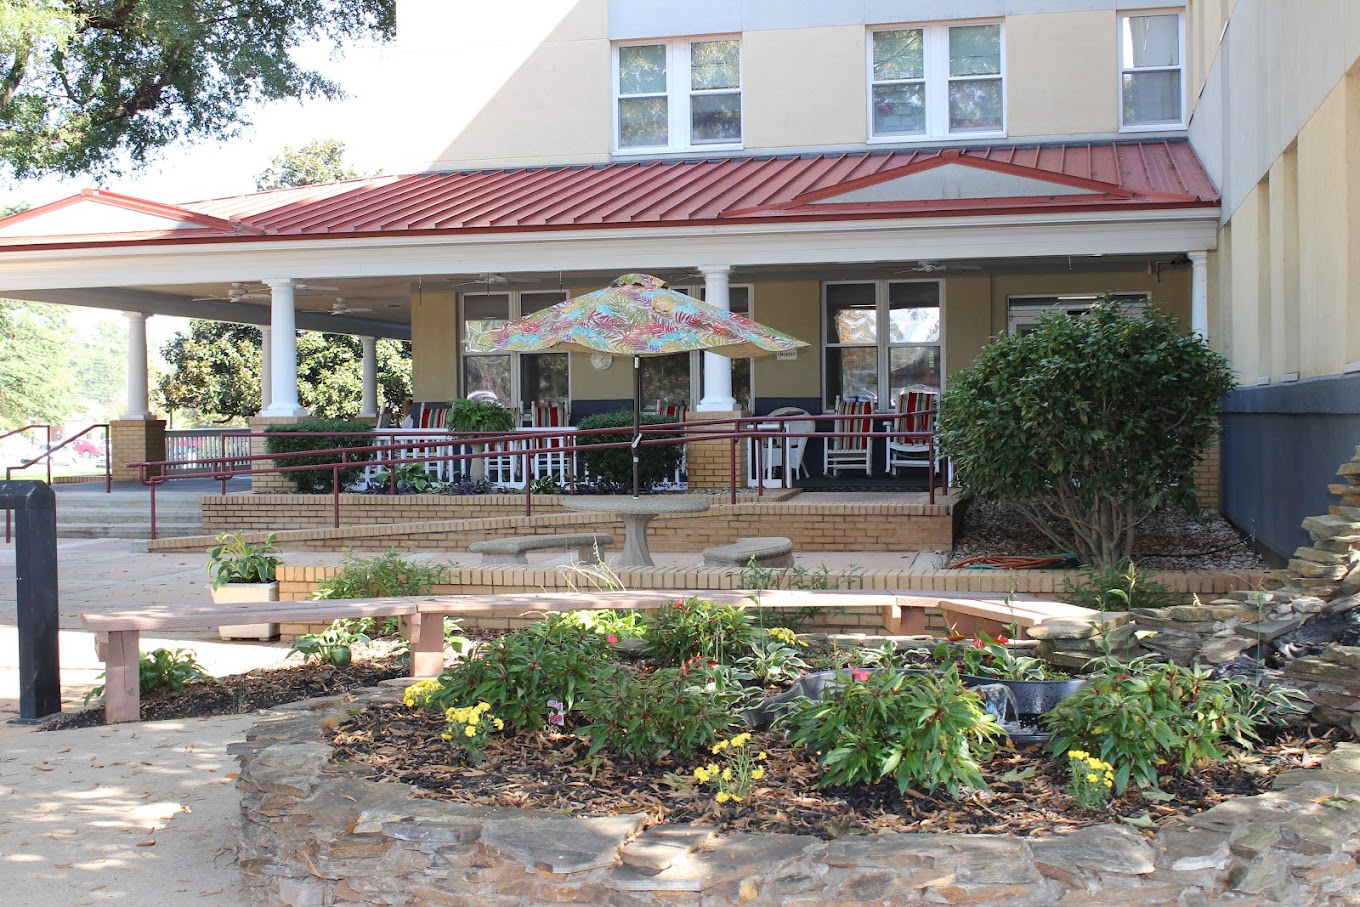
The community is committed to providing personalized care centered to each individuals’ unique needs and preferences. In addition to its excellent care services, Peachtree Centre also offers a wealth of amenities, such as carefully prepared meals, in-house salon services, and diverse Life Enrichment programs. A team of activity directors are available to create various activities based on residents’ interests and capabilities, such as a cooking club, ice cream socials, pet therapy, religious services, holiday events, and outings, ensuring residents’ leisure and enjoyment as they recover.

(864) 487-2717

Quality ratings

Measured by Centers for Medicare & Medicaid Services (CMS)

Overall rating Info Official CMS rating based on health inspections, staffing and quality measures.
3/5
South Carolina average: 2.8/5
Health Inspection Info Official CMS rating based on deficiencies found during state health inspections.
3/5
South Carolina average: 2.7/5
Staffing Info Official CMS rating based on nurse staffing hours per resident per day.
2/5
South Carolina average: 2.9/5
Quality Measures Info Official CMS rating based on clinical outcomes for residents.
3/5
South Carolina average: 3.4/5

Nursing care per resident

Info Average daily nursing hours per resident (adjusted for acuity). Higher values indicate more nursing time per resident.
3h 54m per day

This home provides 2% less nursing time per resident than the state average.

South Carolina average: 4h 0m per day

Capacity and availability

Medium-capacity home

Offers a balance of services and community atmosphere.

Total beds 151

This home usually has limited availability

Occupancy is moderate, suggesting balanced demand.

Similar demand to the South Carolina average
Occupancy rate 88.3%
Residents per day (avg) 136
Occupancy rate
88.3%
Residents per day (avg)
136

Who this home usually serves

TYPE OF STAY

Primarily long-term care, limited rehab

Most residents stay long-term, while a smaller portion are admitted for short-term rehab.

Might be optimal for
Long-term residence Daily assistance Occasional rehab needs

Breakdown by payment type

Medicare

16% of new residents, usually for short-term rehab.

Typical stay 1 months

Private pay

60% of new residents, often for short stays.

Typical stay 1 - 2 months

Medicaid

24% of new residents, often for long-term daily care.

Typical stay 10 - 11 months

Finances and operations

Proprietary home
Partnership
Home revenue
$12.5M
Operating loss
-$1.2M
Proprietary home Partnership
Home revenue
$12,506,255.00
Operating loss
$-1,227,103.00
Payroll costs Info The portion of the home's budget spent on staff, including nurses, caregivers, and other employees who support care and operations.
$4.3M
34.6% of revenue
Other operating costs Info All remaining costs needed to run the home, such as food, utilities, building maintenance, supplies and administrative expenses.
$9.4M
Total costs $13.7M
Bed community size
151-bed community
A large-scale community that may provide a wide range of amenities, services, and structured programs.
Walk Score
Walk Score: 26 / 100
Somewhat walkable. A few nearby services may be reachable on foot, but most trips require transportation.

About this community

License Status
Active
Facility Type
Nursing Homes
License Expiration
December 31, 2026

Additional licensing details

License number: NCF-0972
CMS Certification Number: 425095
County: Cherokee

Ownership & operating entity

Peachtree Centre is legally operated by PEACHTREE OPERATING GROUP LLC, and administrated by GALLMAN, AMANDA.

Ownership type: Limited Liability

Type Of Units

Nursing Home
151 units
Total beds
151 units

Care Services

Offers Alzheimer's Care
Dedicated Alzheimer's Unit

Contact Information

What does this home offer?

Building type icon
Building type icon

Building Type: Mid-rise

Types of Care at Peachtree Centre

Skilled Nursing

Compare Senior Communities around South Carolina

The information below is reported by the South Carolina Department of Public Health, Bureau of Healthcare Quality.
Peachtree Centre
SNF

Nursing Home 24/7 care needed

SN

Skilled Nursing

Gaffney
111
No
26
MFI HEALTHCARE LLC
88.3%
$12,209,906.00
$4,324,141.00
35.4%
135.70
3/5
3.9066
3/5
2/5
3/5
2
12
2
-23%
-2%
+8%

Places of interest near Peachtree Centre

Address 1.6 miles from city center — 0.03 miles to nearest hospital (Peachtree Centre)

Address 1434 N Limestone St, Gaffney, SC 29340, USA

Calculate Travel Distance to Peachtree Centre

Add your location

Address

Staffing Data

Source: CMS Payroll-Based Journal (Q2 2025)

268
Total Staff
114
Employees
154
Contractors
48,548
Total Hours (Quarter)
58
Avg Staff/Day
9.2
Avg Shift (hrs)
Nursing Staff Breakdown
Role Count Avg Shift (hrs) Uses Contractors?
Registered Nurse206.1 Yes
Licensed Practical Nurse919.5 Yes
Certified Nursing Assistant1429.6 Yes
Staff by Category
Administration
1 staff
8hs shift avg
Nursing Staff
258 staff
9.3hs shift avg
Physicians & Practitioners
5 staff
7.9hs shift avg
Therapy Services
1 staff
7.9hs shift avg
Activities & Recreation
0 staff
0hs shift avg
Social Services
0 staff
0hs shift avg
Dietary Services
2 staff
8.3hs shift avg
Other Services
1 staff
8hs shift avg
Contractor Analysis
21.4%
of total hours from contractors
10,377 contractor hours this quarter
Certified Nursing Assistant: 84 Clinical Nurse Specialist: 1 Registered Nurse: 14 Licensed Practical Nurse: 55
Role Employees Contractors Total Staff Total Hours Days Worked % of Days Avg Shift (hrs)
Certified Nursing Assistant588414226,57991100%9.6
Licensed Practical Nurse36559115,17491100%9.5
Registered Nurse614201,7108593%6.1
Clinical Nurse Specialist2131,0578290%8
Other Dietary Services Staff1015957178%8.4
Nurse Practitioner2025126673%7.8
Mental Health Service Worker1015126470%8
Dietitian1015046268%8.1
RN Director of Nursing1015026369%8
Occupational Therapy Aide1014936268%7.9
Administrator1014725965%8
Nurse Aide in Training4044384145%8.9

Health Inspection History

Inspections
Total health inspections 3

State average 3.9


Last Health inspection on Mar 2025

Total health citations 12
Citations per inspection
4

Health citations are formal notices following inspections when they fail to comply with safety and care standards.

10 of 12 citations resulted from standard inspections; and 2 of 12 resulted from complaint investigations.

Breakdown of citation severity (last 3 years)
Critical Health citations More info 0
100% better than State average

State average: 1


Serious Health citations More info 2
567% worse than State average

State average: 0.3

0 critical citations More info State average: 1

2 serious citations More info State average: 0.3

10 moderate citations More info State average: 12.3

0 minor citations More info State average: 0.1
Citations history (last 3 years)
Quality of Care moderate citation Mar 28, 2025
Corrected

Care Planning moderate citation Mar 28, 2025
Corrected

Infection Control moderate citation Dec 29, 2023
Corrected

Nutrition moderate citation Dec 29, 2023
Corrected

Facility Characteristics

Source: CMS Long-Term Care Facility Characteristics (Data as of Jan 2026)

Ownership: For-Profit LLC
Part of: Ahava Healthcare
Resident Census by Payment Source
138 Total Residents
Medicare 35 (25.4%)
Medicaid 84 (60.9%)
Private Pay/Other 19 (13.8%)
Programs & Services
Residents' Group
Family Engagement

Active councils help families stay involved in care decisions and facility operations.

Quality of care over time

These measures show how residents usually do over time at this home, based on health outcomes and preventive care.

High-risk clinical events score Info A composite score based on pressure ulcers, falls with injury, weight loss, walking ability decline, and activities of daily living decline. 4.5
48% better than South Carolina average

South Carolina average: 8.7

Functional decline score Info A composite score based on activities of daily living decline, walking ability decline, and incontinence. 9.4
39% better than South Carolina average

South Carolina average: 15.5

Long-stay resident measures
Need for Help with Daily Activities Increased Info Percent of long-stay residents whose need for help with daily activities has increased 5.1%
61% better than South Carolina average

South Carolina average: 13.1%

Walking Ability Worsened Info Percent of long-stay residents whose ability to move independently worsened 7.4%
54% better than South Carolina average

South Carolina average: 16.2%

Low Risk Residents with Bowel/Bladder Incontinence Info Percent of low risk long-stay residents who lose control of their bowels or bladder 15.7%
8% better than South Carolina average

South Carolina average: 17.0%

Falls with Major Injury Info Percent of long-stay residents experiencing one or more falls with major injury 3.6%
19% worse than South Carolina average

South Carolina average: 3.0%

High Risk Residents with Pressure Ulcers Info Percent of long-stay high risk residents with pressure ulcers 4.1%
32% better than South Carolina average

South Carolina average: 6.1%

Urinary Tract Infection Info Percent of long-stay residents with a urinary tract infection 0.8%
53% better than South Carolina average

South Carolina average: 1.6%

Lost Too Much Weight Info Percent of long-stay residents who lose too much weight 2.4%
62% better than South Carolina average

South Carolina average: 6.2%

Depressive Symptoms Info Percent of long-stay residents who have depressive symptoms 1.3%
51% better than South Carolina average

South Carolina average: 2.8%

Antipsychotic Use Info Percent of long-stay residents who received an antipsychotic medication 21.5%
48% worse than South Carolina average

South Carolina average: 14.5%

Pneumococcal Vaccine Info Percent of long-stay residents assessed and appropriately given the pneumococcal vaccine 99.0%
9% better than South Carolina average

South Carolina average: 90.5%

Influenza Vaccine Info Percent of long-stay residents assessed and appropriately given the seasonal influenza vaccine 95.4%
5% better than South Carolina average

South Carolina average: 90.6%

Short-stay resident measures
Pneumococcal Vaccine Info Percent of short-stay residents assessed and appropriately given the pneumococcal vaccine 86.3%
9% better than South Carolina average

South Carolina average: 79.5%

Antipsychotic medication increase Info Percent of short-stay residents who newly received an antipsychotic medication 1.5%
11% better than South Carolina average

South Carolina average: 1.7%

Influenza Vaccine Info Percent of short-stay residents assessed and appropriately given the seasonal influenza vaccine 78.4%
In line with South Carolina average

South Carolina average: 78.0%

Penalties and fines

Federal penalties imposed by CMS for regulatory violations, including civil money penalties (fines) and denials of payment for new Medicare/Medicaid admissions.

Source: CMS Penalties Database (Data as of Jan 2026)

Total fines amount $8K
77% lower than South Carolina average

South Carolina average: $34K

Number of fines 2
18% fewer fines than South Carolina average

South Carolina average: 2.4

Payment Denials Info Serious action where Medicare and/or Medicaid temporarily stops payments for new residents until issues are fixed. 0
100% fewer payment denials than South Carolina average

South Carolina average: 0.1

Fines amount comparison
This facility $8K
South Carolina average $34K
Penalty History

Penalties are imposed by CMS for violations of federal nursing home regulations.

Civil Money Penalty Info Fines imposed for noncompliance, which can be assessed per day or per instance of violation. May 11, 2023
$4K
Civil Money Penalty Info Fines imposed for noncompliance, which can be assessed per day or per instance of violation. May 11, 2023
$4K

Last updated: Jan 2026

Guides for Better Senior Living

Care Cost Calculator: See Prices in Your Area

Nursing Home Data Explorer

Don’t Wait Too Long: 7 Red Flag Signs Your Parent Needs Assisted Living Now

The True Cost of Assisted Living in 2025 – And How Families Are Paying For It

Understanding Senior Living Costs: Pricing Models, Discounts & Financial Assistance

Financial Aid for South Carolina Seniors

Get financial aid guidance

Community Long Term Care (CLTC)

SC Medicaid CLTC

Age 65+ or disabled, South Carolina resident, Medicaid-eligible, nursing home-level care need.

~$2,829/month (300% FBR, individual).

$2,000 (individual), $3,000 (couple).

High rural demand; waitlists possible.

South Carolina Respite Care Program

SC NFCSP Respite

Caregiver of someone 60+ (or with dementia), South Carolina resident.

No strict limit; prioritizes low-income.

Not applicable.

Limited slots; rural/urban balance.

Medicare Savings Program (MSP)

South Carolina Medicare Savings Program

Age 65+ or disabled, SC resident, Medicare Part A/B.

~$2,510/month (QMB), ~$3,380/month (SLMB), ~$3,598/month (QI)—individual.

$9,430 (individual), $14,130 (couple).

Three tiers; includes Extra Help for Part D; no waitlist.

Low-Income Home Energy Assistance Program (LIHEAP)

South Carolina LIHEAP

Age 60+ prioritized, SC resident, low-income household.

~$3,970/month (individual, 185% FPL).

Not assessed; income-focused.

Covers gas, electric, oil; emergency aid via ECAP (~$500 max).

Senior Community Service Employment Program (SCSEP)

South Carolina SCSEP

Age 55+, unemployed, low-income, SC resident.

~$1,983/month (125% FPL).

Not specified; income-focused.

Priority for veterans, rural residents; Goodwill/AARP partnership.

VA Aid and Attendance (A&A) and Housebound Benefits

South Carolina VA Aid and Attendance/Housebound

Age 65+ or disabled veteran/spouse, SC resident, wartime service, need for ADL help (A&A) or homebound.

Net income < ~$1,984/month (veteran with dependent, A&A); pension offsets income.

~$155,356 (net worth limit).

High veteran population; supports rural/urban care needs.

Senior Farmers’ Market Nutrition Program (SFMNP)

South Carolina SFMNP

Age 60+, SC resident, low-income.

~$2,322/month (individual, 185% FPL).

Not assessed.

Vouchers (~$50/season); serves ~20,000 annually via 10 AAAs.

Homestead Exemption Program

South Carolina Homestead Exemption

Age 65+ (or disabled/blind), SC resident 1+ year, homeowner.

None; tax-based eligibility.

Not assessed; home-focused.

Saves ~$500-$1,000/year avg.; applies to primary residence.

Elderly Simplified Application Project (ESAP)

South Carolina ESAP (SNAP for Seniors)

Age 60+, SC resident, no earned income, not on SCCAP.

~$1,732/month (133% FPL, individual).

$4,250 (individual, higher than standard SNAP).

Simplified process; serves ~50,000 seniors annually.

Who we are

Your Senior Care Partner, Every Step of the Way

We help families find affordable senior communities and unlock same day discounts, Medicaid, and Medicare options tailored to your needs.

Contact us Today
Tour Icon
Planning a tour? Check our touring checklist.
Chat Icon
Thinking of living here? We can help you speak to a current resident