Pike Creek Nursing and Rehabilitation

Nursing Home
Overview of Pike Creek Nursing and Rehabilitation

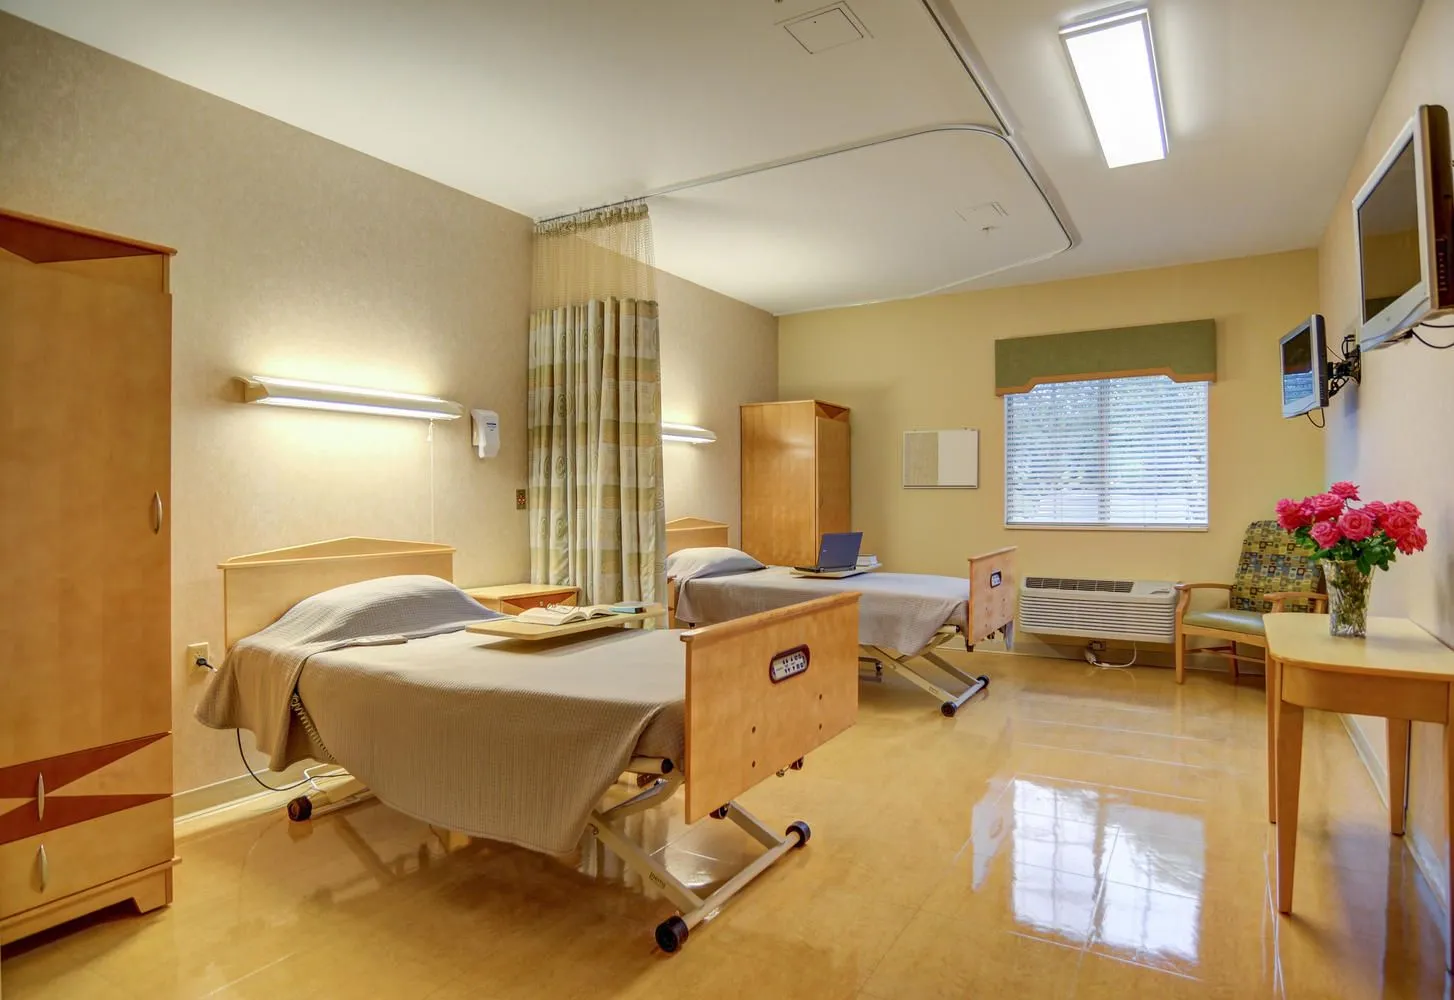
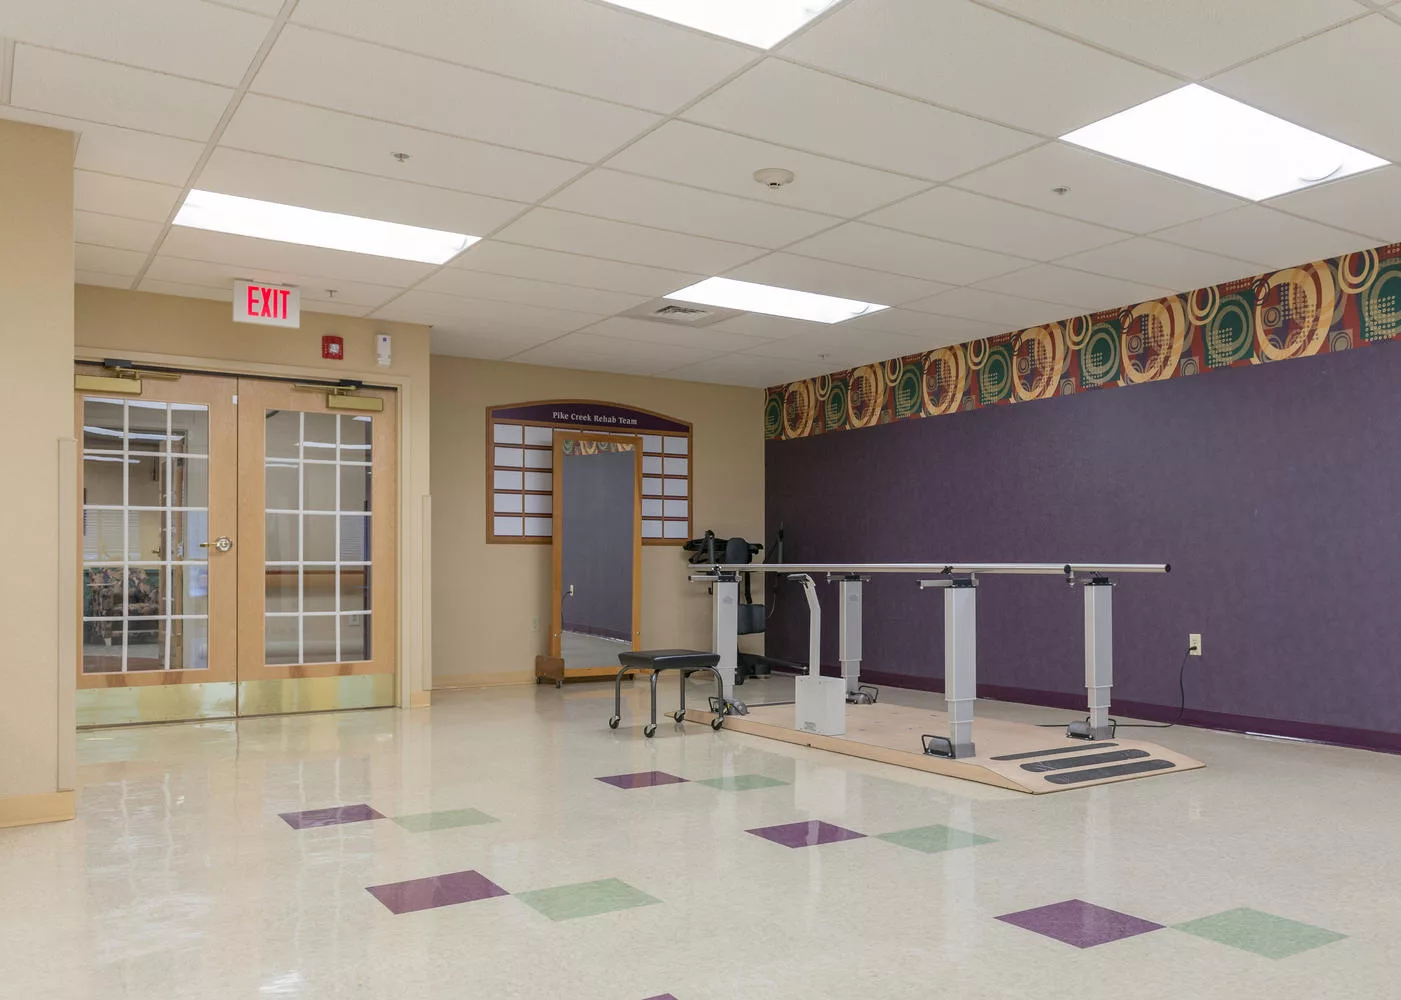
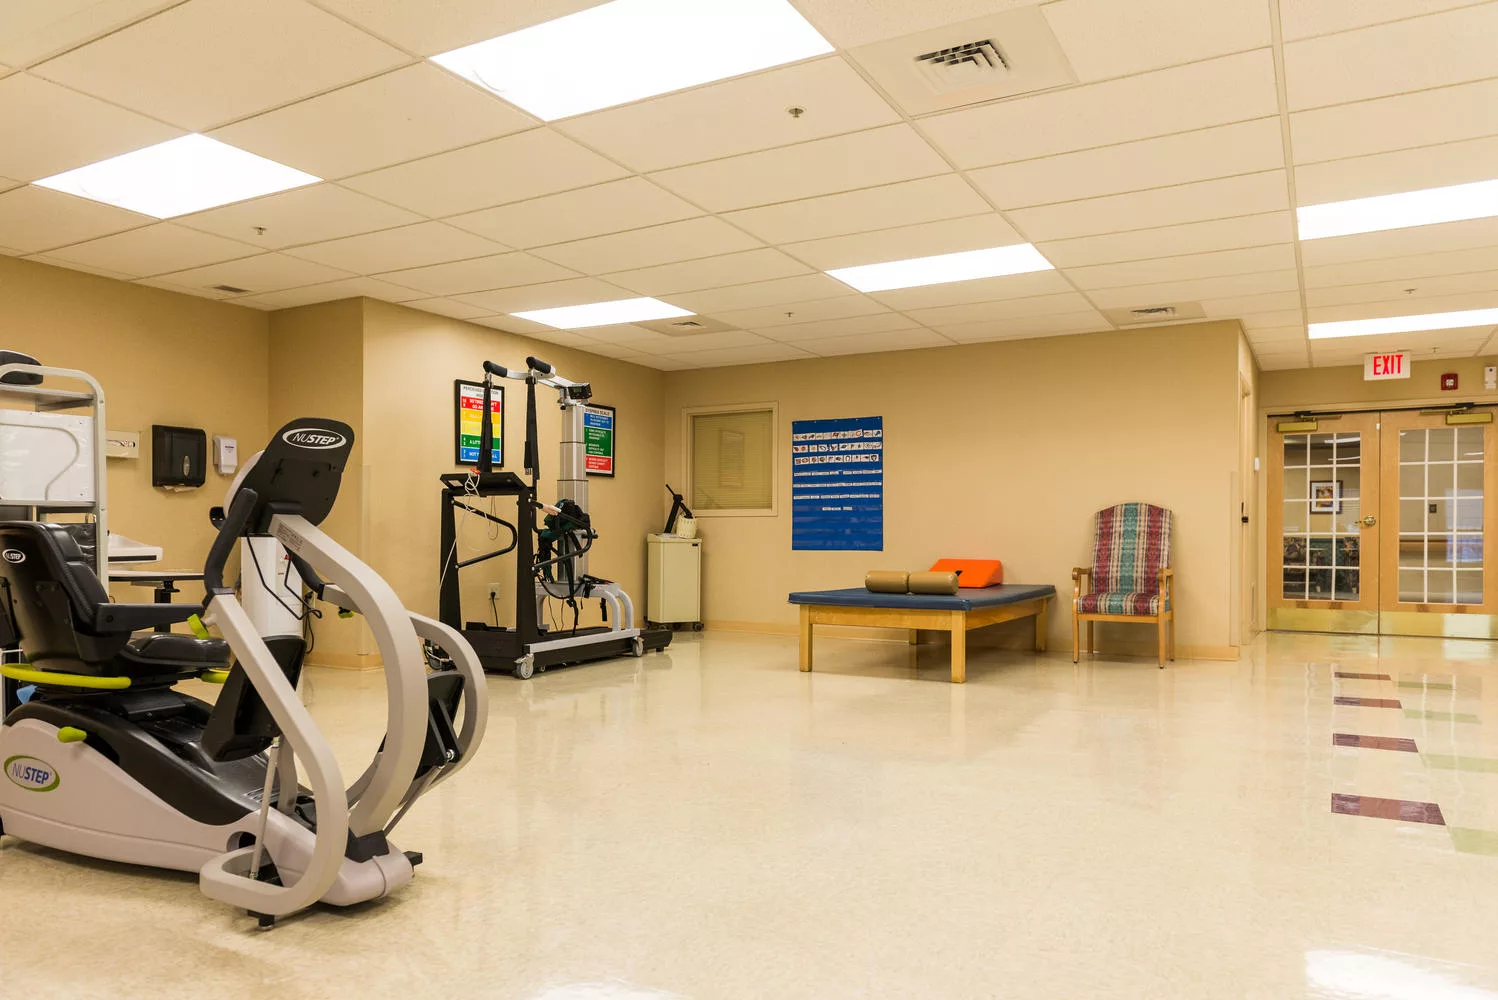
Pike Creek Nursing and Rehabilitation is where Hockessin residents receive personalized care uniquely designed based on their needs. Expect excellent services and commitment to ensuring residents live their best lives. Their areas of specialization include rehabilitation, post-acute services, and long-term nursing care.

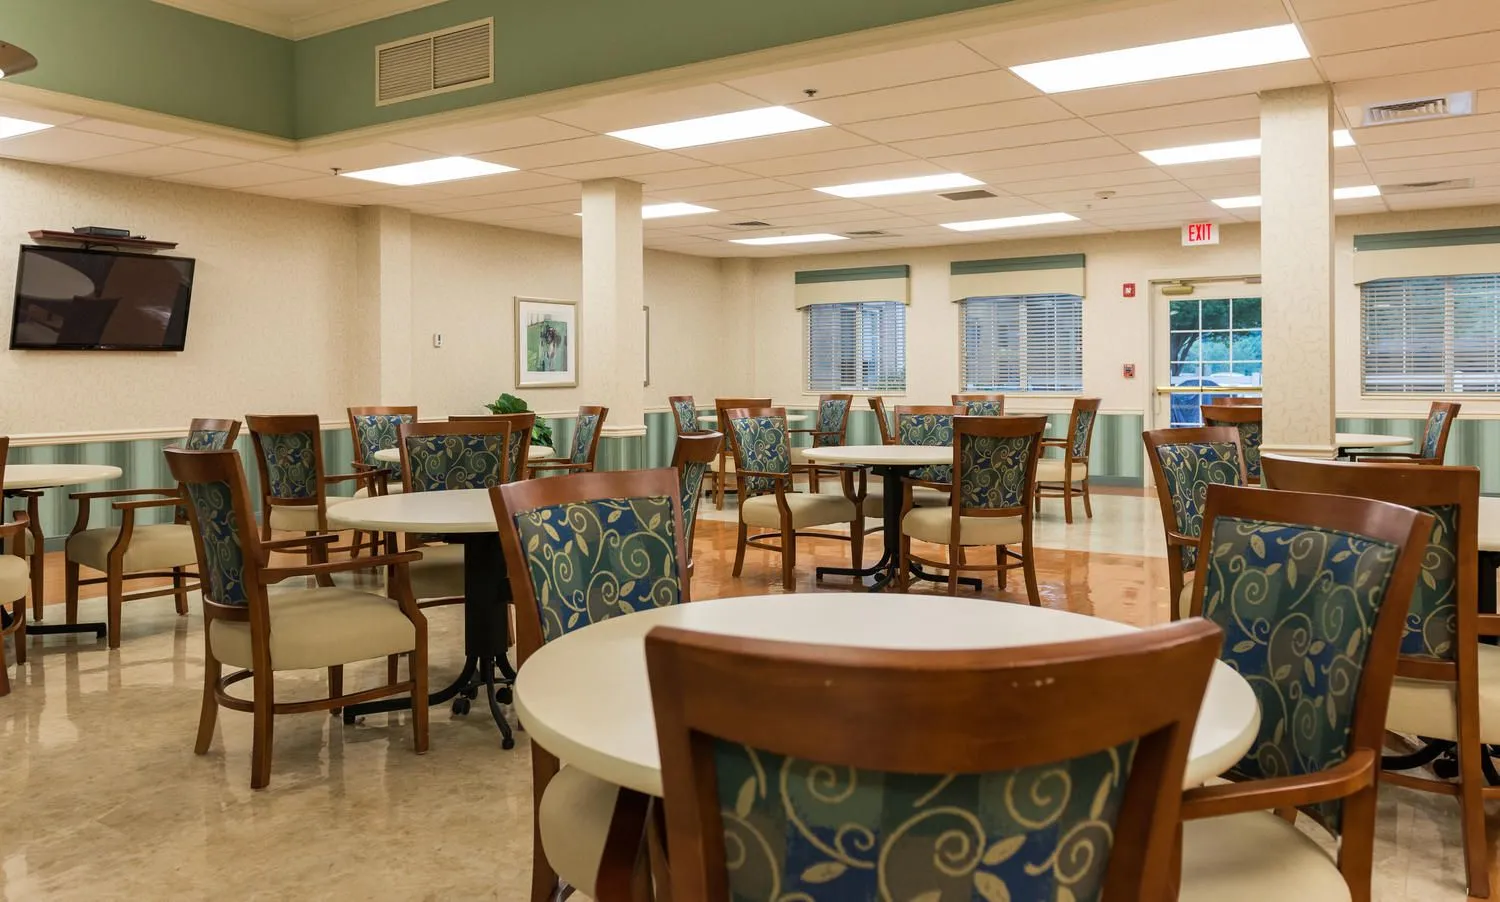
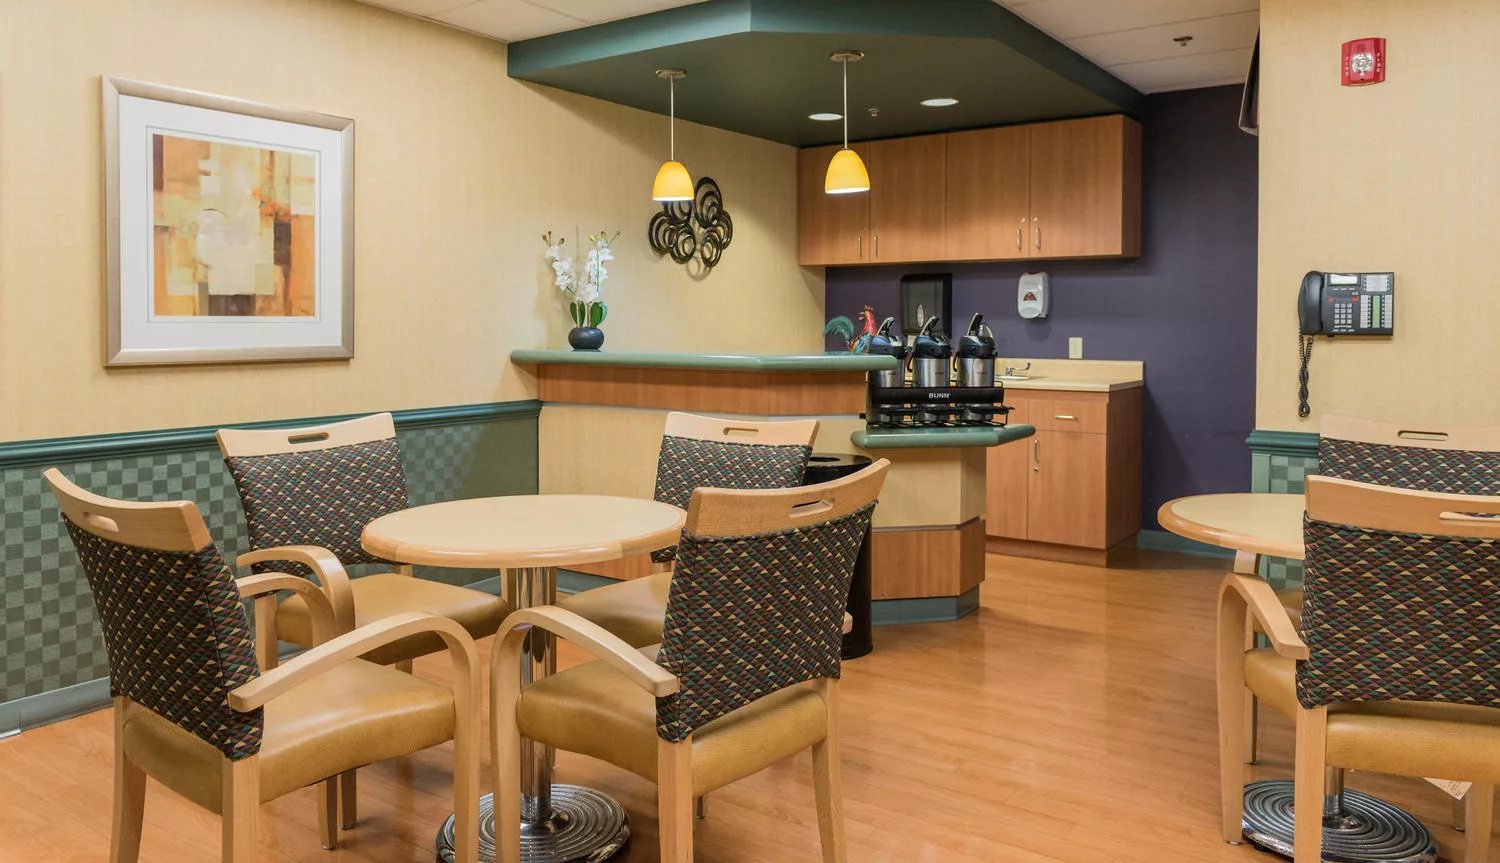
Essential services include housekeeping, restaurant-style dining, social activities, and scheduled transportation.

(302) 239-8583

Quality ratings

Measured by Centers for Medicare & Medicaid Services (CMS)

Overall rating Info Official CMS rating based on health inspections, staffing and quality measures.
1/5
Delaware average: 3.3/5
Health Inspection Info Official CMS rating based on deficiencies found during state health inspections.
1/5
Delaware average: 2.8/5
Staffing Info Official CMS rating based on nurse staffing hours per resident per day.
2/5
Delaware average: 4.0/5
Quality Measures Info Official CMS rating based on clinical outcomes for residents.
3/5
Delaware average: 4.0/5

Nursing care per resident

Info Average daily nursing hours per resident (adjusted for acuity). Higher values indicate more nursing time per resident.
3h 41m per day

This home provides 21% less nursing time per resident than the state average.

Delaware average: 4h 39m per day

Capacity and availability

Medium-capacity home

Offers a balance of services and community atmosphere.

Total beds 177

This home usually has limited availability

Occupancy is moderate, suggesting balanced demand.

Similar demand to the Delaware average
Occupancy rate 87.8%
Residents per day (avg) 142
Occupancy rate
87.8%
Residents per day (avg)
142

Who this home usually serves

TYPE OF STAY

Mix of rehab and long-term care

This home supports both short-term rehab and long-term care, with residents staying for a wide range of durations.

Breakdown by payment type

Medicare

30% of new residents, usually for short-term rehab.

Typical stay 1 - 2 months

Private pay

45% of new residents, often for short stays.

Typical stay 1 - 2 months

Medicaid

25% of new residents, often for long-term daily care.

Typical stay 5 - 6 months

Finances and operations

Proprietary home
Corporation
Home revenue
$12.8M
Operating loss
-$598.6K
Proprietary home Corporation
Home revenue
$12,751,051.00
Operating loss
$-598,646.00
Payroll costs Info The portion of the home's budget spent on staff, including nurses, caregivers, and other employees who support care and operations.
$2.5M
19.4% of revenue
Other operating costs Info All remaining costs needed to run the home, such as food, utilities, building maintenance, supplies and administrative expenses.
$10.8M
Total costs $13.2M
Bed community size
177-bed community
A large-scale community that may provide a wide range of amenities, services, and structured programs.
Years in operation
1 year in operation
A newer community that may feature more recent facilities and programs.
Walk Score
Walk Score: 42 / 100
Somewhat walkable. A few nearby services may be reachable on foot, but most trips require transportation.

About this community

Occupancy Rate
88%
Occupied Beds
156 of 177
Percentage of available beds currently in use by residents.
Facility Type
Nursing Home
License Date
January 8, 2025
License Expiration
January 11, 2025

Additional licensing details

License number: 1090

Ownership & operating entity

Pike Creek Nursing and Rehabilitation is administrated by Brian Lenehan.

Staffing

Key information about the people who lead and staff this community.

Leadership

Director of Nursing: Christine Thompson
Director of Nursing email: [email protected]
Administrator email: [email protected]

Care Services

Nursing Services
Rehabilitation Services
Skilled Nursing
Licensed Nurses/CNAs

Programs & Activities

Specific Programs
Skilled nursing care, rehabilitation services

Types of Care at Pike Creek Nursing and Rehabilitation

Skilled Nursing
Contact Pike Creek Nursing and Rehabilitation

Inspection History

In Delaware, the Department of Health and Social Services, Division of Health Care Quality is responsible for the oversight, unannounced inspection, and licensing of all long-term care settings.

10 visits/inspections

2 visits/inspections triggered by complaints

3 other visits

Results

8 with issues

2 without issues

Latest inspection

Date:August 13, 2025
Type:Annual Inspection

101 deficiencies

Deficiencies indicate regulatory issues. A higher number implies the facility had several areas requiring improvement.

Compare Nursing Homes around Hockessin

The information below is reported by the Delaware Department of Health and Social Services, Division of Health Care Quality.
Pike Creek Nursing and Rehabilitation
SNF

Nursing Home 24/7 care needed

AL

Assisted Living For seniors needing help with daily tasks but not full-time nursing.

Wilmington
177
No
-
42
PIKE CREEK SNF OPERATOR HOLDINGS LLC
87.8%
$12,635,106.00
$2,476,553.00
19.6%
142.10
1/5
3.6860
1/5
2/5
3/5
2
97
6
-24%
-21%
+9%
Always Best Care Senior Services – Wilmington
AL

Assisted Living For seniors needing help with daily tasks but not full-time nursing.

HC

Home Care

SNF

Nursing Homes 24/7 care needed

RC

Respite Care

Wilmington (Brandywine Village)
-
No
A+
85
-
-
-
-
-
-
-
-
-
-
-
-
-
-
-
-
-

Places of interest near Pike Creek Nursing and Rehabilitation

Address 3.7 miles from city center — 5.02 miles to nearest hospital (VA Medical Center- Wilmington)
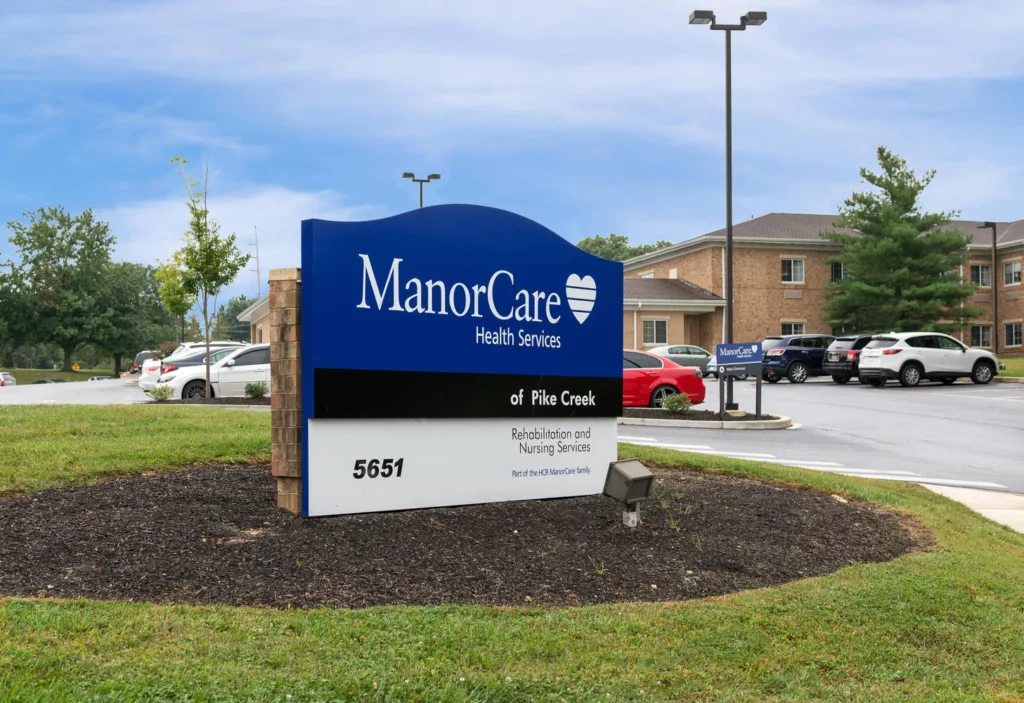
Address 5651 Limestone Rd, Wilmington, DE 19808

Calculate Travel Distance to Pike Creek Nursing and Rehabilitation

Add your location

Address

Staffing Data

Source: CMS Payroll-Based Journal (Q2 2025)

187
Total Staff
174
Employees
13
Contractors
59,974
Total Hours (Quarter)
79
Avg Staff/Day
8.3
Avg Shift (hrs)
Nursing Staff Breakdown
Role Count Avg Shift (hrs) Uses Contractors?
Registered Nurse187.8 Yes
Licensed Practical Nurse429.2 Yes
Certified Nursing Assistant848.2 Yes
Staff by Category
Administration
1 staff
8hs shift avg
Nursing Staff
146 staff
8.5hs shift avg
Physicians & Practitioners
10 staff
8hs shift avg
Therapy Services
18 staff
8.2hs shift avg
Activities & Recreation
0 staff
0hs shift avg
Social Services
5 staff
6.2hs shift avg
Dietary Services
4 staff
7.6hs shift avg
Other Services
3 staff
7.9hs shift avg
Contractor Analysis
5.6%
of total hours from contractors
3,389 contractor hours this quarter
Licensed Practical Nurse: 8 Certified Nursing Assistant: 1 Registered Nurse: 4
Role Employees Contractors Total Staff Total Hours Days Worked % of Days Avg Shift (hrs)
Certified Nursing Assistant8318426,17791100%8.2
Licensed Practical Nurse3484214,49391100%9.2
Registered Nurse144185,34591100%7.8
Clinical Nurse Specialist9092,8607987%8
Speech Language Pathologist5051,6937178%8.2
Respiratory Therapy Technician6061,6908290%7.8
Physical Therapy Assistant3031,4018492%9.3
Other Dietary Services Staff3031,32991100%7.5
Physical Therapy Aide4041,1128088%7.7
Dental Services Staff2029096976%7.9
Qualified Social Worker5056866369%6.2
Nurse Practitioner1015046369%8
Mental Health Service Worker1014966268%8
Dietitian1014725965%8
Administrator1014645864%8
RN Director of Nursing2023454549%7.7

Health Inspection History

Inspections
Total health inspections 5

Delaware average 4.4


Last Health inspection on Aug 2025

Total health citations 97
Citations per inspection
19.4

Health citations are formal notices following inspections when they fail to comply with safety and care standards.

43 of 97 citations resulted from standard inspections; 19 of 97 resulted from complaint investigations; and 35 of 97 came from combined inspections (standard and complaint).

Breakdown of citation severity (last 3 years)
Critical Health citations More info 3
233% worse than Delaware average

Delaware average: 0.9


Serious Health citations More info 3
150% worse than Delaware average

Delaware average: 1.2

3 critical citations More info Delaware average: 0.9

3 serious citations More info Delaware average: 1.2

85 moderate citations More info Delaware average: 35.7

6 minor citations More info Delaware average: 1
Citations history (last 3 years)
Nursing Services minor citation Aug 13, 2025
Corrected

Quality of Care moderate citation Aug 13, 2025
Corrected

Care Planning moderate citation Aug 13, 2025
Corrected

Resident Rights moderate citation Aug 13, 2025
Corrected

Facility Characteristics

Source: CMS Long-Term Care Facility Characteristics (Data as of Jan 2026)

Ownership: For-Profit Corporation
Part of: Medical Facilities of America
Resident Census by Payment Source
156 Total Residents
Medicare 20 (12.8%)
Medicaid 90 (57.7%)
Private Pay/Other 46 (29.5%)
Programs & Services
Residents' Group
Family Engagement

Active councils help families stay involved in care decisions and facility operations.

Quality of care over time

These measures show how residents usually do over time at this home, based on health outcomes and preventive care.

High-risk clinical events score Info A composite score based on pressure ulcers, falls with injury, weight loss, walking ability decline, and activities of daily living decline. 8.9
8% better than Delaware average

Delaware average: 9.6

Functional decline score Info A composite score based on activities of daily living decline, walking ability decline, and incontinence. 17.5
8% better than Delaware average

Delaware average: 19.0

Long-stay resident measures
Need for Help with Daily Activities Increased Info Percent of long-stay residents whose need for help with daily activities has increased 14.7%
5% better than Delaware average

Delaware average: 15.4%

Walking Ability Worsened Info Percent of long-stay residents whose ability to move independently worsened 15.7%
21% better than Delaware average

Delaware average: 19.8%

Low Risk Residents with Bowel/Bladder Incontinence Info Percent of low risk long-stay residents who lose control of their bowels or bladder 22.0%
In line with Delaware average

Delaware average: 22.1%

Falls with Major Injury Info Percent of long-stay residents experiencing one or more falls with major injury 2.4%
19% better than Delaware average

Delaware average: 3.0%

High Risk Residents with Pressure Ulcers Info Percent of long-stay high risk residents with pressure ulcers 4.9%
11% worse than Delaware average

Delaware average: 4.4%

Urinary Tract Infection Info Percent of long-stay residents with a urinary tract infection 2.0%
7% better than Delaware average

Delaware average: 2.1%

Lost Too Much Weight Info Percent of long-stay residents who lose too much weight 6.6%
15% worse than Delaware average

Delaware average: 5.8%

Depressive Symptoms Info Percent of long-stay residents who have depressive symptoms 59.6%
889% worse than Delaware average

Delaware average: 6.0%

Antipsychotic Use Info Percent of long-stay residents who received an antipsychotic medication 18.5%
69% worse than Delaware average

Delaware average: 11.0%

Pneumococcal Vaccine Info Percent of long-stay residents assessed and appropriately given the pneumococcal vaccine 80.4%
16% worse than Delaware average

Delaware average: 95.3%

Influenza Vaccine Info Percent of long-stay residents assessed and appropriately given the seasonal influenza vaccine 98.4%
In line with Delaware average

Delaware average: 97.4%

Short-stay resident measures
Pneumococcal Vaccine Info Percent of short-stay residents assessed and appropriately given the pneumococcal vaccine 31.7%
61% worse than Delaware average

Delaware average: 82.1%

Antipsychotic medication increase Info Percent of short-stay residents who newly received an antipsychotic medication 1.5%
69% worse than Delaware average

Delaware average: 0.9%

Influenza Vaccine Info Percent of short-stay residents assessed and appropriately given the seasonal influenza vaccine 75.4%
9% worse than Delaware average

Delaware average: 83.1%

Penalties and fines

Federal penalties imposed by CMS for regulatory violations, including civil money penalties (fines) and denials of payment for new Medicare/Medicaid admissions.

Source: CMS Penalties Database (Data as of Jan 2026)

Total fines amount $485K
394% higher than Delaware average

Delaware average: $98K

Number of fines 2
7% more fines than Delaware average

Delaware average: 1.9

Payment Denials Info Serious action where Medicare and/or Medicaid temporarily stops payments for new residents until issues are fixed. 2
757% more payment denials than Delaware average

Delaware average: 0.2

Fines amount comparison
This facility $485K
Delaware average $98K
Penalty History

Penalties are imposed by CMS for violations of federal nursing home regulations.

Civil Money Penalty Info Fines imposed for noncompliance, which can be assessed per day or per instance of violation. Sep 10, 2024
$221K
Payment Denial Info Serious action where Medicare and/or Medicaid temporarily stops payments for new residents until issues are fixed. Sep 10, 2024
64 days
Civil Money Penalty Info Fines imposed for noncompliance, which can be assessed per day or per instance of violation. Sep 25, 2023
$263K
Payment Denial Info Serious action where Medicare and/or Medicaid temporarily stops payments for new residents until issues are fixed. Sep 25, 2023
114 days

Last updated: Jan 2026

Guides for Better Senior Living

Care Cost Calculator: See Prices in Your Area

Nursing Home Data Explorer

Don’t Wait Too Long: 7 Red Flag Signs Your Parent Needs Assisted Living Now

The True Cost of Assisted Living in 2025 – And How Families Are Paying For It

Understanding Senior Living Costs: Pricing Models, Discounts & Financial Assistance

Financial Aid for Delaware Seniors

Get financial aid guidance

Elderly and Disabled Waiver

Delaware Medicaid E&D Waiver

Age 65+ or disabled, Delaware resident, Medicaid- eligible, nursing home-level care need.

~$2,829/month (300% FBR, individual).

$2,000 (individual), $3,000 (couple).

Small state, faster processing in some areas.

Delaware Caregiver Support Program

DE Caregiver Support (NFCSP)

Caregiver of someone 60+, Delaware resident.

No strict limit; prioritizes low-income.

Not applicable.

Limited slots; rural focus.

Program of All-Inclusive Care for the Elderly (PACE)

Delaware Medicaid PACE

Age 55+, Delaware resident, nursing home-level care need, safe with PACE support.

~$2,829/month (300% FBR).

$2,000 (individual), $3,000 (couple).

Limited to specific areas (e.g., New Castle County); few providers.

Medicare Savings Program (MSP)

Delaware Medicare Savings Program

Age 65+ or disabled, Delaware resident, enrolled in Medicare Part A/B.

~$2,510/month (QMB), ~$3,380/month (SLMB), ~$3,598/month (QI)—individual, adjusted annually.

$9,430 (individual), $14,130 (couple).

Three tiers; broader limits than some states.

Senior Community Service Employment Program (SCSEP)

Delaware SCSEP (federally funded, state-administered)

Age 55+, unemployed, low-income, Delaware resident.

~$1,983/month (125% FPL, individual).

Not specified; income-focused.

Priority for veterans, rural residents; ~400 slots/year.

Who we are

Your Senior Care Partner, Every Step of the Way

We help families find affordable senior communities and unlock same day discounts, Medicaid, and Medicare options tailored to your needs.

Contact us Today