Explore Open Rooms

1 Contact details
2 What type of senior care service are you looking for?
3 What budget do you have in mind for senior care?
4 How soon do you need to find care?
5 Additional details

Thank you for your interest!

Our team will be in touch shortly to help with next steps.

Assisted Living in Lafayette

CMS overall rating Info The Overall CMS Rating combines results from health inspections, staffing levels and quality measures. Health inspections carry the most weight. Staffing and quality scores can increase or decrease the final rating based on performance compared to state and national standards.

ProMedica Assisted Living Lafayette

329 Exempla Cir, Lafayette, CO 80026 View map
Overview of Promedica Assisted Living Lafayette

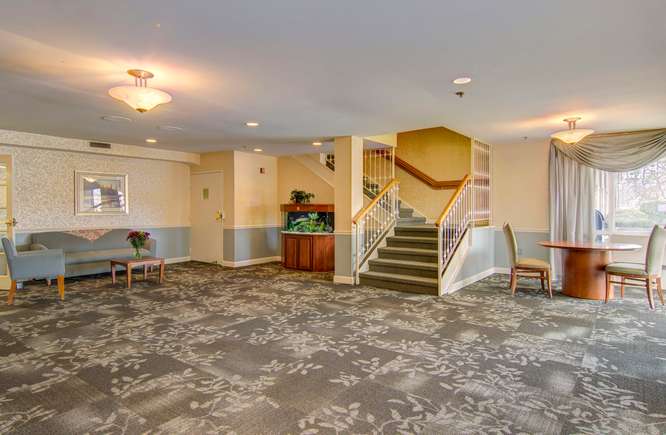
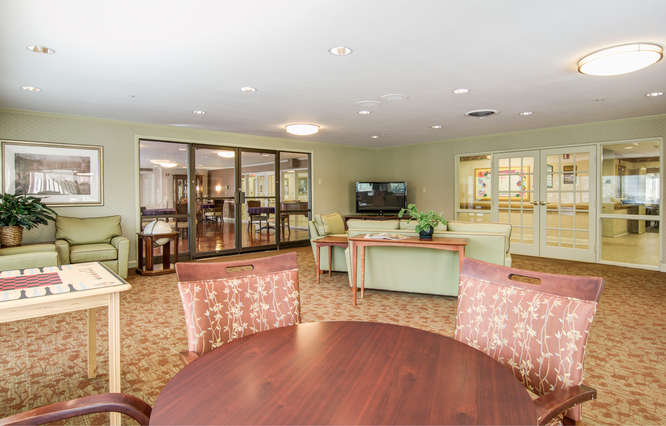
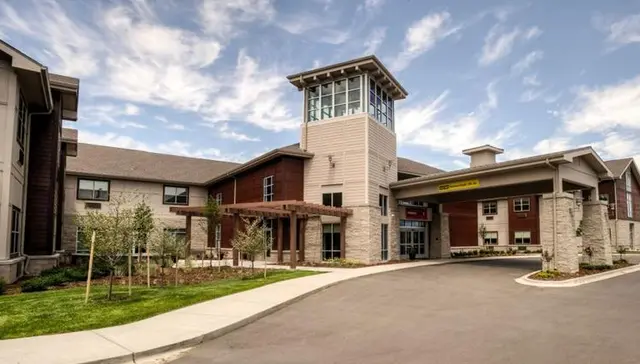
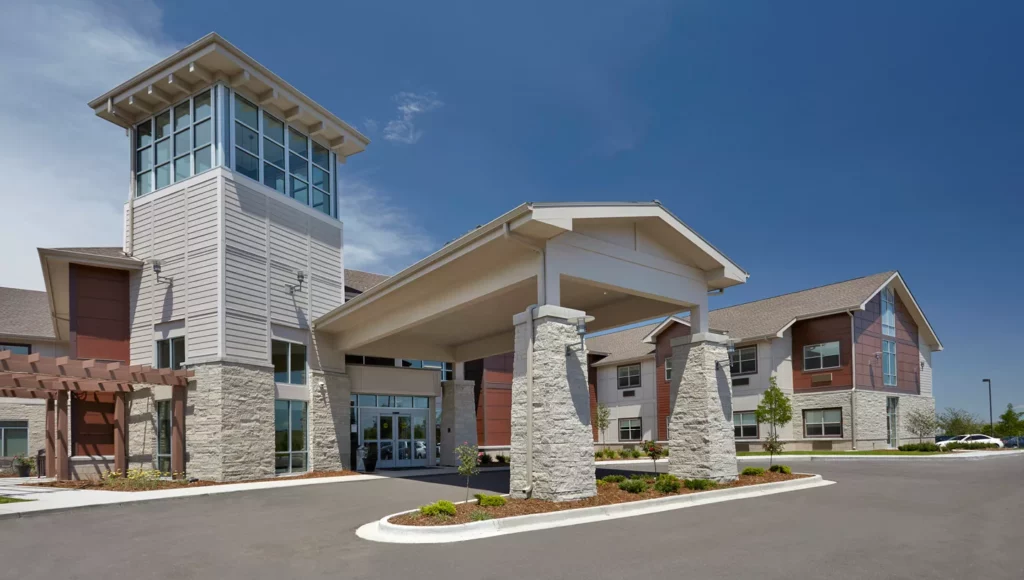
ProMedica Assisted Living in Lafayette provides outstanding supervision and care. The community offers an inviting atmosphere with fine hospitality; the staff is ready to attend to any need with compassion and dignity. As a ProMedica community, the well-trained staff encourages its residents to maintain their residents’ sense of individuality while being able to enhance their quality of life in a nurturing environment.

Assisted Living services focus on its residents’ cognitive health and overall wellness– 24-hour supervision, medication management, outside rehabilitative care, physical therapy available, reassurance and advice support, structured programs, and mobility assistance.

(720) 639-2200

Quality ratings

Measured by Centers for Medicare & Medicaid Services (CMS)

Overall rating Info The Overall CMS Rating combines results from health inspections, staffing levels and quality measures. Health inspections carry the most weight. Staffing and quality scores can increase or decrease the final rating based on performance compared to state and national standards.
3/5
Colorado average: 3.1/5
Health Inspection Info Based on the results of the facility's three most recent standard inspections and any complaint investigations. CMS reviews the number, scope, and severity of deficiencies, with more recent findings weighted more heavily.
3/5
Colorado average: 2.8/5
Staffing Info Measures average nursing staff hours per resident per day, including Registered Nurses (RNs) and total nursing staff. Ratings are adjusted based on the level of care residents require and are compared to state and national benchmarks.
4/5
Colorado average: 3.0/5
Quality Measures Info Based on clinical and physical health indicators reported to CMS, such as hospital readmissions, falls, pressure ulcers, and improvements in mobility. These measures reflect how well residents' health needs are being managed.
4/5
Colorado average: 4.1/5

Nursing care per resident

Info This shows how many total hours of nursing staff time are available per resident each day. Higher numbers usually mean more staff support.
6h 4m per day

This home provides 57% more nursing time per resident than the Colorado average.

Colorado average: 3h 52m per day

Capacity and availability

Smaller home

May offer a more intimate, personalized care environment.

Total beds 70

This home usually has availability

Lower occupancy suggests more openings may be available.

Lower demand than the Colorado average
Occupancy rate 33.7%
Residents per day (avg) 37
Occupancy rate
33.7%
Residents per day (avg)
37

Who this home usually serves

TYPE OF STAY

Primarily short stays

Residents typically stay for brief periods, with frequent admissions and discharges throughout the year.

Might be optimal for
Post-acute recovery Temporary care Transitional stays

Breakdown by payment type

Medicare

21% of new residents, usually for short-term rehab.

Typical stay 22 days

Private pay

79% of new residents, often for short stays.

Typical stay 16 days

Finances and operations

Privately-owned community
Home revenue
$3.5M
Operating loss
-$1.0M
Privately-owned community
Home revenue
$3,470,044.00
Operating loss
$-1,033,776.00
Payroll costs Info The portion of the home's budget spent on staff, including nurses, caregivers, and other employees who support care and operations.
$1.1M
31.8% of revenue
Other operating costs Info All remaining costs needed to run the home, such as food, utilities, building maintenance, supplies and administrative expenses.
$3.4M
Total costs $4.5M

What does this home offer?

Pets allowed icon
Pets allowed icon

Pets Allowed: Yes, Pets Allowed

Housing options icon

Housing Options: Private Rooms / Semi-Private Rooms

Building type icon
Building type icon

Building Type: Two-story

Transportation services icon

Transportation Services

Fitness and recreation icon

Fitness and Recreation

Types of Care at ProMedica Assisted Living Lafayette

Nursing Home Assisted Living
Contact ProMedica Assisted Living Lafayette

Health Inspection History

Inspections
Total health inspections 5

Colorado average 4.8


Last Health inspection on Aug 2025

Total health citations 22

Colorado average 24.8

Citations per inspection
4.4

Colorado average 5.2


Health citations are formal notices following inspections when they fail to comply with safety and care standards.

18 of 22 citations resulted from standard inspections; and 4 of 22 resulted from complaint investigations.

Breakdown of citation severity (last 3 years)
Critical Health citations More info 0
100% better than Colorado average

Colorado average: 0.4


Serious Health citations More info 1
52% better than Colorado average

Colorado average: 2.1

0 critical citations More info Colorado average: 0.4

1 serious citation More info Colorado average: 2.1

21 moderate citations More info Colorado average: 22.2

0 minor citations More info Colorado average: 0.2
Citations history (last 3 years)
Infection Control moderate citation Info Issues related to preventing and controlling infections, including hygiene practices and safety protocols. Aug 21, 2025
Corrected

Infection Control moderate citation Info Issues related to preventing and controlling infections, including hygiene practices and safety protocols. Aug 21, 2025
Corrected

Nutrition moderate citation Info Issues related to food quality, meal service, and resident's nutritional needs. Aug 21, 2025
Corrected

Care Planning moderate citation Info Issues related to creating and updating personalized care plans for residents based on their needs and conditions. Aug 21, 2025
Corrected

Compare Assisted Living around Lafayette The information below is reported by the Colorado Department of Public Health and Environment, Health Facilities Division.

Filter by care type
ProMedica Assisted Living Lafayette
NH

Nursing Home Licensed facility providing 24/7 skilled nursing care for residents with complex, ongoing medical needs. Staffed by RNs, LPNs, and CNAs. Inspected and star-rated annually by CMS. Accepts Medicare (short-term rehab) and Medicaid (long-term care).

Lafayette
70
Yes
28
Private Rooms / Semi-Private Rooms

Places of interest near ProMedica Assisted Living Lafayette

Address 1.8 miles from city center — 3.79 miles to nearest hospital (AdventHealth Avista)

Address 329 Exempla Cir, Lafayette, CO 80026

Calculate Travel Distance to ProMedica Assisted Living Lafayette

Add your location

Address

Staffing Data (Q2 2025)

This data corresponds to Q2 2025 and is based on CMS Payroll-Based Journal.

Total staff 161
Employees 99
Contractors 62
Staff to resident ratio 4.13:1
117% better than Colorado average

Colorado average ratio: 1.91:1

Avg staff/day 37
Average shift 8.6 hours
0% compared with Colorado average

Colorado average: 8.3 hours

Total staff hours (quarter) 28,949
Nursing staff breakdown
Registered Nurse

Manages medical care and health needs.

Total count 17
Average shift length Info Average shift length. Calculated as total hours divided by days worked and average staff per day. 10.4 hours

This role is partially covered by contractors.

Licensed Practical Nurse

Assists with medical care and medications.

Total count 32
Average shift length Info Average shift length. Calculated as total hours divided by days worked and average staff per day. 8.5 hours

This role is partially covered by contractors.

Certified Nursing Assistant

Helps with daily care and mobility.

Total count 63
Average shift length Info Average shift length. Calculated as total hours divided by days worked and average staff per day. 9.2 hours

This role is partially covered by contractors.

Contractor staffing

Total hours from contractors

6.8%

1,955 contractor hours this quarter

Certified Nursing Assistant: 31 Licensed Practical Nurse: 18 Medication Aide/Technician: 10 Registered Nurse: 3
Staff by category
Certified Nursing Assistant3231638,95891100%9.2
Licensed Practical Nurse1418325,11991100%8.5
Registered Nurse143174,07891100%10.4
Medication Aide/Technician1010203,33891100%9.1
Physical Therapy Assistant5051,2838998%7
Other Dietary Services Staff3031,1488695%7.8
Speech Language Pathologist4048268189%6.2
Physical Therapy Aide3035406976%6.9
Nurse Practitioner1015206571%8
Dietitian1015196167%8.5
Administrator1015126470%8
Dental Services Staff1015126470%8
Respiratory Therapy Technician3035097279%6.9
Occupational Therapy Aide2024446673%6.7
Qualified Social Worker3033466774%5
RN Director of Nursing2022983943%7.6
63 Certified Nursing Assistant
% of Days 100%
32 Licensed Practical Nurse
% of Days 100%
17 Registered Nurse
% of Days 100%
20 Medication Aide/Technician
% of Days 100%
5 Physical Therapy Assistant
% of Days 98%
3 Other Dietary Services Staff
% of Days 95%
4 Speech Language Pathologist
% of Days 89%
3 Physical Therapy Aide
% of Days 76%
1 Nurse Practitioner
% of Days 71%
1 Dietitian
% of Days 67%
1 Administrator
% of Days 70%
1 Dental Services Staff
% of Days 70%
3 Respiratory Therapy Technician
% of Days 79%
2 Occupational Therapy Aide
% of Days 73%
3 Qualified Social Worker
% of Days 74%
2 RN Director of Nursing
% of Days 43%

Facility Characteristics

Source: CMS Long-Term Care Facility Characteristics (Data as of Jan 2026)

Total census
39 residents
Residents by payment source
Medicare
39 residents (100%)
Programs & Services
Residents' Group

Residents meet regularly to discuss policies, care quality, and activities

Family Member Group

Family members meet regularly to discuss policies, care quality, and activities

Nurse Aide Training

State-approved Nurse Aide Training and Competency Evaluation Program on-site

Active Family Council

Organized group of family members that meets regularly to discuss facility policies, resident care, and activities.

Active Resident Council

Organized group of residents that meets regularly to discuss facility policies, quality of life, and activities.

Quality of care over time

These measures show how residents usually do over time at this home, based on health outcomes and preventive care.

High-risk clinical events score Info A composite score based on pressure ulcers, falls with injury, weight loss, walking ability decline, and activities of daily living decline. 9.9
9% worse than Colorado average

Colorado average: 9.0

Functional decline score Info A composite score based on activities of daily living decline, walking ability decline, and incontinence. 16.7
11% better than Colorado average

Colorado average: 18.8

Long-stay resident measures
Need for Help with Daily Activities Increased Info Percent of long-stay residents whose need for help with daily activities has increased 8.9%
45% better than Colorado average

Colorado average: 16.0%

Walking Ability Worsened Info Percent of long-stay residents whose ability to move independently worsened 8.4%
50% better than Colorado average

Colorado average: 17.0%

Low Risk Residents with Bowel/Bladder Incontinence Info Percent of low risk long-stay residents who lose control of their bowels or bladder 32.8%
41% worse than Colorado average

Colorado average: 23.2%

Falls with Major Injury Info Percent of long-stay residents experiencing one or more falls with major injury 11.5%
247% worse than Colorado average

Colorado average: 3.3%

High Risk Residents with Pressure Ulcers Info Percent of long-stay high risk residents with pressure ulcers 9.5%
145% worse than Colorado average

Colorado average: 3.9%

Urinary Tract Infection Info Percent of long-stay residents with a urinary tract infection 2.0%
36% worse than Colorado average

Colorado average: 1.4%

Lost Too Much Weight Info Percent of long-stay residents who lose too much weight 10.9%
109% worse than Colorado average

Colorado average: 5.2%

Depressive Symptoms Info Percent of long-stay residents who have depressive symptoms 5.0%
30% better than Colorado average

Colorado average: 7.2%

Antipsychotic Use Info Percent of long-stay residents who received an antipsychotic medication 28.9%
54% worse than Colorado average

Colorado average: 18.8%

Pneumococcal Vaccine Info Percent of long-stay residents assessed and appropriately given the pneumococcal vaccine 94.2%
In line with Colorado average

Colorado average: 93.3%

Short-stay resident measures
Pneumococcal Vaccine Info Percent of short-stay residents assessed and appropriately given the pneumococcal vaccine 83.6%
9% better than Colorado average

Colorado average: 76.6%

Antipsychotic medication increase Info Percent of short-stay residents who newly received an antipsychotic medication 1.4%
In line with Colorado average

Colorado average: 1.4%

Influenza Vaccine Info Percent of short-stay residents assessed and appropriately given the seasonal influenza vaccine 60.9%
19% worse than Colorado average

Colorado average: 75.6%

Penalties and fines

Federal penalties imposed by CMS for regulatory violations, including civil money penalties (fines) and denials of payment for new Medicare/Medicaid admissions.

Source: CMS Penalties Database (Data as of Jan 2026)

Total fines amount $0
100% lower than Colorado average

Colorado average: $40K

Number of fines 0
100% fewer fines than Colorado average

Colorado average: 2.2

Payment Denials Info Serious action where Medicare and/or Medicaid temporarily stops payments for new residents until issues are fixed. 1
276% more payment denials than Colorado average

Colorado average: 0.3

Fines amount comparison
This facility $0
Colorado average $40K
Penalty History

Penalties are imposed by CMS for violations of federal nursing home regulations.

Payment Denial Info Serious action where Medicare and/or Medicaid temporarily stops payments for new residents until issues are fixed. Nov 13, 2024
5 days

Last updated: Jan 2026

Guides for Better Senior Living

Care Cost Calculator: See Prices in Your Area

Nursing Home Data Explorer

Don’t Wait Too Long: 7 Red Flag Signs Your Parent Needs Assisted Living Now

The True Cost of Assisted Living in 2025 – And How Families Are Paying For It

Understanding Senior Living Costs: Pricing Models, Discounts & Financial Assistance

Financial Aid for Colorado Seniors

Get financial aid guidance

Elderly, Blind, and Disabled Waiver

Colorado Medicaid EBD Waiver

Age 65+ or disabled, Colorado resident, Medicaid- eligible, nursing home-level care need.

~$2,829/month (300% FBR, individual).

$2,000 (individual), $3,000 (couple).

Requires level-of-care assessment by case manager.

Old Age Pension (OAP) Health Care Program

Colorado OAP

Age 60+, Colorado resident.

~$1,215/month (individual).

$2,000 (individual).

Supplements SSI; limited medical coverage.

Program of All-Inclusive Care for the Elderly (PACE)

Colorado Medicaid PACE

Age 55+, Colorado resident, nursing home-level care need, safe with PACE support.

~$2,829/month (300% FBR).

$2,000 (individual), $3,000 (couple).

Limited to specific regions (e.g., Denver, Pueblo).

Home Care Allowance (HCA)

Colorado Home Care Allowance (HCA)

Seniors typically 65+, Age 5+ with disability, Colorado resident, financial/functional need.

~$1,004/month (individual, stricter than waivers).

$2,000 (individual), $3,000 (couple).

Must need help with ADLs; not Medicaid-waiver eligible.

Senior Community Service Employment Program (SCSEP)

Colorado SCSEP (federally funded, state-administered)

Age 55+, unemployed, low-income, Colorado resident.

~$1,983/month (125% FPL, individual).

Not specified; income-focused.

Priority for veterans, rural residents.