Riverview Estates Rehabilitation and Senior Living

Assisted Living Home

Riverview Estates Rehabilitation and Senior Living

303 Bank Ave, Riverton, NJ 08077 View Map
Assisted Living Home
icon
Care Cost Calculator: See Prices in Your Area Care Cost Calculator: See Prices in Your Area icon
Overview of Riverview Estates Rehabilitation and Senior Living

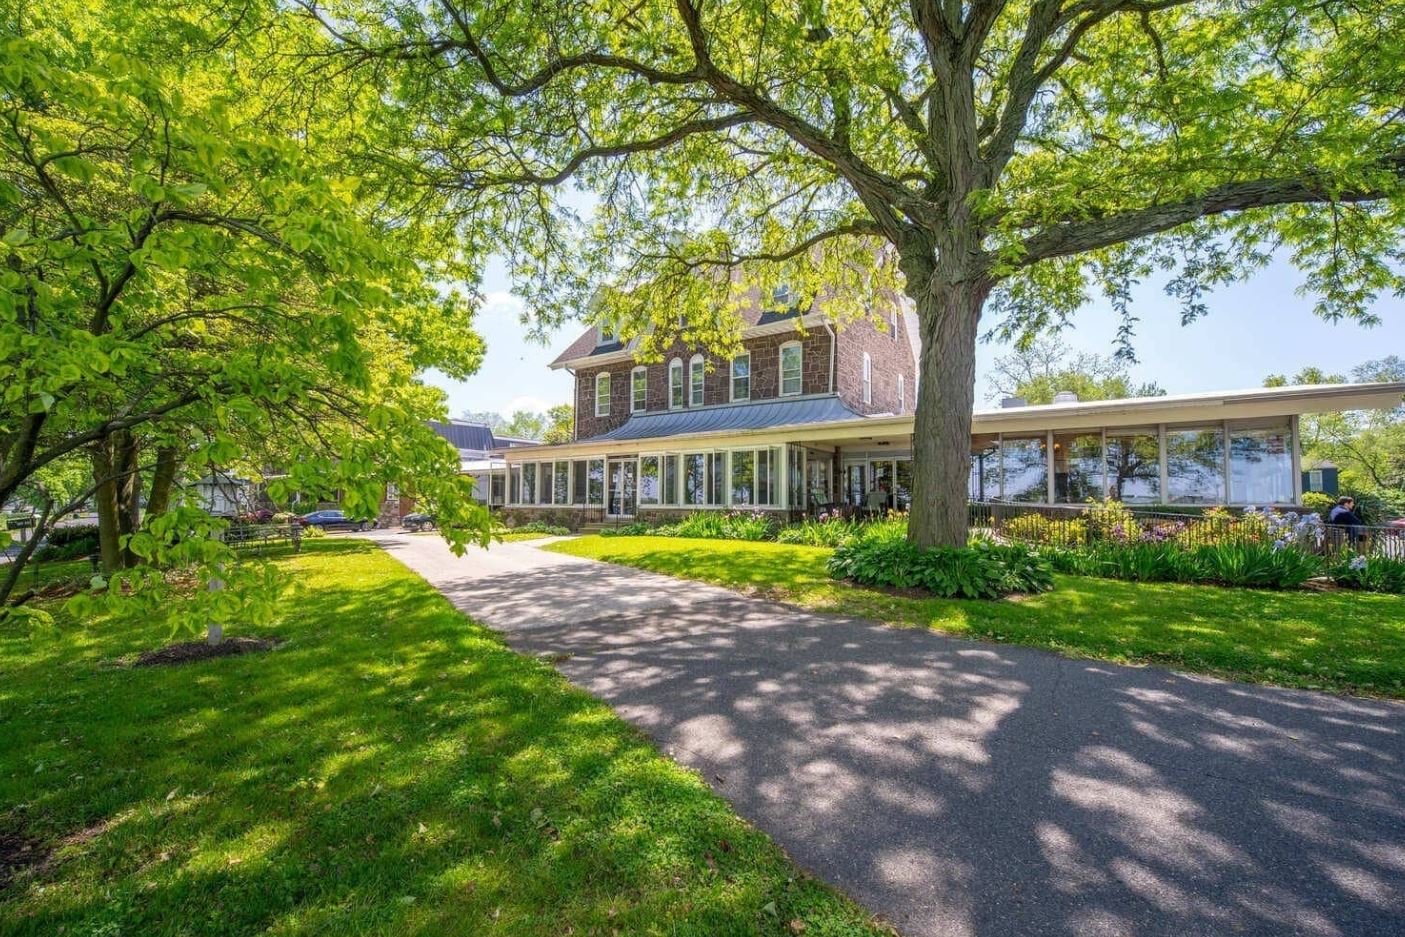
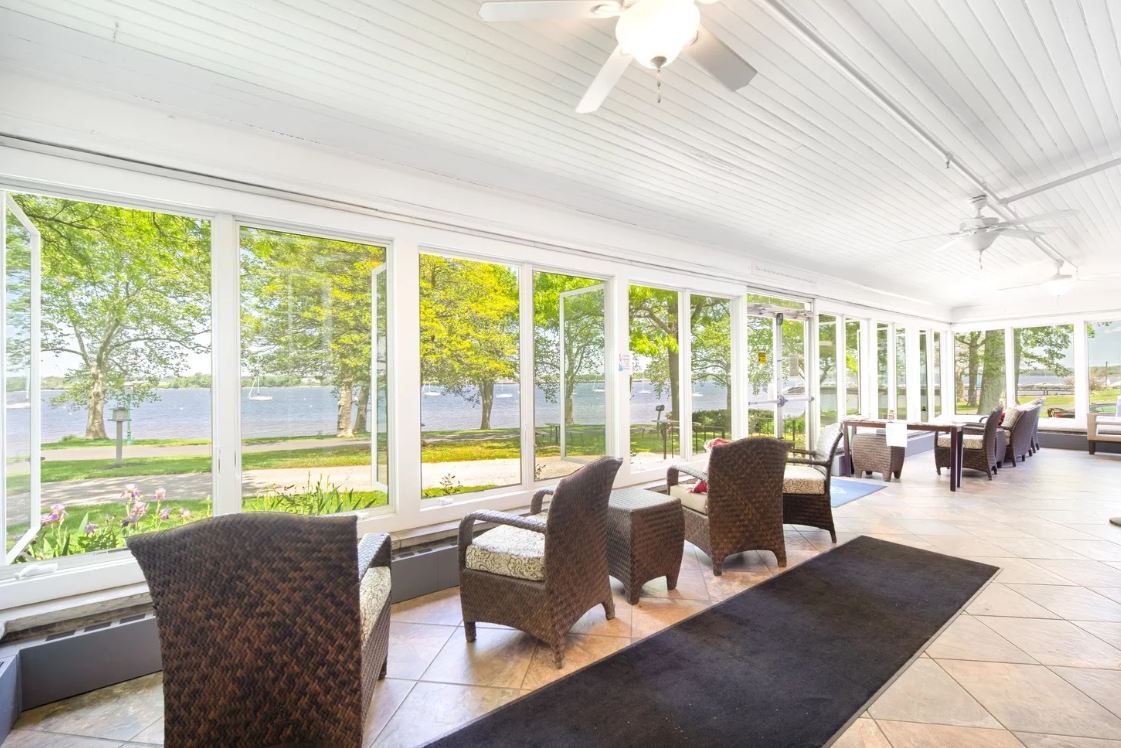
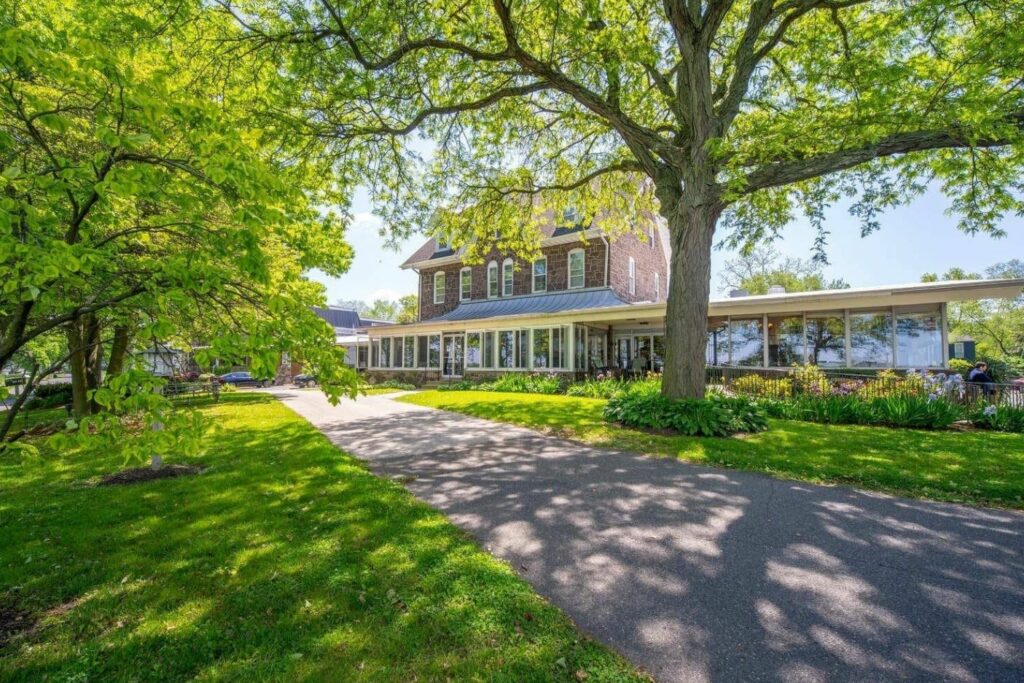
Nestled in peaceful Burlington County, NJ, the Riverview Estates Rehabilitation and Senior Living is a dedicated community that offers assisted living, subacute rehab, and respite care services. Here, the community treats its residents as family. Being a 122-bed campus with waterfront views throughout the building, this community stands out from the crowd. Currently, the community is under the leadership of Allaire Health Services which has a strong track record of transforming healthcare centers. With its highly skilled and dedicated team, residents receive 24/7 care and support from its on-staff concierge.

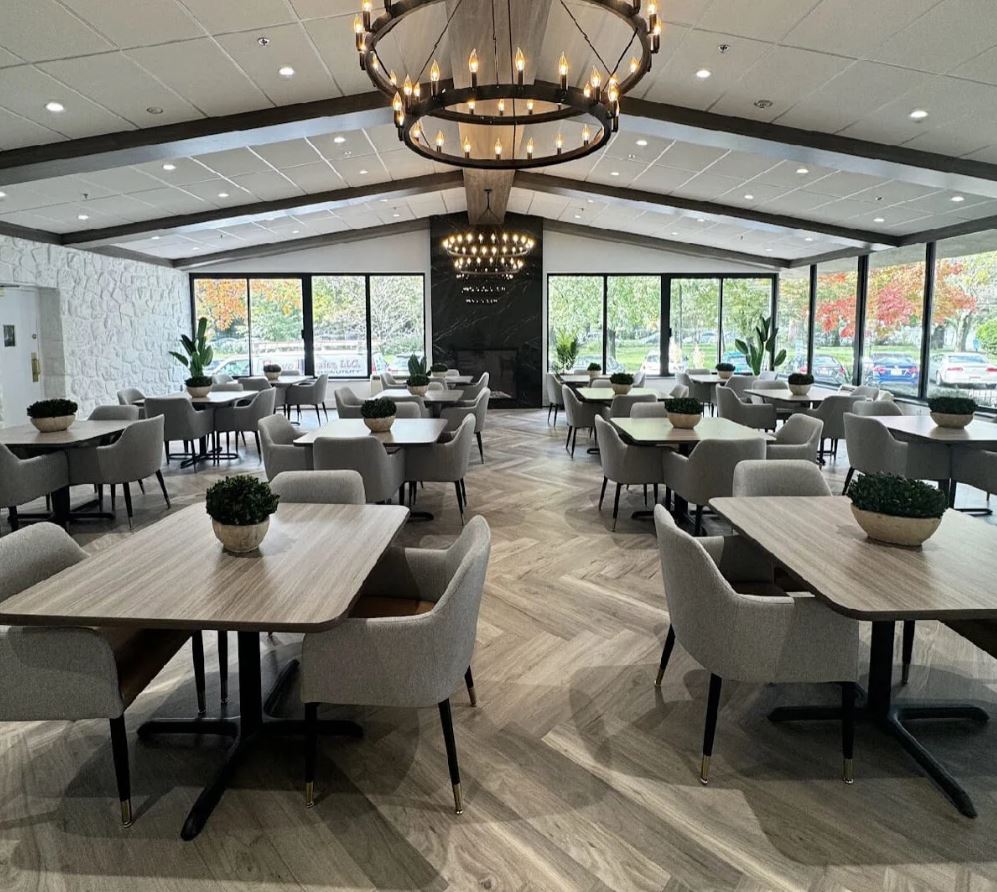
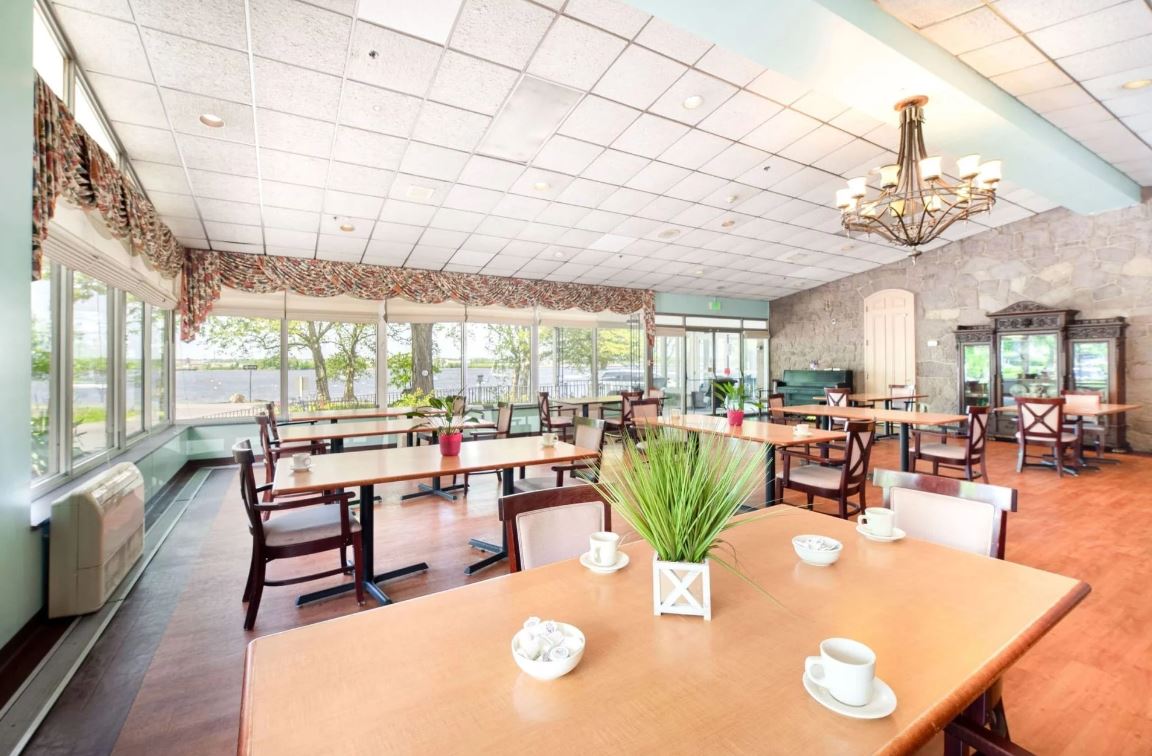
The community is committed to providing above-and-beyond amenities and services wherein residents can enjoy well-appointed private and semi-private suites, large flat-screen TVs, complimentary cable and wi-fi, spacious lounges and family areas, restaurant-style dining, dedicated patient concierge, lovely gardens and outdoor patio, beauty and barber salon, housekeeping and laundry, religious services, facility chapel and chaplain, full calendar of activities, and transportation to medical appointments. With its commitment to providing excellent care and services, seniors can never go wrong with the Riverview Estates Rehabilitation and Senior Living.

(856) 829-2274

Quality ratings

Measured by Centers for Medicare & Medicaid Services (CMS)

Overall rating Info Official CMS rating based on health inspections, staffing and quality measures.
2/5
New Jersey average: 3.3/5
Health Inspection Info Official CMS rating based on deficiencies found during state health inspections.
2/5
New Jersey average: 2.8/5
Staffing Info Official CMS rating based on nurse staffing hours per resident per day.
4/5
New Jersey average: 3.0/5
Quality Measures Info Official CMS rating based on clinical outcomes for residents.
4/5
New Jersey average: 4.3/5

Nursing care per resident

Info Average daily nursing hours per resident (adjusted for acuity). Higher values indicate more nursing time per resident.
4h 52m per day

This home provides 26% more nursing time per resident than the state average.

New Jersey average: 3h 53m per day

Capacity and availability

Smaller home

May offer a more intimate, personalized care environment.

Total beds 62

This home usually has availability

Lower occupancy suggests more openings may be available.

Lower demand than the New Jersey average
Occupancy rate 68%
Residents per day (avg) 55
Occupancy rate
68%
Residents per day (avg)
55

Who this home usually serves

TYPE OF STAY

Mostly short-term rehab stays

Most residents typically stay for a few weeks or months before returning home or moving on.

Might be optimal for
Short stays Recovery Medicare-covered care

Breakdown by payment type

Medicare

55% of new residents, usually for short-term rehab.

Typical stay 1 - 2 months

Private pay

43% of new residents, often for short stays.

Typical stay 1 years

Medicaid

2% of new residents, often for long-term daily care.

Typical stay 14 years

Finances and operations

Voluntary non-profit home
Other
Home revenue
$9.6M
Surplus of revenue
$529.9K
Voluntary non-profit home Other
Home revenue
$9,563,270.00
Surplus of revenue
$529,945.00
Payroll costs Info The portion of the home's budget spent on staff, including nurses, caregivers, and other employees who support care and operations.
$3.1M
32.9% of revenue
Other operating costs Info All remaining costs needed to run the home, such as food, utilities, building maintenance, supplies and administrative expenses.
$5.9M
Total costs $9.0M
Bed community size
62-bed community
A moderately sized community that may balance personal attention with shared amenities and social activities.
Walk Score
Walk Score: 34 / 100
Somewhat walkable. A few nearby services may be reachable on foot, but most trips require transportation.

About this community

Occupancy Rate
52%
Occupied Beds
32 of 62
Percentage of available beds currently in use by residents.
Facility Type
Comprehensive Personal Care Home
License Expiration
February 28, 2026

Additional licensing details

License number: 10C000

Ownership & operating entity

Riverview Estates Rehabilitation and Senior Living is legally operated by RIVERVIEW ESTATES REHABILITATION&SENIOR LIVING CTR, and administrated by JOANNA PASTORE.

Officers

Info Officers are individuals or entities with formal legal or financial responsibility for the organization that owns this facility

Benjamin Kurland, Naomi Kurland

Type Of Units

Comprehensive Personal Care
62 units
Total beds
62 units

Care Services

Nursing Services
Rehabilitation Services
Respite Care
Memory Care
Independent Living
Skilled Nursing
Licensed Nurses/CNAs
24-Hour Staffing
Short-Term Rehab

All Levels of Care

Long Term Care
Assisted Living
Short-term Rehabilitation
Memory Care

Amenities & Lifestyle

Complimentary Cable & Wi-Fi
Patient Concierge
Beautiful Atrium Dining Room
Computers Available To Help You Stay Connected
Lovely Courtyard & Manicured Atrium Garden
Full Calendar of Activities & Local Field Trips
Panadetic views of the Delaware River
Two Beautiful Porches
Weekly Religious Services
Out-of-Facility Transportation
Beauty & Barber Salon

Programs & Activities

Specific Programs
Subacute Rehabilitation, Orthopedic Rehabilitation, Cardiac Care, Long Term Care, Dementia Care, Palliative Care, Infection Control, Respite Care, Wound Care, Assisted Living, Victorian Suite
Religious Services
Yes

What does this home offer?

Housing options icon

Housing Options: Private Rooms / Semi-Private Rooms

Building type icon
Building type icon

Building Type: Two-story

Transportation services icon

Transportation Services

Types of Care at Riverview Estates Rehabilitation and Senior Living

Assisted Living Nursing Home Respite Care

Inspection History

In New Jersey, the Department of Health, Health Facilities Evaluation and Licensing conducts mandatory unannounced surveys to ensure facilities provide safe and effective resident care.

4 visits/inspections

3 complaint inspections

1 routine inspections

Latest inspection

Date:November 19, 2025

12 deficiencies

Deficiencies indicate regulatory issues. A higher number implies the facility had several areas requiring improvement.

3 deficiencies identified during routine visits

Deficiencies indicate regulatory issues. A higher number implies the facility had several areas requiring improvement.

Compare Assisted Living around Riverton

The information below is reported by the New Jersey Department of Health, Health Facilities Evaluation and Licensing.
Riverview Estates Rehabilitation and Senior Living
AL

Assisted Living For seniors needing help with daily tasks but not full-time nursing.

SNF

Nursing Homes 24/7 care needed

RC

Respite Care

Riverton
122
No
34
RIVERVIEW ESTATES REHABILITATION AND SENIOR LIVING CENTER
68.0%
$9,557,067.00
$3,146,986.00
32.9%
55.40
2/5
4.8738
2/5
4/5
4/5
1
17
1
-18%
+26%
-12%
Private Rooms / Semi-Private Rooms

Places of interest near Riverview Estates Rehabilitation and Senior Living

Address 0.4 miles from city center

Address 303 Bank Ave, Riverton, NJ 08077

Calculate Travel Distance to Riverview Estates Rehabilitation and Senior Living

Add your location

Address

Staffing Data

Source: CMS Payroll-Based Journal (Q2 2025)

90
Total Staff
88
Employees
2
Contractors
27,569
Total Hours (Quarter)
38
Avg Staff/Day
8
Avg Shift (hrs)
Nursing Staff Breakdown
Role Count Avg Shift (hrs) Uses Contractors?
Registered Nurse78.7 No
Licensed Practical Nurse198.4 No
Certified Nursing Assistant418.2 No
Staff by Category
Administration
2 staff
8hs shift avg
Nursing Staff
67 staff
8.3hs shift avg
Physicians & Practitioners
3 staff
7.7hs shift avg
Therapy Services
10 staff
6.8hs shift avg
Activities & Recreation
0 staff
0hs shift avg
Social Services
2 staff
7.9hs shift avg
Dietary Services
5 staff
6.4hs shift avg
Other Services
1 staff
8hs shift avg
Contractor Analysis
0.3%
of total hours from contractors
72 contractor hours this quarter
Medical Director: 1 Occupational Therapy Assistant: 1
Role Employees Contractors Total Staff Total Hours Days Worked % of Days Avg Shift (hrs)
Certified Nursing Assistant4104112,98591100%8.2
Licensed Practical Nurse190196,31491100%8.4
Registered Nurse7073,20091100%8.7
Other Dietary Services Staff4049127481%6.2
Respiratory Therapy Technician2025566369%7.8
Physical Therapy Assistant4045277279%7
Qualified Social Worker2024976369%7.9
Nurse Practitioner1014886167%8
Mental Health Service Worker1014806066%8
Dietitian1014566571%7
Physical Therapy Aide1014435965%7.5
Administrator1014245358%8
Clinical Nurse Specialist2021091719%6.4
Speech Language Pathologist2021063336%2.9
Medical Director0114867%8
Occupational Therapy Assistant0112433%8

Health Inspection History

Inspections
Total health inspections 2

New Jersey average 4


Last Health inspection on Sep 2024

Total health citations 17
Citations per inspection
8.5

Health citations are formal notices following inspections when they fail to comply with safety and care standards.

12 of 17 citations resulted from standard inspections; and 5 of 17 came from combined inspections (standard and complaint).

Breakdown of citation severity (last 3 years)
Critical Health citations More info 1
43% worse than New Jersey average

New Jersey average: 0.7


Serious Health citations More info 0
100% better than New Jersey average

New Jersey average: 0.4

1 critical citation More info New Jersey average: 0.7

0 serious citations More info New Jersey average: 0.4

16 moderate citations More info New Jersey average: 19.3

0 minor citations More info New Jersey average: 0.5
Citations history (last 3 years)
Infection Control moderate citation Sep 06, 2024
Corrected

Nursing Services moderate citation Sep 06, 2024
Corrected

Nutrition moderate citation Sep 06, 2024
Corrected

Pharmacy moderate citation Sep 06, 2024
Corrected

Facility Characteristics

Source: CMS Long-Term Care Facility Characteristics (Data as of Jan 2026)

Ownership: For-Profit LLC
Resident Census by Payment Source
50 Total Residents
Medicare 5 (10%)
Medicaid 28 (56%)
Private Pay/Other 17 (34%)
Programs & Services
Residents' Group
Family Member Group
Family Engagement

Active councils help families stay involved in care decisions and facility operations.

Quality of care over time

These measures show how residents usually do over time at this home, based on health outcomes and preventive care.

High-risk clinical events score Info A composite score based on pressure ulcers, falls with injury, weight loss, walking ability decline, and activities of daily living decline. 3.9
43% better than New Jersey average

New Jersey average: 6.8

Functional decline score Info A composite score based on activities of daily living decline, walking ability decline, and incontinence. 2.9
76% better than New Jersey average

New Jersey average: 12.4

Long-stay resident measures
Need for Help with Daily Activities Increased Info Percent of long-stay residents whose need for help with daily activities has increased 3.9%
62% better than New Jersey average

New Jersey average: 10.1%

Walking Ability Worsened Info Percent of long-stay residents whose ability to move independently worsened 2.5%
77% better than New Jersey average

New Jersey average: 11.0%

Low Risk Residents with Bowel/Bladder Incontinence Info Percent of low risk long-stay residents who lose control of their bowels or bladder 2.5%
85% better than New Jersey average

New Jersey average: 16.0%

Falls with Major Injury Info Percent of long-stay residents experiencing one or more falls with major injury 1.6%
34% better than New Jersey average

New Jersey average: 2.4%

High Risk Residents with Pressure Ulcers Info Percent of long-stay high risk residents with pressure ulcers 10.1%
66% worse than New Jersey average

New Jersey average: 6.1%

Urinary Tract Infection Info Percent of long-stay residents with a urinary tract infection 0.0%
100% better than New Jersey average

New Jersey average: 1.0%

Lost Too Much Weight Info Percent of long-stay residents who lose too much weight 1.3%
72% better than New Jersey average

New Jersey average: 4.6%

Depressive Symptoms Info Percent of long-stay residents who have depressive symptoms 5.6%
50% better than New Jersey average

New Jersey average: 11.3%

Antipsychotic Use Info Percent of long-stay residents who received an antipsychotic medication 4.9%
55% better than New Jersey average

New Jersey average: 11.1%

Pneumococcal Vaccine Info Percent of long-stay residents assessed and appropriately given the pneumococcal vaccine 87.6%
6% worse than New Jersey average

New Jersey average: 93.0%

Influenza Vaccine Info Percent of long-stay residents assessed and appropriately given the seasonal influenza vaccine 90.7%
7% worse than New Jersey average

New Jersey average: 97.2%

Short-stay resident measures
Pneumococcal Vaccine Info Percent of short-stay residents assessed and appropriately given the pneumococcal vaccine 45.6%
42% worse than New Jersey average

New Jersey average: 78.9%

Antipsychotic medication increase Info Percent of short-stay residents who newly received an antipsychotic medication 0.0%
100% better than New Jersey average

New Jersey average: 1.2%

Influenza Vaccine Info Percent of short-stay residents assessed and appropriately given the seasonal influenza vaccine 35.4%
56% worse than New Jersey average

New Jersey average: 80.1%

Penalties and fines

Federal penalties imposed by CMS for regulatory violations, including civil money penalties (fines) and denials of payment for new Medicare/Medicaid admissions.

Source: CMS Penalties Database (Data as of Jan 2026)

Total fines amount $38K
50% lower than New Jersey average

New Jersey average: $77K

Number of fines 1
50% fewer fines than New Jersey average

New Jersey average: 2.0

Payment Denials Info Serious action where Medicare and/or Medicaid temporarily stops payments for new residents until issues are fixed. 0
100% fewer payment denials than New Jersey average

New Jersey average: 0.1

Fines amount comparison
This facility $38K
New Jersey average $77K
Penalty History

Penalties are imposed by CMS for violations of federal nursing home regulations.

Civil Money Penalty Info Fines imposed for noncompliance, which can be assessed per day or per instance of violation. Oct 30, 2023
$38K

Last updated: Jan 2026

Guides for Better Senior Living

Care Cost Calculator: See Prices in Your Area

Nursing Home Data Explorer

Don’t Wait Too Long: 7 Red Flag Signs Your Parent Needs Assisted Living Now

The True Cost of Assisted Living in 2025 – And How Families Are Paying For It

Understanding Senior Living Costs: Pricing Models, Discounts & Financial Assistance

Financial Aid for New Jersey Seniors

Get financial aid guidance

Managed Long Term Services and Supports

NJ Medicaid MLTSS

Age 65+ or disabled, New Jersey resident, Medicaid- eligible, nursing home-level care need.

~$2,829/month (300% FBR, individual).

$2,000 (individual), $3,000 (couple).

High urban demand; managed care model.

JACC (Jersey Assistance for Community Caregiving)

NJ JACC

Age 60+, New Jersey resident, at risk of nursing home.

~$2,500/month (individual, varies).

$40,000 (individual).

Higher asset limit; limited funding.

Pharmaceutical Assistance to the Aged and Disabled (PAAD)

New Jersey PAAD

Age 65+, NJ resident, enrolled in Medicare Part D or eligible.

~$42,142/year (individual), ~$49,209/year (couple).

Not assessed.

Copays $5 (generic), $7 (brand); covers Part D premiums up to benchmark.

Senior Gold Prescription Discount Program

New Jersey Senior Gold

Age 65+, NJ resident, enrolled in Medicare Part D or eligible.

~$42,142-$52,142/year (individual), ~$49,209-$59,209/year (couple).

Not assessed.

Copays $15 + 50% of remaining cost; no premium assistance.

Medicare Savings Program (MSP)

New Jersey Medicare Savings Program

Age 65+ or disabled, NJ resident, Medicare Part A/B.

~$2,510/month (QMB), ~$3,380/month (SLMB), ~$3,598/month (QI)—individual.

$9,430 (individual), $14,130 (couple).

Three tiers; no waitlist; includes Extra Help for Part D.

Senior Freeze (Property Tax Reimbursement)

New Jersey Senior Freeze

Age 65+ by Dec 31 prior year, NJ resident, homeowner, paid property taxes.

~$150,000/year (combined household, projected).

Not assessed; home ownership required.

Combines with ANCHOR/Stay NJ via PAS-1; annual application.

ANCHOR (Affordable NJ Communities for Homeowners and Renters)

New Jersey ANCHOR

Age 65+ prioritized, NJ resident, homeowner/renter, paid property taxes/rent.

~$150,000/year (homeowners), ~$75,000/year (renters).

Not assessed.

Combines with Senior Freeze/Stay NJ; broader than prior Homestead program.

Stay NJ

New Jersey Stay NJ

Age 65+ by Dec 31 prior year, NJ resident, homeowner, lived in home 10+ years.

~$500,000/year (projected, subject to final regs).

Not assessed; home ownership required.

Up to 50% tax credit (max $6,500); phased implementation.

Universal Service Fund (USF)

New Jersey Universal Service Fund

Age 65+ prioritized, NJ resident, utility customer, low-income.

~$3,970/month (individual, 185% FPL).

Not assessed; income-focused.

Must owe >$25 on bill; combines with LIHEAP if eligible.

Home Energy Assistance Program (LIHEAP)

New Jersey LIHEAP

Age 60+ prioritized, NJ resident, low-income household.

~$3,970/month (individual, 185% FPL).

Not assessed; income-focused.

Covers oil, gas, electric; emergency aid available.

NJ Family Caregiver Support Program (via NFCSP)

New Jersey Family Caregiver Support Program

Caregivers of 60+ needing care or 55+ caregivers of others; NJ resident; functional needs (2+ ADLs).

Prioritizes ~$24,980/year (individual); no strict cap.

Not assessed; need-based.

21 AAAs; rural/low-income priority.

VA Aid and Attendance (A&A) and Housebound Benefits

New Jersey VA Aid and Attendance/Housebound

Age 65+ or disabled veteran/spouse, NJ resident, wartime service, need for ADL help (A&A) or homebound.

Net income < ~$1,984/month (veteran with dependent, A&A); pension offsets income.

~$155,356 (net worth limit).

High veteran demand in urban/rural areas.

Who we are

Your Senior Care Partner, Every Step of the Way

We help families find affordable senior communities and unlock same day discounts, Medicaid, and Medicare options tailored to your needs.

Contact us Today