Explore Open Rooms
1 Contact details
2 What type of senior care service are you looking for?
3 What budget do you have in mind for senior care?
4 How soon do you need to find care?
5 Additional details

Thank you for your interest!

Our team will be in touch shortly to help with next steps.

Care Home in Westchester County

CMS overall rating Info The Overall CMS Rating combines results from health inspections, staffing levels and quality measures. Health inspections carry the most weight. Staffing and quality scores can increase or decrease the final rating based on performance compared to state and national standards.

Salem Hills Rehabilitation and Healthcare

Overview of Salem Hills Rehabilitation and Healthcare

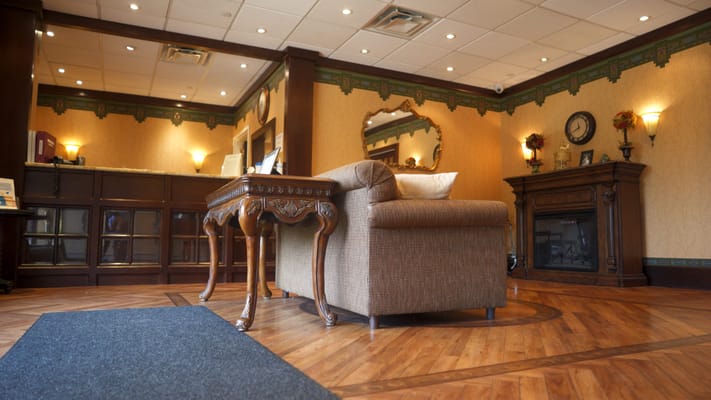
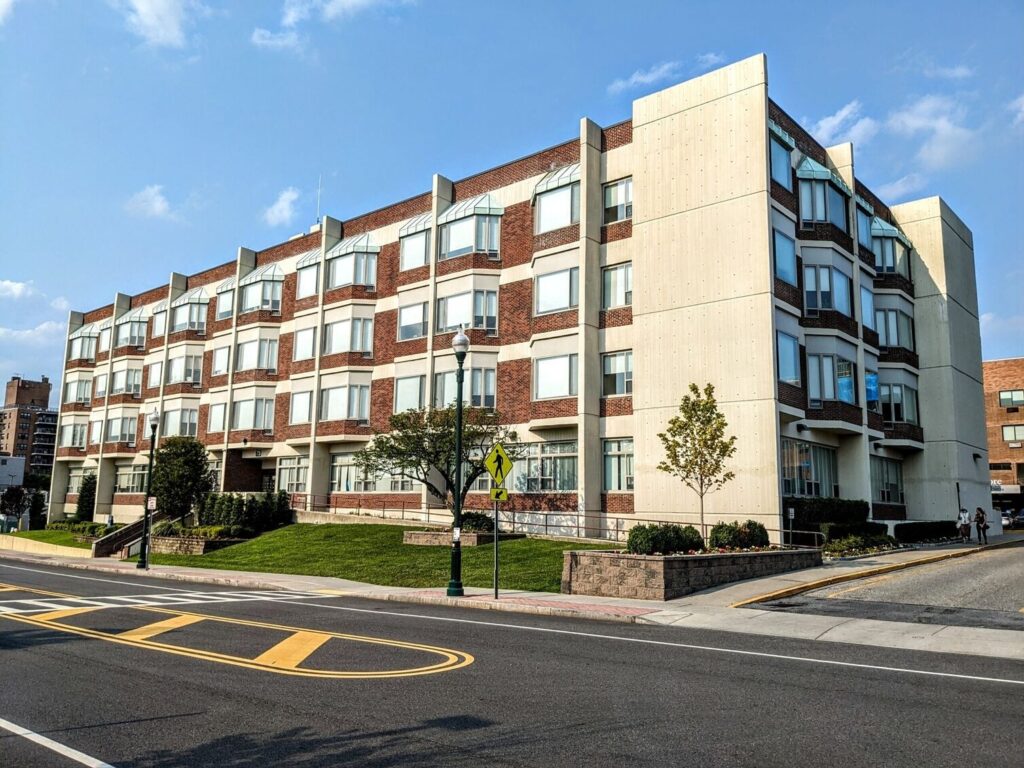
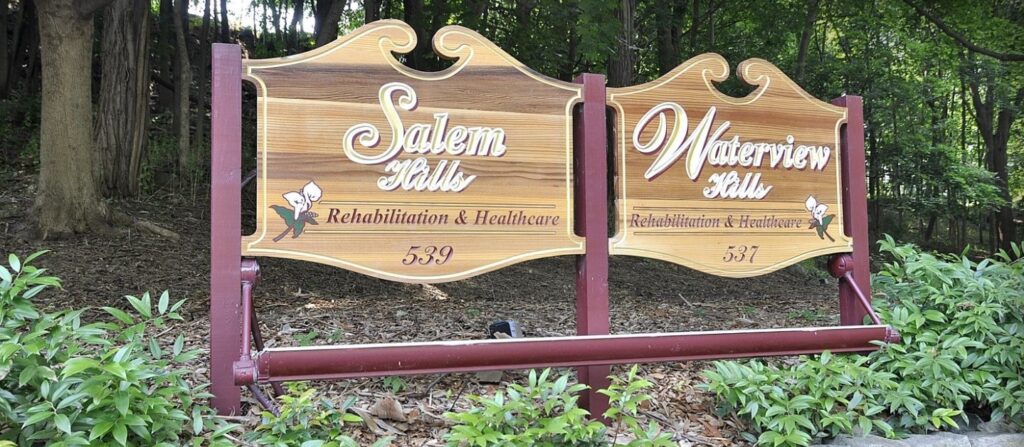
Receive the highest quality of care with Salem Hills Rehabilitation and Healthcare, a distinguished community set in the serene setting of Purdys, NY, offering long-term care, post-acute rehabilitation, and nursing services. Prioritizing residents’ well-being, the community provides exceptional care and assistance tailored to their needs to ensure comfort and safety. As a Medicare-certified community, residents experience the highest quality of care while staying on a budget.

Residents are not only well-cared for but are also happy and socially engaged, with the community’s variety of fun recreational activities and entertainment options. To keep residents healthy, meals are carefully curated by dietitians to meet dietary needs and preferences. Pain management, respite care, and social work services are also available to ensure a maintenance-free living. The community is ideal for those looking to recover from a condition and receive supplementary care to enhance their living conditions, especially with its comprehensive care and extensive amenities.

(914) 277-3691

Quality ratings

Measured by Centers for Medicare & Medicaid Services (CMS)

Overall rating Info The Overall CMS Rating combines results from health inspections, staffing levels and quality measures. Health inspections carry the most weight. Staffing and quality scores can increase or decrease the final rating based on performance compared to state and national standards.
3/5
New York average: 3.1/5
Health Inspection Info Based on the results of the facility's three most recent standard inspections and any complaint investigations. CMS reviews the number, scope, and severity of deficiencies, with more recent findings weighted more heavily.
3/5
New York average: 2.8/5
Staffing Info Measures average nursing staff hours per resident per day, including Registered Nurses (RNs) and total nursing staff. Ratings are adjusted based on the level of care residents require and are compared to state and national benchmarks.
2/5
New York average: 2.7/5
Quality Measures Info Based on clinical and physical health indicators reported to CMS, such as hospital readmissions, falls, pressure ulcers, and improvements in mobility. These measures reflect how well residents' health needs are being managed.
3/5
New York average: 4.0/5

Nursing care per resident

Info This shows how many total hours of nursing staff time are available per resident each day. Higher numbers usually mean more staff support.
2h 45m per day

This home provides 21% less nursing time per resident than the New York average.

New York average: 3h 29m per day

Staffing hours breakdown

Info Hours of care per resident per day, broken down by staff type. Data from CMS Medicare.
Staff type Facility State avg National avg
Registered Nurse (RN) Info Registered nurse hours per resident per day. 25m per day 42m per day 41m per day
Nurse Aide Info Nurse aide hours per resident per day. 1h 44m per day 2h 11m per day 2h 21m per day
Total Nursing (Weekend) Info Total number of nurse staff hours per resident per day on weekends. 2h 30m per day 3h 10m per day 3h 26m per day
Physical Therapist Info Physical therapist staff hours per resident per day. 8m per day 7m per day 4m per day
RN (Weekend) Info Registered nurse hours per resident per day on weekends. 21m per day 28m per day 29m per day

Capacity and availability

Medium-capacity home

Offers a balance of services and community atmosphere.

Total beds 126

This home is often near full

That suggests steady demand, but availability may be limited.

Higher demand than most homes in New York
Occupancy rate 97%
Residents per day (avg) 120
Occupancy rate
97%
Residents per day (avg)
120

Who this home usually serves

TYPE OF STAY

Mostly long-term care residents

Most residents stay for extended periods and receive ongoing daily care.

Might be optimal for
Long-term daily care Ongoing support needs

Breakdown by payment type

Medicare

15% of new residents, usually for short-term rehab.

Typical stay 3 - 4 months

Private pay

43% of new residents, often for short stays.

Typical stay 2 - 3 months

Medicaid

43% of new residents, often for long-term daily care.

Typical stay 9 - 10 months

Finances and operations

Privately-owned community
Operated by a partnership between two or more business owners.
Home revenue
$20.8M
Profit
$409.0K
Privately-owned community Operated by a partnership between two or more business owners.
Home revenue
$20.8M
Profit
$409.0K
Payroll costs Info The portion of the home's budget spent on staff, including nurses, caregivers, and other employees who support care and operations.
$9.2M
44.2% of revenue
Other operating costs Info All remaining costs needed to run the home, such as food, utilities, building maintenance, supplies and administrative expenses.
$11.2M
Total costs $20.4M
Bed community size
126-bed community
A larger shared setting that may offer more common spaces and organized community services.
Walk Score
Walk Score: 8 / 100
Car-dependent. Most errands require a car, with limited nearby walkable options.

About this community

License Details

Facility TypeNursing Home
CountyWestchester

Ownership & Operating Entity

Salem Hills Rehabilitation and Healthcare is legally operated by Salem Acquisition I, LLC (For Profit).

What does this home offer?

Accepts Medicaid icon

Accept Medicaid: Yes

Housing options icon

Housing Options: Private / Shared Rooms

Building type icon
Building type icon

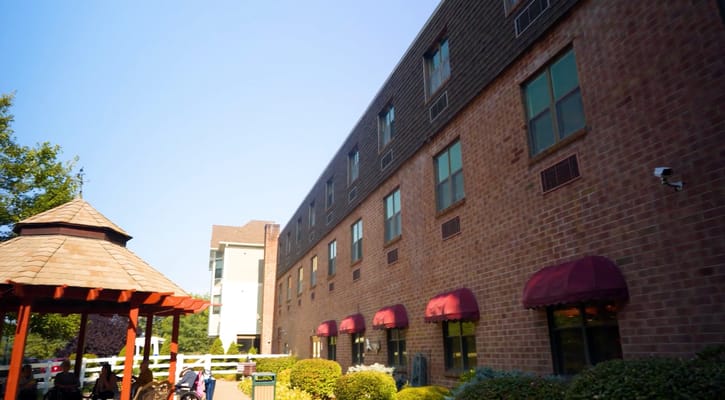
Building Type: 3-story
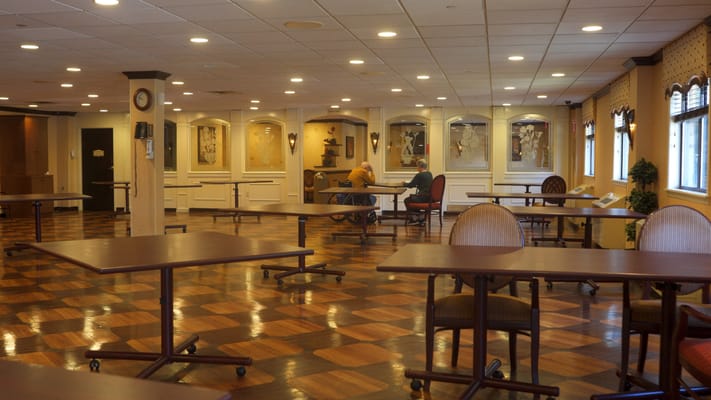
Dining services icon

Dining Services

Beauty services icon

Beauty Services

Housekeeping icon
Housekeeping icon

Housekeeping Services

Recreational activities icon

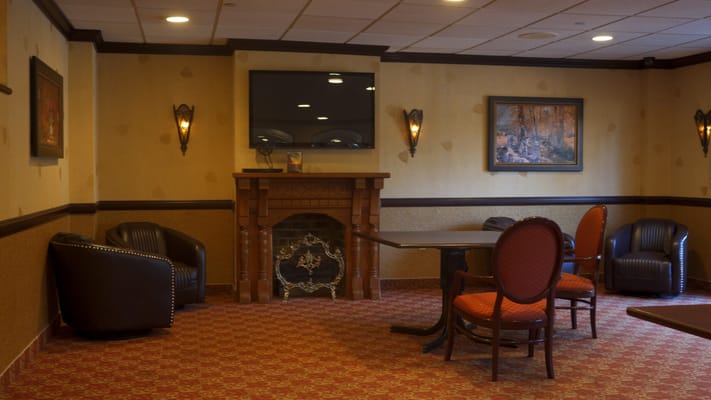
Recreational Activities

Exercise program icon

Exercise Programs

Types of Care at Salem Hills Rehabilitation and Healthcare

Care Home Respite Care

Contact Salem Hills Rehabilitation and Healthcare

Inspection History

In New York, the Department of Health, Office of Aging and Long Term Care performs unannounced onsite inspections to monitor compliance with state and federal healthcare regulations.

3 inspections

2 with citations, 1 without citations

3 on-site complaint investigations

New York average: 9 inspections (5 with citations), 15 on-site complaint investigations

17 complaints

13 complaints per 100 occupied beds

New York average: 49.9 complaints per 100 occupied beds

Formal expressions of dissatisfaction or concern made by residents, or their families regarding various aspects of the care, services, and environment provided.

New York average: 79 complaints

Latest inspection

Date May 16, 2024
Complaint Investigation

7 total citations

5 health citations 2 life safety citations

Citations indicate regulatory violations. A higher number implies the facility had several areas requiring improvement.

New York average: 29 citations

New York average: 20 health citations

New York average: 4 life safety citations

31 deficiencies

Deficiencies indicate regulatory issues. A higher number implies the facility had several areas requiring improvement.

New York average: 22 deficiencies

Health Inspection History

Inspections
Total health inspections 2

New York average 3.6


Last Health inspection on May 2024

Total health citations 12

New York average 18.5

Citations per inspection
6

New York average 5.05


Health citations are formal notices following inspections when they fail to comply with safety and care standards.

11 of 12 citations resulted from standard inspections; and 1 of 12 came from combined inspections (standard and complaint).

Breakdown of citation severity (last 3 years)
Critical Health citations More info 0
100% better than New York average

New York average: 0.2


Serious Health citations More info 0
100% better than New York average

New York average: 0.2

0 critical citations More info New York average: 0.2

0 serious citations More info New York average: 0.2

12 moderate citations More info New York average: 17.4

0 minor citations More info New York average: 0.7
Citations history (last 3 years)
Infection Control moderate citation Info Issues related to preventing and controlling infections, including hygiene practices and safety protocols. May 16, 2024
Corrected

Quality of Care moderate citation Info Issues related to how well residents receive appropriate treatment and support for their medical and daily care needs. May 16, 2024
Corrected

Quality of Care moderate citation Info Issues related to how well residents receive appropriate treatment and support for their medical and daily care needs. May 16, 2024
Corrected

Quality of Care moderate citation Info Issues related to how well residents receive appropriate treatment and support for their medical and daily care needs. May 16, 2024
Corrected

Compare Care Homes around Westchester County The information below is reported by the New York State Department of Health.

Filter by care type
Schaffer Extended Care Center
CH

Care Homes

NH

Nursing Home Licensed facility providing 24/7 skilled nursing care for residents with complex, ongoing medical needs. Staffed by RNs, LPNs, and CNAs. Inspected and star-rated annually by CMS. Accepts Medicare (short-term rehab) and Medicaid (long-term care).

New Rochelle
150
No
89
-
0
Private Rooms
Salem Hills Rehabilitation and Healthcare
NH

Nursing Home Licensed facility providing 24/7 skilled nursing care for residents with complex, ongoing medical needs. Staffed by RNs, LPNs, and CNAs. Inspected and star-rated annually by CMS. Accepts Medicare (short-term rehab) and Medicaid (long-term care).

CH

Care Homes

RC

Respite Care Short-term temporary care — days to weeks — to give family caregivers a break. Full care provided during the stay. Often used after hospitalization or to trial a facility before a permanent placement decision.

Purdys
126
No
8
Salem Acquisition I, Llc (For Profit)
3
Private / Shared Rooms
North Westchester Restorative Therapy and Nursing Center
CH

Care Homes

NH

Nursing Home Licensed facility providing 24/7 skilled nursing care for residents with complex, ongoing medical needs. Staffed by RNs, LPNs, and CNAs. Inspected and star-rated annually by CMS. Accepts Medicare (short-term rehab) and Medicaid (long-term care).

Mohegan Lake
120
No
43
Treetops Rehabilitation And Care Center, Llc (For Profit)
5
Private / Semi-Private Rooms
Tarrytown Rehabilitation and Nursing Center
CH

Care Homes

NH

Nursing Home Licensed facility providing 24/7 skilled nursing care for residents with complex, ongoing medical needs. Staffed by RNs, LPNs, and CNAs. Inspected and star-rated annually by CMS. Accepts Medicare (short-term rehab) and Medicaid (long-term care).

Tarrytown
120
No
90
Pharney Group, Llc (For Profit)
0
Private / Shared Suites

Places of interest near Salem Hills Rehabilitation and Healthcare

Address 0.8 miles from city center

Calculate Travel Distance to Salem Hills Rehabilitation and Healthcare

Add your location

Address

Staffing Data (Q2 2025)

This data corresponds to Q2 2025 and is based on CMS Payroll-Based Journal.

Total staff 132
Employees 117
Contractors 15
Staff to resident ratio 1.06:1
502% better than New York average

New York average ratio: 0.18:1

Avg staff/day 59
Average shift 7.9 hours
0% compared with New York average

New York average: 7.7 hours

Total staff hours (quarter) 42,482
Nursing staff breakdown
Registered Nurse

Manages medical care and health needs.

Total count 15
Average shift length Info Average shift length. Calculated as total hours divided by days worked and average staff per day. 7.7 hours

This role is partially covered by contractors.

Licensed Practical Nurse

Assists with medical care and medications.

Total count 12
Average shift length Info Average shift length. Calculated as total hours divided by days worked and average staff per day. 8.7 hours

No contractors work on this role.

Certified Nursing Assistant

Helps with daily care and mobility.

Total count 38
Average shift length Info Average shift length. Calculated as total hours divided by days worked and average staff per day. 9.4 hours

No contractors work on this role.

Contractor staffing

Total hours from contractors

3.4%

1,449 contractor hours this quarter

Qualified Social Worker: 4 Occupational Therapy Assistant: 3 Registered Nurse: 2 Physical Therapy Assistant: 2 Clinical Nurse Specialist: 2 RN Director of Nursing: 1 Medical Director: 1
Staff by category
Certified Nursing Assistant3803819,67491100%9.4
Licensed Practical Nurse120125,91491100%8.7
Registered Nurse132155,10691100%7.7
Other Dietary Services Staff170174,16991100%7.5
Physical Therapy Assistant6281,7806875%6
Respiratory Therapy Technician5051,4627684%7.2
Administrator2026906268%7.5
Qualified Social Worker0444946774%7.2
Speech Language Pathologist3034766167%7.4
Physical Therapy Aide2024476167%7.3
Mental Health Service Worker2024225662%7.2
Nurse Practitioner1014205662%7.5
Occupational Therapy Aide2023414549%7.3
Qualified Activities Professional60629491100%1.8
Other Physician5052746571%3.8
RN Director of Nursing1122486167%3.9
Clinical Nurse Specialist0221071719%5.6
Occupational Therapy Assistant033621618%2.9
Nurse Aide in Training1014567%7.5
Medical Director011393943%1
Feeding Assistant1012055%4
38 Certified Nursing Assistant
% of Days 100%
12 Licensed Practical Nurse
% of Days 100%
15 Registered Nurse
% of Days 100%
17 Other Dietary Services Staff
% of Days 100%
8 Physical Therapy Assistant
% of Days 75%
5 Respiratory Therapy Technician
% of Days 84%
2 Administrator
% of Days 68%
4 Qualified Social Worker
% of Days 74%
3 Speech Language Pathologist
% of Days 67%
2 Physical Therapy Aide
% of Days 67%
2 Mental Health Service Worker
% of Days 62%
1 Nurse Practitioner
% of Days 62%
2 Occupational Therapy Aide
% of Days 49%
6 Qualified Activities Professional
% of Days 100%
5 Other Physician
% of Days 71%
2 RN Director of Nursing
% of Days 67%
2 Clinical Nurse Specialist
% of Days 19%
3 Occupational Therapy Assistant
% of Days 18%
1 Nurse Aide in Training
% of Days 7%
1 Medical Director
% of Days 43%
1 Feeding Assistant
% of Days 5%

Facility Characteristics

Source: CMS Long-Term Care Facility Characteristics (Data as of Jan 2026)

Total census
125 residents
Residents by payment source
Medicare
10 residents (8%)
Medicaid
98 residents (78.4%)
Private pay or other
17 residents (13.6%)
Programs & Services
Residents' Group

Residents meet regularly to discuss policies, care quality, and activities

Family Member Group

Family members meet regularly to discuss policies, care quality, and activities

Nurse Aide Training

State-approved Nurse Aide Training and Competency Evaluation Program on-site

Active Family Council

Organized group of family members that meets regularly to discuss facility policies, resident care, and activities.

Active Resident Council

Organized group of residents that meets regularly to discuss facility policies, quality of life, and activities.

Quality of care over time

These measures show how residents usually do over time at this home, based on health outcomes and preventive care.

High-risk clinical events score Info A composite score based on pressure ulcers, falls with injury, weight loss, walking ability decline, and activities of daily living decline. 10.3
In line with New York average

New York average: 9.8

Functional decline score Info A composite score based on activities of daily living decline, walking ability decline, and incontinence. 16.5
9% better than New York average

New York average: 18.1

Long-stay resident measures
Significantly above average New York avg: 4.3 Info CMS star rating based on long-stay quality measure performance. 5 stars = significantly above average, 1 star = significantly below average.
Need for Help with Daily Activities Increased Info Percent of long-stay residents whose need for help with daily activities has increased 21.2%
29% worse than New York average

New York average: 16.4%

Walking Ability Worsened Info Percent of long-stay residents whose ability to move independently worsened 19.8%
20% worse than New York average

New York average: 16.6%

Low Risk Residents with Bowel/Bladder Incontinence Info Percent of low risk long-stay residents who lose control of their bowels or bladder 8.4%
61% better than New York average

New York average: 21.4%

Falls with Major Injury Info Percent of long-stay residents experiencing one or more falls with major injury 3.0%
In line with New York average

New York average: 3.0%

High Risk Residents with Pressure Ulcers Info Percent of long-stay high risk residents with pressure ulcers 1.8%
75% better than New York average

New York average: 7.2%

Urinary Tract Infection Info Percent of long-stay residents with a urinary tract infection 0.0%
100% better than New York average

New York average: 1.4%

Lost Too Much Weight Info Percent of long-stay residents who lose too much weight 5.7%
6% better than New York average

New York average: 6.1%

Depressive Symptoms Info Percent of long-stay residents who have depressive symptoms 11.1%
39% better than New York average

New York average: 18.1%

Antipsychotic Use Info Percent of long-stay residents who received an antipsychotic medication 11.8%
7% better than New York average

New York average: 12.6%

Pneumococcal Vaccine Info Percent of long-stay residents assessed and appropriately given the pneumococcal vaccine 94.9%
In line with New York average

New York average: 91.4%

Influenza Vaccine Info Percent of long-stay residents assessed and appropriately given the seasonal influenza vaccine 99.2%
In line with New York average

New York average: 95.2%

Hospitalizations per 1,000 days Info Number of hospitalizations per 1,000 long-stay resident days. 1.64
In line with New York average

New York average: 1.71

ED visits per 1,000 days Info Number of outpatient emergency department visits per 1,000 long-stay resident days. 1.03
24% better than New York average

New York average: 1.35

Short-stay resident measures
Average New York avg: 3.7 Info CMS star rating based on short-stay quality measure performance. 5 stars = much above average, 1 star = much below average.
Pneumococcal Vaccine Info Percent of short-stay residents assessed and appropriately given the pneumococcal vaccine 27.9%
64% worse than New York average

New York average: 76.6%

Re-hospitalized after SNF stay Info Percentage of short-stay residents who were re-hospitalized after their nursing home admission. 12.7%
38% better than New York average

New York average: 20.6%

Emergency department visits Info Percentage of short-stay residents who had an outpatient emergency department visit. 9.7%
In line with New York average

New York average: 9.7%

Falls with major injury Info Percentage of SNF residents who experience falls with major injury during their stay. 2.1%
177% worse than New York average

New York average: 0.8%

Ability to care for self at discharge Info Percentage of residents at or above expected ability to care for themselves at discharge. 26.5%
51% worse than New York average

New York average: 53.7%

Successful return to home or community Info Rate of successful return to home or community from a skilled nursing facility. 24.2%
52% worse than New York average

New York average: 50.6%

Guides for Better Senior Living

Care Cost Calculator: See Prices in Your Area

Nursing Home Data Explorer

Don’t Wait Too Long: 7 Red Flag Signs Your Parent Needs Assisted Living Now

The True Cost of Assisted Living in 2025 – And How Families Are Paying For It

Understanding Senior Living Costs: Pricing Models, Discounts & Financial Assistance

Financial Aid for New York Seniors

Get financial aid guidance

Community First Choice Option

NY Medicaid CFCO

Age 65+ or disabled, New York resident, Medicaid- eligible, care need (not necessarily nursing home level).

~$2,829/month (300% FBR, individual).

$30,182 (individual, higher due to NY Medicaid expansion).

Higher asset limit; urban density increases demand.

Expanded In-Home Services for the Elderly Program (EISEP)

NY EISEP

Age 60+, New York resident, at risk of decline but not nursing home level.

~$2,500/month (individual, varies).

$15,000 (individual).

Cost-sharing required above certain income; urban/rural balance.

Senior Citizen Rent Increase Exemption (SCRIE)

NY SCRIE

Age 62+, NYC resident, live in rent-controlled/stabilized apartment, spend >1/3 of income on rent.

$50,000/year (household).

No strict asset cap, but income-focused eligibility.

Limited to NYC’s rent-regulated units; high demand in urban areas.

Senior Citizen Homeowners’ Exemption (SCHE)

NY SCHE

Age 65+, NYC resident, own and live in a 1-3 family home, co-op, or condo.

$58,399/year (household).

No strict asset cap, income-driven eligibility.

Applies only in NYC; excludes large apartment buildings.

New York Foundation for Senior Citizens (NYFSC) Home Sharing Program

NYFSC Home Sharing

One participant must be 60+ (host or guest), NYC resident, able to share living space.

No strict limit, but targets those needing cost relief.

Not applicable; focus on housing need.

Primarily NYC-focused; limited slots due to demand.