Skyline Heights Nursing and Rehabilitation

Nursing Home

Skyline Heights Nursing and Rehabilitation

1807 24th St W, Billings, MT 59101 View Map
Nursing Home
icon
Care Cost Calculator: See Prices in Your Area Care Cost Calculator: See Prices in Your Area icon
Overview of Skyline Heights Nursing and Rehabilitation

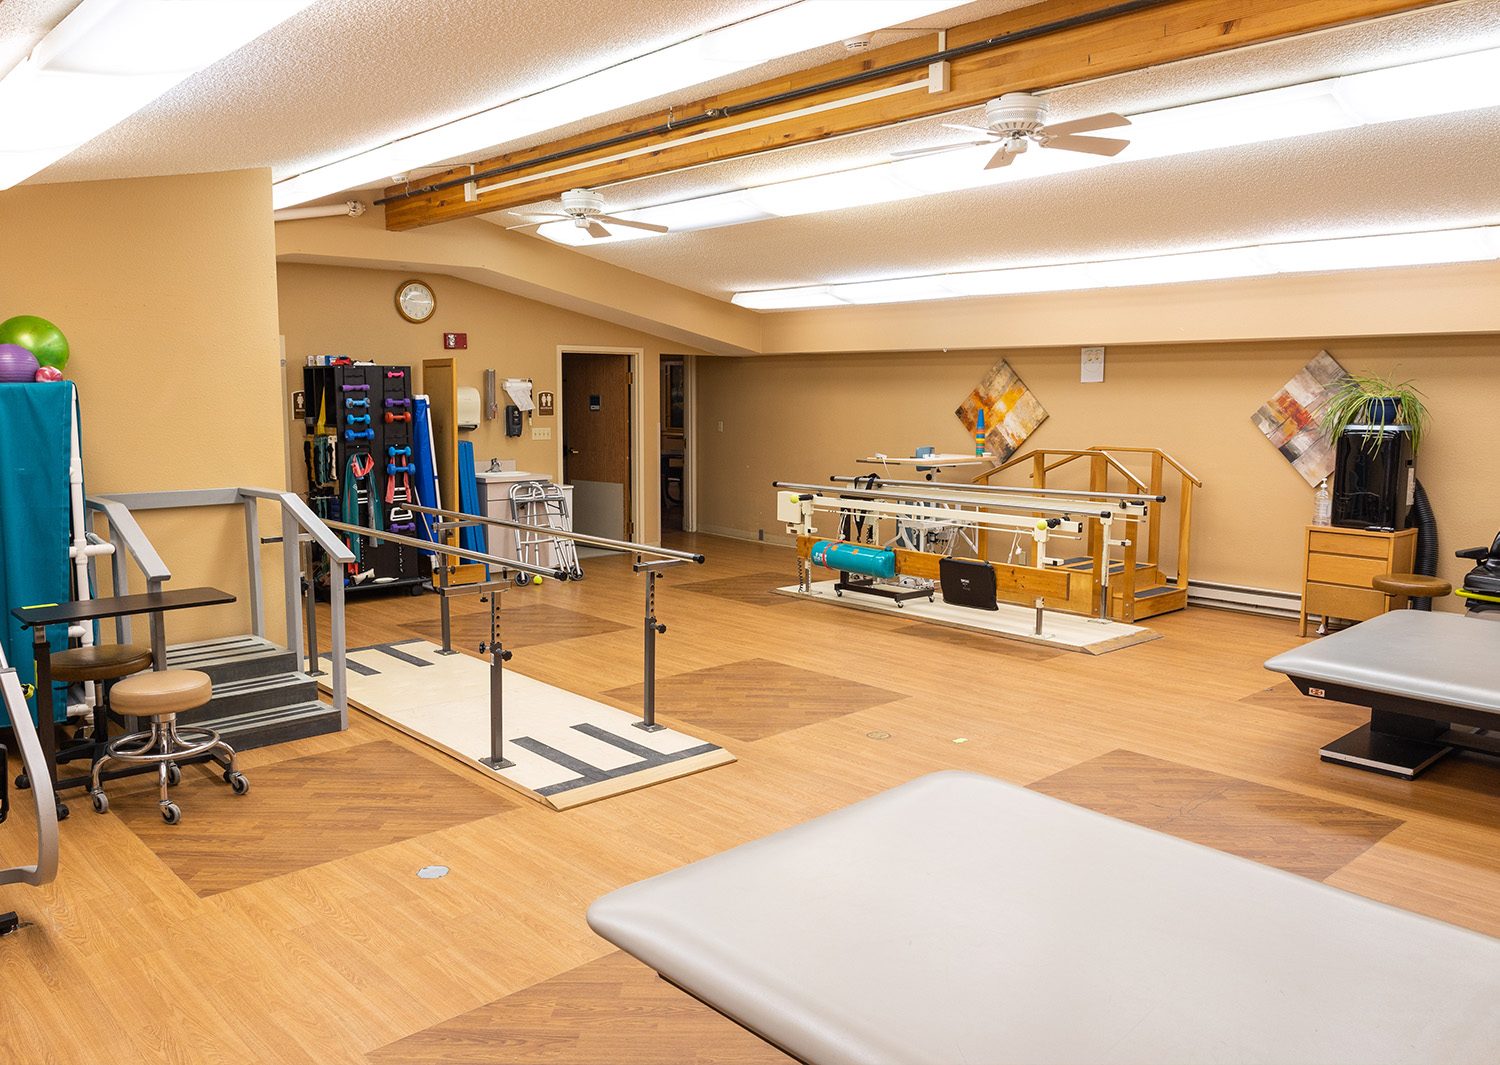
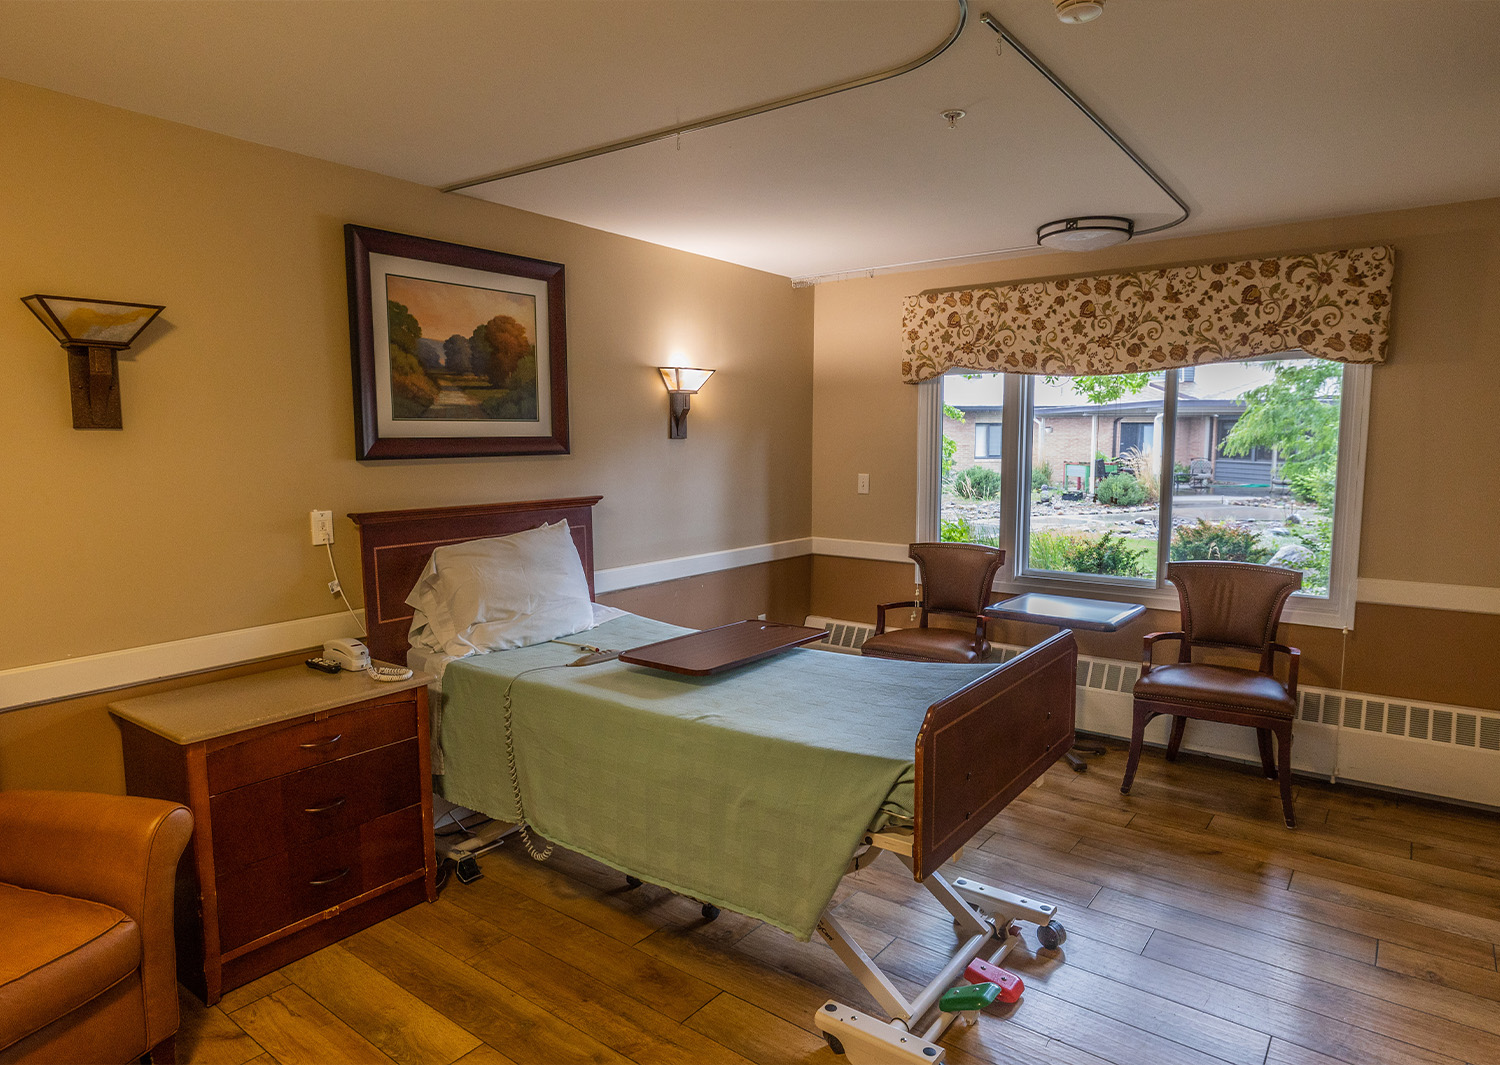
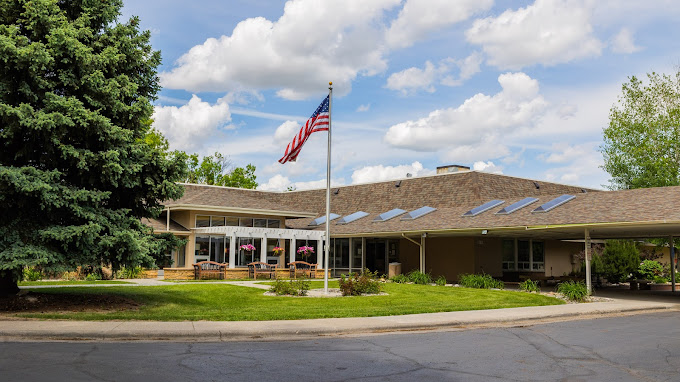
Overlooking Billings, Montana, Skyline Heights Healthcare (Formerly Valley Health Care Center) is an exceptional community that offers comprehensive skilled care services, including long-term care, short-term care, and various recovery therapies. Residents at Skyline Heights Healthcare can enjoy various activities and services designed to enhance their quality of life, including rehabilitation therapies, social services, and personalized care plans. With 24/7 professional support, the community is well-equipped to care for individuals with complex medical conditions or those recovering from surgery, illness, or injury.

Skyline Heights Healthcare strives to provide compassionate, personalized care tailored to each resident’s needs. Their goal is to create a comfortable and healing environment where every individual feels respected and valued. The community offers a range of amenities and programs, such as physical, occupational, and speech therapies, cardiac care, stroke recovery, wound care, and advanced therapy modalities. Additionally, they provide essential services like dental care, dialysis, hospice care, and podiatry services, ensuring comprehensive support for all residents.

(406) 656-5010

Quality ratings

Measured by Centers for Medicare & Medicaid Services (CMS)

Overall rating Info Official CMS rating based on health inspections, staffing and quality measures.
1/5
Montana average: 2.9/5
Health Inspection Info Official CMS rating based on deficiencies found during state health inspections.
1/5
Montana average: 2.8/5
Staffing Info Official CMS rating based on nurse staffing hours per resident per day.
1/5
Montana average: 3.2/5
Quality Measures Info Official CMS rating based on clinical outcomes for residents.
2/5
Montana average: 3.0/5

Nursing care per resident

Info Average daily nursing hours per resident (adjusted for acuity). Higher values indicate more nursing time per resident.
2h 59m per day

This home provides 34% less nursing time per resident than the state average.

Montana average: 4h 32m per day

Staffing hours breakdown

Info Hours of care per resident per day, broken down by staff type. Data from CMS Medicare.
Staff type Facility State avg National avg
Registered Nurse (RN) Info Registered nurse hours per resident per day. 44m per day 56m per day 41m per day
LPN / LVN Info Licensed Practical Nurse / Licensed Vocational Nurse hours per resident per day. 42m per day 30m per day 52m per day
Nurse Aide Info Nurse aide hours per resident per day. 1h 53m per day 2h 32m per day 2h 21m per day
Total Nursing (Weekend) Info Total number of nurse staff hours per resident per day on weekends. 2h 53m per day 3h 29m per day 3h 26m per day
Physical Therapist Info Physical therapist staff hours per resident per day. 9m per day 4m per day 4m per day
RN (Weekend) Info Registered nurse hours per resident per day on weekends. 35m per day 41m per day 29m per day

Capacity and availability

This home usually has availability

Lower occupancy suggests more openings may be available.

Lower demand than the Montana average
Occupancy rate 54.1%
Residents per day (avg) 71
Occupancy rate
54.1%
Residents per day (avg)
71

Who this home usually serves

TYPE OF STAY

Mix of rehab and long-term care

This home supports both short-term rehab and long-term care, with residents staying for a wide range of durations.

Breakdown by payment type

Medicare

37% of new residents, usually for short-term rehab.

Typical stay 22 days

Private pay

45% of new residents, often for short stays.

Typical stay 1 - 2 months

Medicaid

18% of new residents, often for long-term daily care.

Typical stay 7 - 8 months

Finances and operations

Proprietary home
Other
Home revenue
$6.3M
Operating loss
-$167.6K
Proprietary home Other
Home revenue
$6,266,230.00
Operating loss
$-167,634.00
Payroll costs Info The portion of the home's budget spent on staff, including nurses, caregivers, and other employees who support care and operations.
$2.2M
35.2% of revenue
Other operating costs Info All remaining costs needed to run the home, such as food, utilities, building maintenance, supplies and administrative expenses.
$4.2M
Total costs $6.4M
Years in operation
2 years in operation
A newer community that may feature more recent facilities and programs.
Walk Score
Walk Score: 57 / 100
Moderately walkable. Some errands can be accomplished on foot, with a mix of nearby amenities.

About this community

License Status
Current
Facility Type
Long Term Care
License Date
January 6, 2024
License Expiration
May 31, 2027

Additional licensing details

License number: 65

Ownership & operating entity

Skyline Heights Nursing and Rehabilitation is administrated by Rodenberger, Monica.

Care Services

Accepts Medicaid
Accepts Medicare
Nursing Services
Rehabilitation Services
Skilled Nursing
Licensed Nurses/CNAs

All Levels of Care

Skilled Nursing
Rehabilitation Therapy
Long-Term & Short-Term Care

Programs & Activities

Specific Programs
Skilled Nursing, Rehabilitation Therapy, Long-Term & Short-Term Care

What does this home offer?

Accepts Medicaid icon

Accept Medicaid: Yes

Building type icon
Building type icon

Building Type: Single-story

Care cost icon
Care cost icon

Care Cost

Types of Care at Skyline Heights Nursing and Rehabilitation

Nursing Home

Access & Eligibility

Ways to qualify for care at this community, including accepted programs and payment options.

Medicaid Accepted

This facility is certified for eligible Medicaid services.

Medicare Accepted

This facility is certified for eligible Medicare services.

Payment & Funding Options

Medicaid Medicare

Compare Nursing Homes around Billings

The information below is reported by the Montana Department of Public Health and Human Services, Quality Assurance Division.
Yellowstone River Nursing and Rehabilitation
AL

Assisted Living For seniors needing help with daily tasks but not full-time nursing.

SNF

Nursing Homes 24/7 care needed

Billings
160
No
67
CALDWELL, SARAH
65.6%
$7,573,930.00
$3,542,199.00
46.8%
104.80
1/5
3.5685
1/5
2/5
2/5
3
49
5
+23%
-21%
+6%
Skyline Heights Nursing and Rehabilitation
SNF

Nursing Homes 24/7 care needed

Billings
150
No
57
PRECIADO, ANNA
54.1%
$6,265,886.00
$2,207,176.00
35.2%
70.70
1/5
2.9879
1/5
1/5
2/5
5
74
11
+12%
-34%
-12%
Billings Nursing and Rehab
HC

Hospice Care

MC

Memory Care Specialized care for those with Memory Loss, Alzheimer's, or dementia, ensuring safety and support.

SNF

Nursing Homes 24/7 care needed

Billings (South Side)
100
No
56
-
70.6%
$3,997,017.00
$1,184,478.00
29.6%
79.70
-
3.1488
-
-
-
4
45
3
-2%
-30%
+14%

Places of interest near Skyline Heights Nursing and Rehabilitation

Address 4.9 miles from city center — 0.72 miles to nearest hospital (Linde LLC)
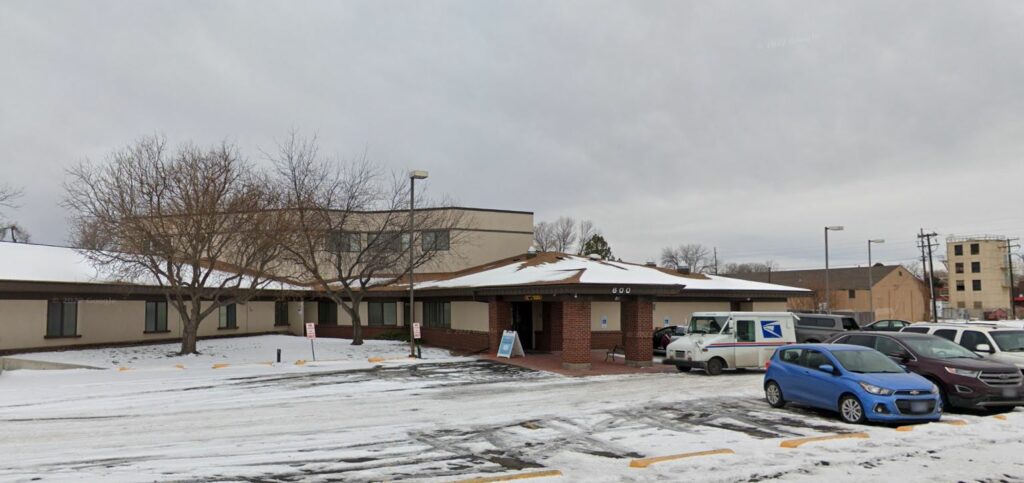
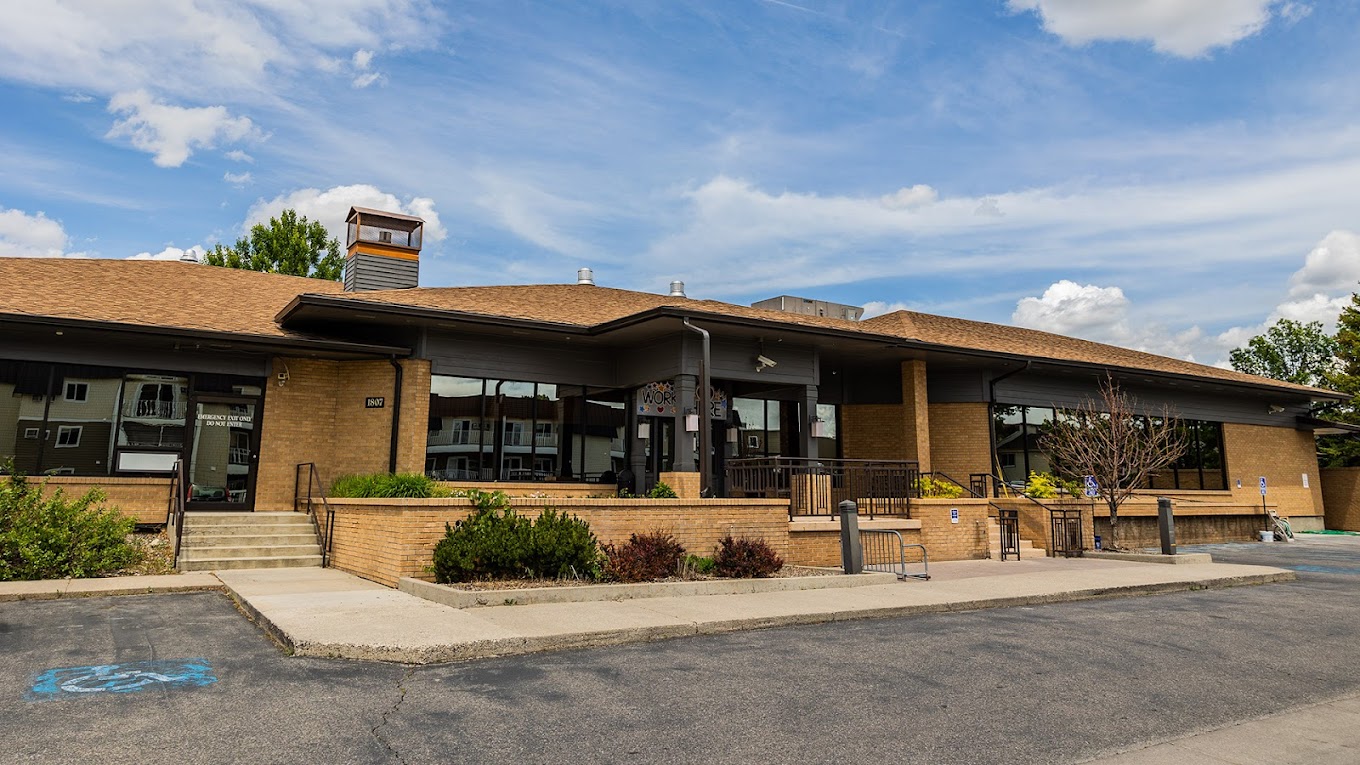
Address 1807 24th St W, Billings, MT 59101

Calculate Travel Distance to Skyline Heights Nursing and Rehabilitation

Add your location

Address

Staffing Data

Source: CMS Payroll-Based Journal (Q2 2025)

116
Total Staff
97
Employees
19
Contractors
26,642
Total Hours (Quarter)
32
Avg Staff/Day
9.2
Avg Shift (hrs)
Nursing Staff Breakdown
Role Count Avg Shift (hrs) Uses Contractors?
Registered Nurse2010.3 Yes
Licensed Practical Nurse1210.4 Yes
Certified Nursing Assistant4910 Yes
Staff by Category
Administration
1 staff
8hs shift avg
Nursing Staff
85 staff
10hs shift avg
Physicians & Practitioners
3 staff
8.1hs shift avg
Therapy Services
18 staff
7.4hs shift avg
Activities & Recreation
1 staff
8.3hs shift avg
Social Services
2 staff
7.3hs shift avg
Dietary Services
4 staff
7.2hs shift avg
Other Services
2 staff
8hs shift avg
Contractor Analysis
5.2%
of total hours from contractors
1,377 contractor hours this quarter
Registered Nurse: 6 Certified Nursing Assistant: 12 Licensed Practical Nurse: 1
Role Employees Contractors Total Staff Total Hours Days Worked % of Days Avg Shift (hrs)
Certified Nursing Assistant37124911,04391100%10
Registered Nurse146203,96891100%10.3
Licensed Practical Nurse111122,6778998%10.4
Physical Therapy Aide8081,8377886%7.3
Speech Language Pathologist5051,3497481%7.2
Respiratory Therapy Technician4041,0187178%7.4
Qualified Social Worker2028836875%7.3
RN Director of Nursing2026486167%8
Other Dietary Services Staff4045445459%7.2
Administrator1015126470%8
Dental Services Staff1014966268%8
Physical Therapy Assistant1014756066%7.9
Nurse Practitioner2024515662%8
Mental Health Service Worker1013924954%8
Therapeutic Recreation Specialist1012232730%8.3
Clinical Nurse Specialist1011081314%8.3
Medication Aide/Technician1011211%11.5
Nurse Aide in Training101722%3.4

Health Inspection History

Inspections
Total health inspections 9

Montana average 5.1


Last Health inspection on Mar 2025

Total health citations 74
Citations per inspection
8.22

Health citations are formal notices following inspections when they fail to comply with safety and care standards.

44 of 74 citations resulted from standard inspections; 16 of 74 resulted from complaint investigations; and 14 of 74 came from combined inspections (standard and complaint).

Breakdown of citation severity (last 3 years)
Critical Health citations More info 0
100% better than Montana average

Montana average: 0.3


Serious Health citations More info 11
400% worse than Montana average

Montana average: 2.2

0 critical citations More info Montana average: 0.3

11 serious citations More info Montana average: 2.2

61 moderate citations More info Montana average: 26.5

2 minor citations More info Montana average: 0.7
Citations history (last 3 years)
Abuse/Neglect serious citation Mar 27, 2025
Corrected

Nursing Services moderate citation Mar 27, 2025
Corrected

Nutrition moderate citation Mar 27, 2025
Corrected

Pharmacy moderate citation Mar 27, 2025
Corrected

Facility Characteristics

Source: CMS Long-Term Care Facility Characteristics (Data as of Jan 2026)

Ownership: For-Profit LLC
Resident Census by Payment Source
81 Total Residents
Medicare 10 (12.3%)
Medicaid 52 (64.2%)
Private Pay/Other 19 (23.5%)
Programs & Services
Residents' Group
Family Engagement

Active councils help families stay involved in care decisions and facility operations.

Quality of care over time

These measures show how residents usually do over time at this home, based on health outcomes and preventive care.

High-risk clinical events score Info A composite score based on pressure ulcers, falls with injury, weight loss, walking ability decline, and activities of daily living decline. 10.0
11% better than Montana average

Montana average: 11.2

Functional decline score Info A composite score based on activities of daily living decline, walking ability decline, and incontinence. 20.4
6% better than Montana average

Montana average: 21.8

Long-stay resident measures
Need for Help with Daily Activities Increased Info Percent of long-stay residents whose need for help with daily activities has increased 12.7%
35% better than Montana average

Montana average: 19.4%

Walking Ability Worsened Info Percent of long-stay residents whose ability to move independently worsened 25.0%
20% worse than Montana average

Montana average: 20.8%

Low Risk Residents with Bowel/Bladder Incontinence Info Percent of low risk long-stay residents who lose control of their bowels or bladder 23.6%
6% better than Montana average

Montana average: 25.2%

Falls with Major Injury Info Percent of long-stay residents experiencing one or more falls with major injury 3.9%
10% better than Montana average

Montana average: 4.3%

High Risk Residents with Pressure Ulcers Info Percent of long-stay high risk residents with pressure ulcers 3.6%
43% better than Montana average

Montana average: 6.3%

Urinary Tract Infection Info Percent of long-stay residents with a urinary tract infection 4.6%
68% worse than Montana average

Montana average: 2.8%

Lost Too Much Weight Info Percent of long-stay residents who lose too much weight 4.7%
24% better than Montana average

Montana average: 6.1%

Depressive Symptoms Info Percent of long-stay residents who have depressive symptoms 5.4%
14% worse than Montana average

Montana average: 4.7%

Antipsychotic Use Info Percent of long-stay residents who received an antipsychotic medication 14.4%
25% better than Montana average

Montana average: 19.1%

Pneumococcal Vaccine Info Percent of long-stay residents assessed and appropriately given the pneumococcal vaccine 94.9%
In line with Montana average

Montana average: 93.8%

Influenza Vaccine Info Percent of long-stay residents assessed and appropriately given the seasonal influenza vaccine 85.5%
9% worse than Montana average

Montana average: 93.7%

Hospitalizations per 1,000 days Info Number of hospitalizations per 1,000 long-stay resident days. 1.42
12% worse than Montana average

Montana average: 1.27

ED visits per 1,000 days Info Number of outpatient emergency department visits per 1,000 long-stay resident days. 1.64
24% better than Montana average

Montana average: 2.17

Short-stay resident measures
Pneumococcal Vaccine Info Percent of short-stay residents assessed and appropriately given the pneumococcal vaccine 88.9%
16% better than Montana average

Montana average: 76.4%

Antipsychotic medication increase Info Percent of short-stay residents who newly received an antipsychotic medication 2.3%
30% worse than Montana average

Montana average: 1.8%

Influenza Vaccine Info Percent of short-stay residents assessed and appropriately given the seasonal influenza vaccine 86.3%
17% better than Montana average

Montana average: 73.8%

Re-hospitalized after SNF stay Info Percentage of short-stay residents who were re-hospitalized after their nursing home admission. 20.1%
In line with Montana average

Montana average: 19.4%

Emergency department visits Info Percentage of short-stay residents who had an outpatient emergency department visit. 10.3%
31% better than Montana average

Montana average: 15.0%

Falls with major injury Info Percentage of SNF residents who experience falls with major injury during their stay. 0.0%
100% better than Montana average

Montana average: 0.8%

Ability to care for self at discharge Info Percentage of residents at or above expected ability to care for themselves at discharge. 49.0%
9% worse than Montana average

Montana average: 53.7%

Successful return to home or community Info Rate of successful return to home or community from a skilled nursing facility. 55.4%
10% better than Montana average

Montana average: 50.6%

Penalties and fines

Federal penalties imposed by CMS for regulatory violations, including civil money penalties (fines) and denials of payment for new Medicare/Medicaid admissions.

Source: CMS Penalties Database (Data as of Jan 2026)

Total fines amount $781K
796% higher than Montana average

Montana average: $87K

Number of fines 7
201% more fines than Montana average

Montana average: 2.3

Payment Denials Info Serious action where Medicare and/or Medicaid temporarily stops payments for new residents until issues are fixed. 2
1129% more payment denials than Montana average

Montana average: 0.2

Fines amount comparison
This facility $781K
Montana average $87K
Penalty History

Penalties are imposed by CMS for violations of federal nursing home regulations.

Civil Money Penalty Info Fines imposed for noncompliance, which can be assessed per day or per instance of violation. Nov 19, 2025
$104K
Civil Money Penalty Info Fines imposed for noncompliance, which can be assessed per day or per instance of violation. Aug 28, 2025
$112K
Civil Money Penalty Info Fines imposed for noncompliance, which can be assessed per day or per instance of violation. Jan 30, 2025
$385K
Payment Denial Info Serious action where Medicare and/or Medicaid temporarily stops payments for new residents until issues are fixed. Jan 30, 2025
56 days

Last updated: Jan 2026

Guides for Better Senior Living

Care Cost Calculator: See Prices in Your Area

Nursing Home Data Explorer

Don’t Wait Too Long: 7 Red Flag Signs Your Parent Needs Assisted Living Now

The True Cost of Assisted Living in 2025 – And How Families Are Paying For It

Understanding Senior Living Costs: Pricing Models, Discounts & Financial Assistance

Financial Aid for Montana Seniors

Get financial aid guidance

Big Sky Waiver

Montana Medicaid Big Sky Waiver

Age 65+ or disabled, Montana resident, Medicaid- eligible, nursing home-level care need.

~$2,829/month (300% FBR, individual).

$2,000 (individual), $3,000 (couple).

Rural state; limited providers in some areas.

Montana Community First Choice

MT CFC

Age 65+ or disabled, Montana resident, Medicaid- eligible.

~$1,732/month (individual, Medicaid threshold).

$2,000 (individual).

Less intensive than waiver; rural focus.

Big Sky Rx

Montana Big Sky Rx

Age 65+ or disabled, Montana resident, enrolled in Medicare Part D, income below limit.

~$2,510/month (individual), ~$3,380/month (couple).

Not assessed.

Covers up to $38.75/month premium; statewide via AAAs.

Medicare Savings Program (MSP)

Montana Medicare Savings Program

Age 65+ or disabled, Montana resident, Medicare Part A/B.

~$2,510/month (QMB), ~$3,380/month (SLMB), ~$3,598/month (QI)—individual.

$9,430 (individual), $14,130 (couple).

Three tiers; no waitlist; includes Extra Help for Part D.

Montana Caregiver Support Program (via NFCSP)

Montana Caregiver Support Program

Caregivers of 60+ needing care or 55+ caregivers of others; Montana resident; functional needs (2+ ADLs).

Prioritizes ~$24,980/year (individual); no strict cap.

Not assessed; need-based.

10 AAAs; prioritizes low-income, rural caregivers.

Senior Community Service Employment Program (SCSEP)

Montana SCSEP

Age 55+, unemployed, low-income, Montana resident.

~$1,983/month (125% FPL).

Not specified; income-focused.

Priority for veterans, rural residents; AARP partnership.

VA Aid and Attendance (A&A) and Housebound Benefits

Montana VA Aid and Attendance/Housebound

Age 65+ or disabled veteran/spouse, Montana resident, wartime service, need for ADL help (A&A) or homebound.

Net income < ~$1,984/month (veteran with dependent, A&A); pension offsets income.

~$155,356 (net worth limit).

High veteran demand in rural areas.

Who we are

Your Senior Care Partner, Every Step of the Way

We help families find affordable senior communities and unlock same day discounts, Medicaid, and Medicare options tailored to your needs.

Contact us Today