Explore Open Rooms

1 Contact details
2 What type of senior care service are you looking for?
3 What budget do you have in mind for senior care?
4 How soon do you need to find care?
5 Additional details

Thank you for your interest!

Our team will be in touch shortly to help with next steps.

Assisted Living Home

St. Joseph Village of Chicago

Assisted Living Home

St. Joseph Village of Chicago

4021 W Belmont Ave, Chicago, IL 60641 View map
Overview of St. Joseph Village of Chicago

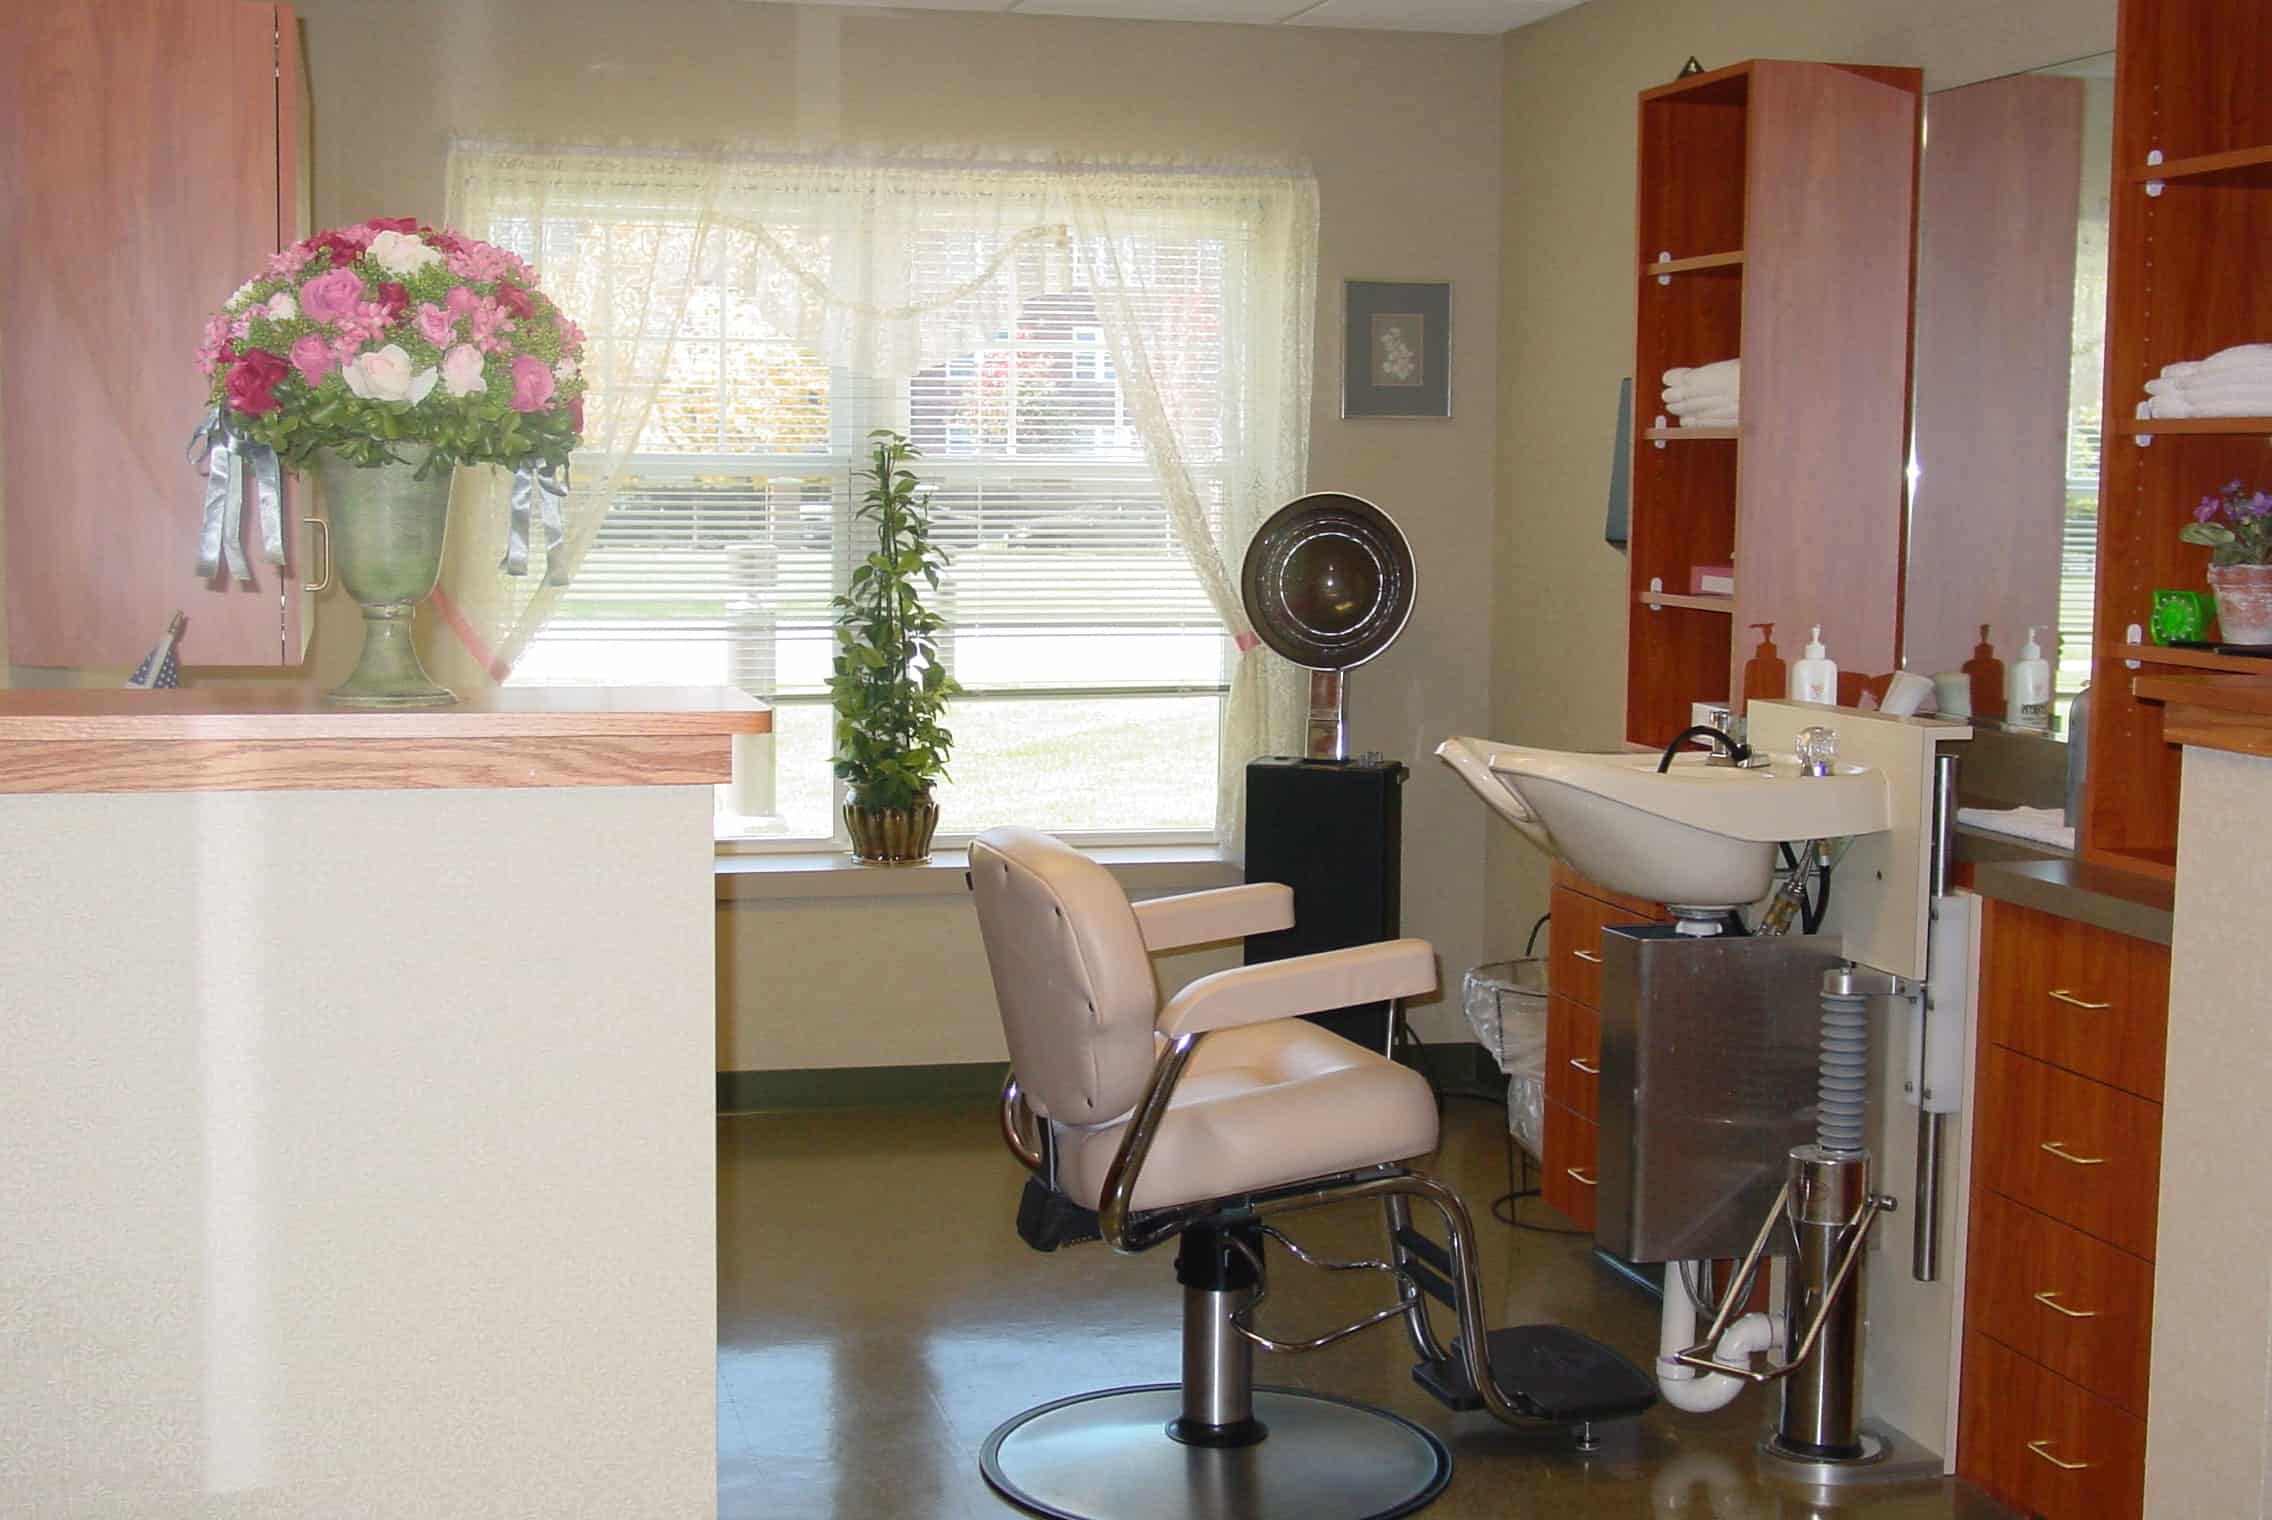
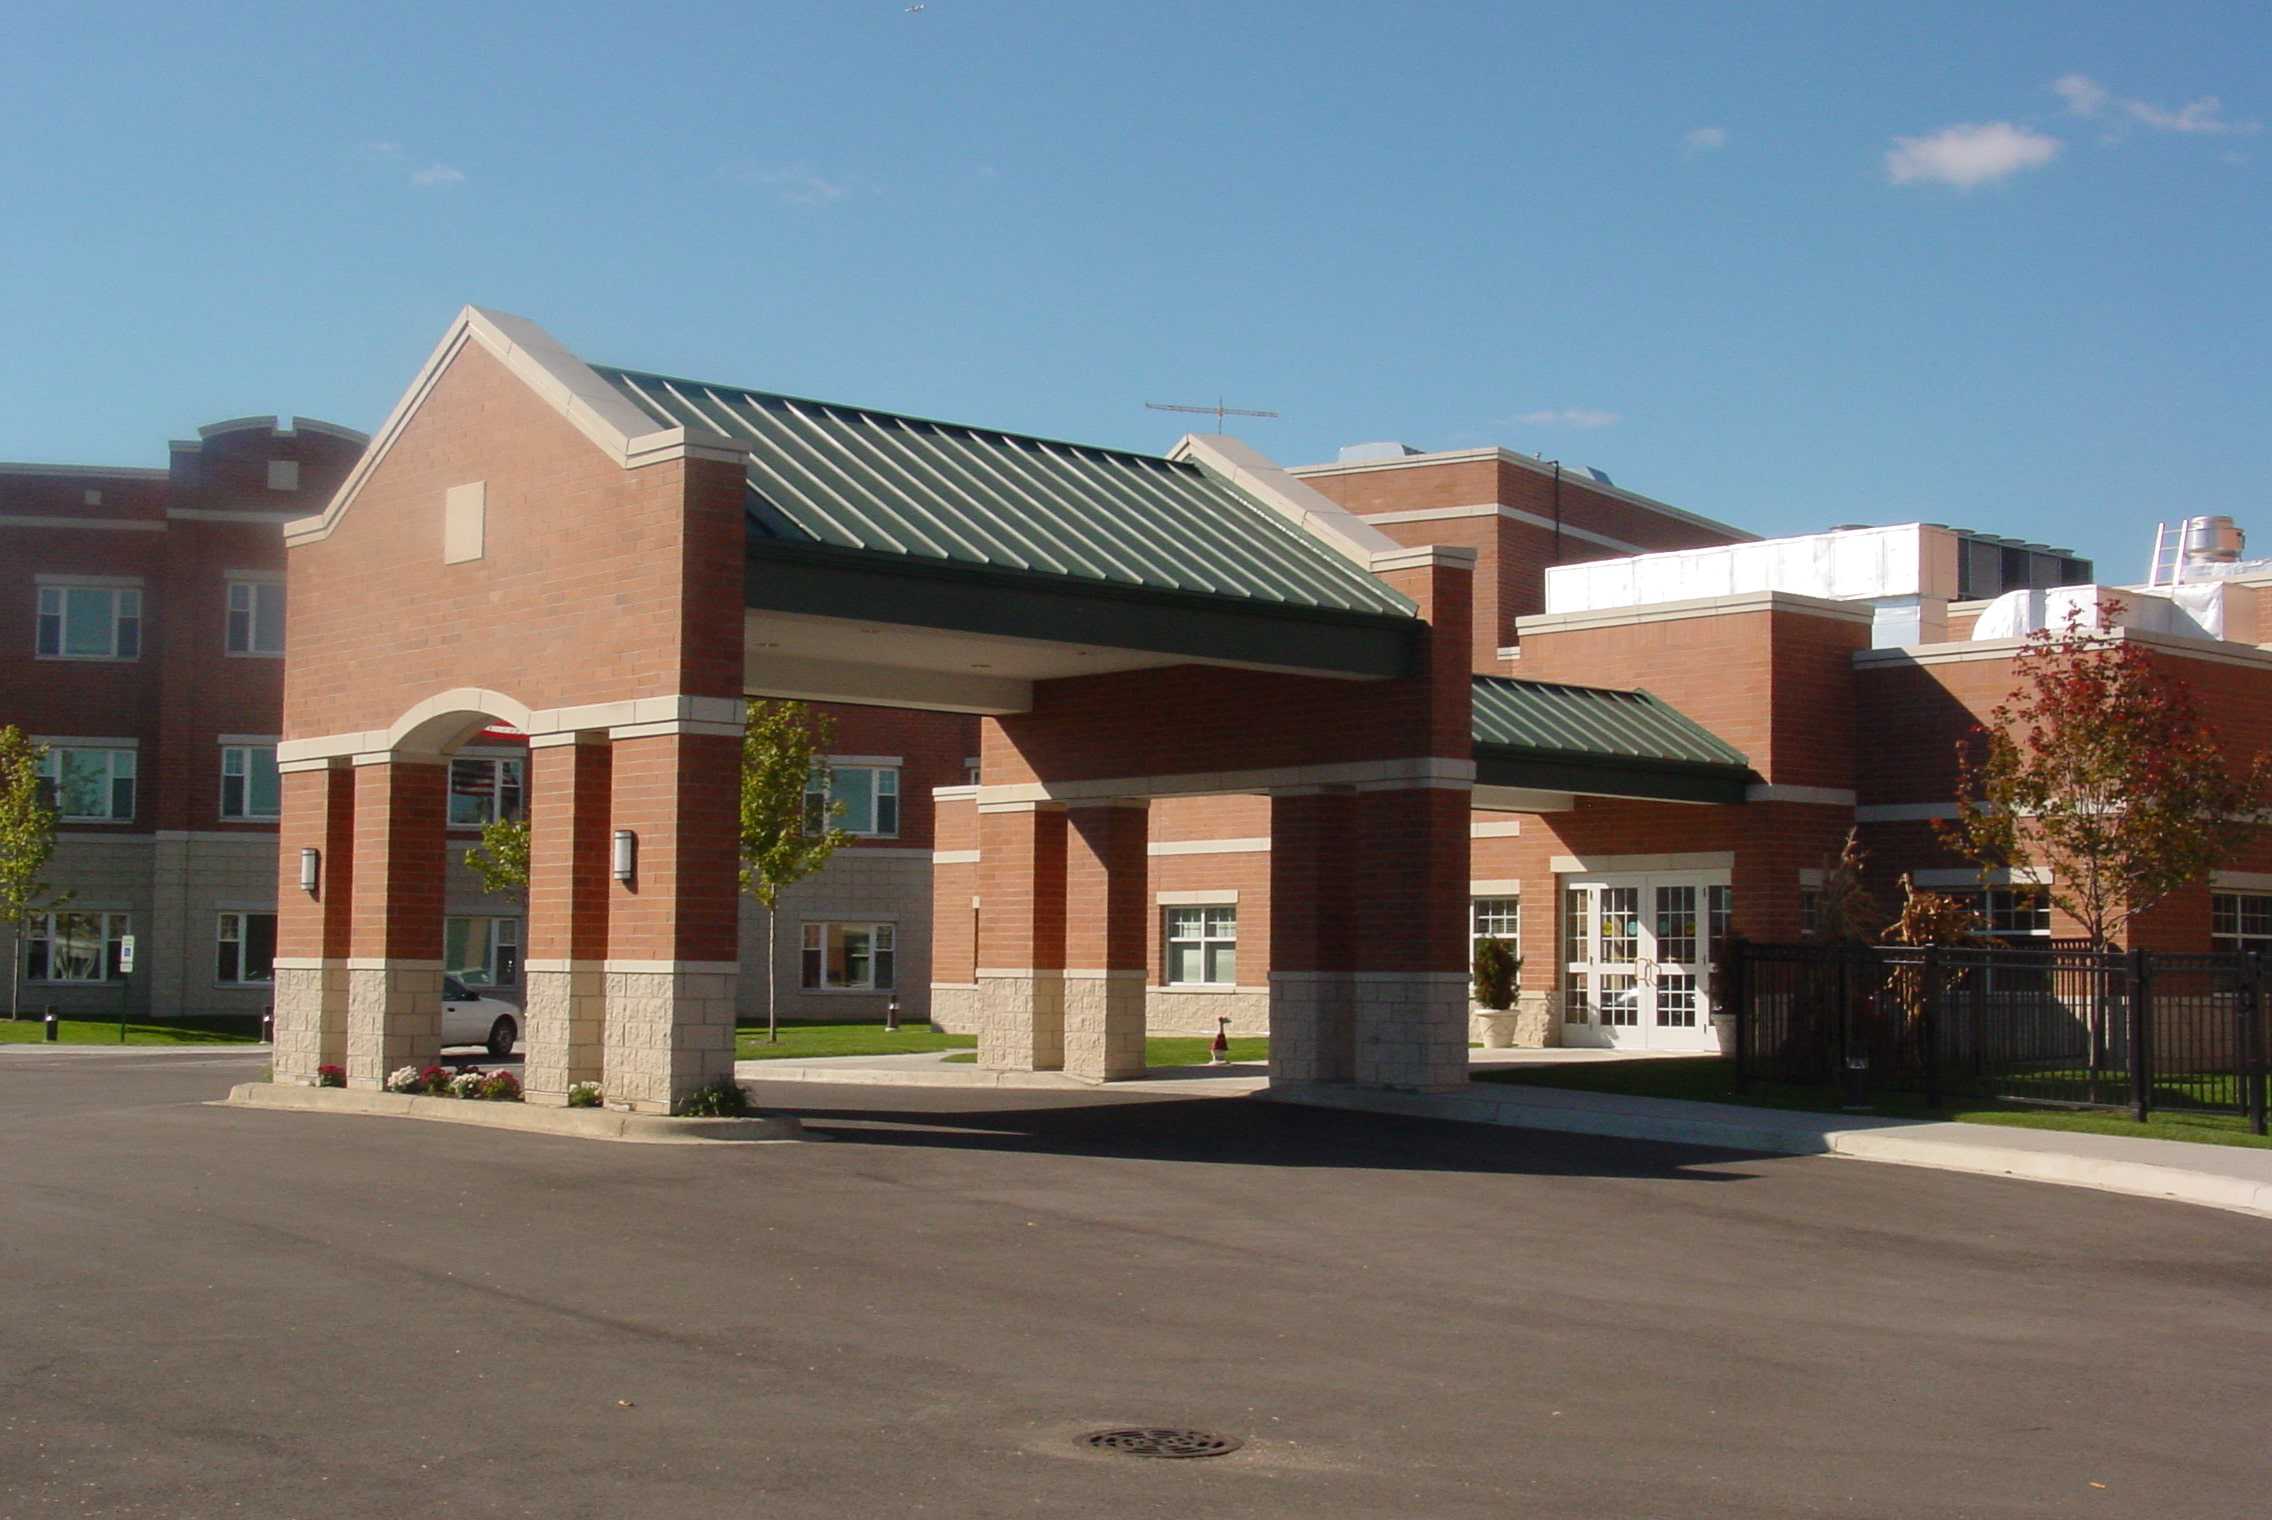
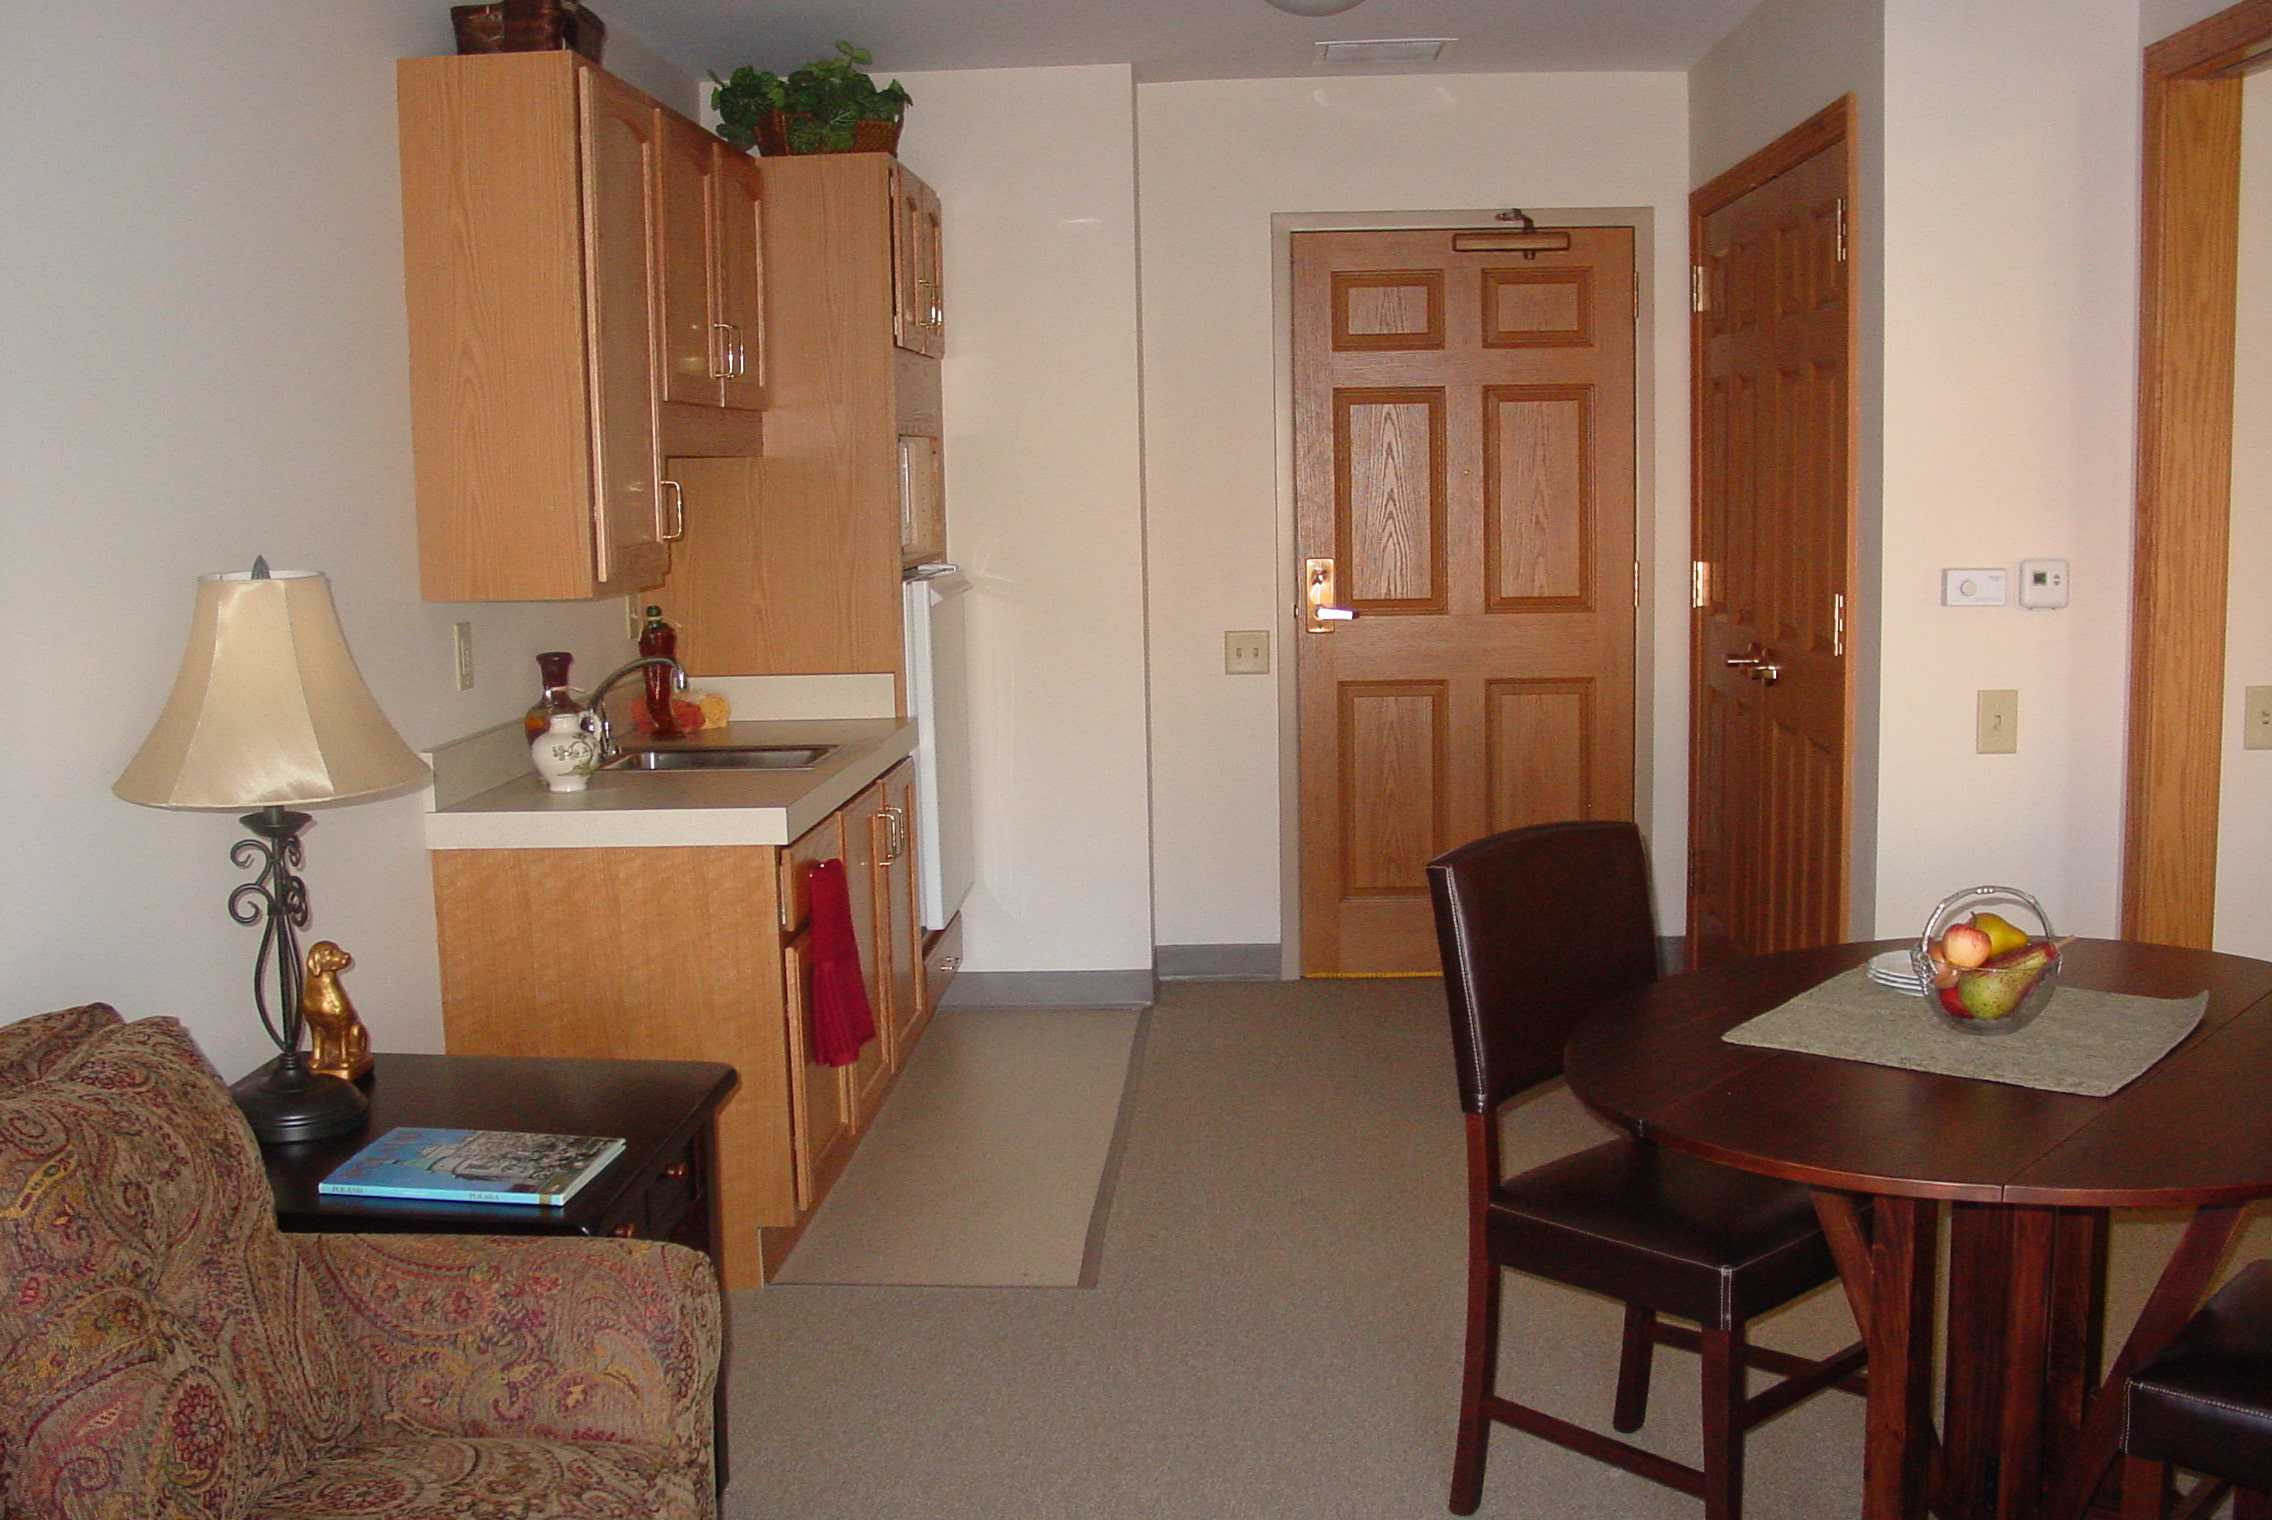
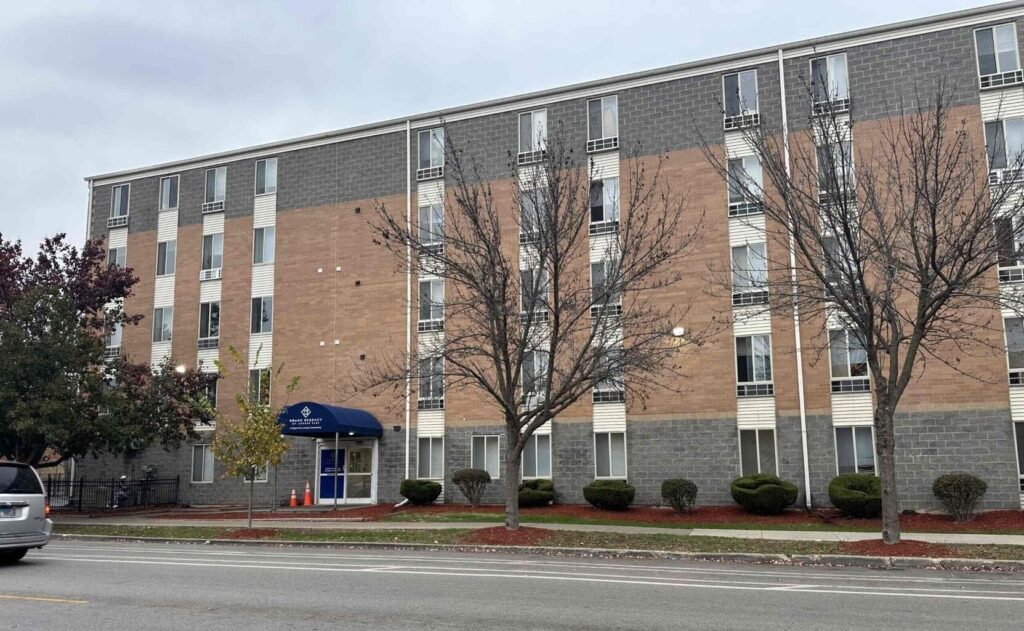
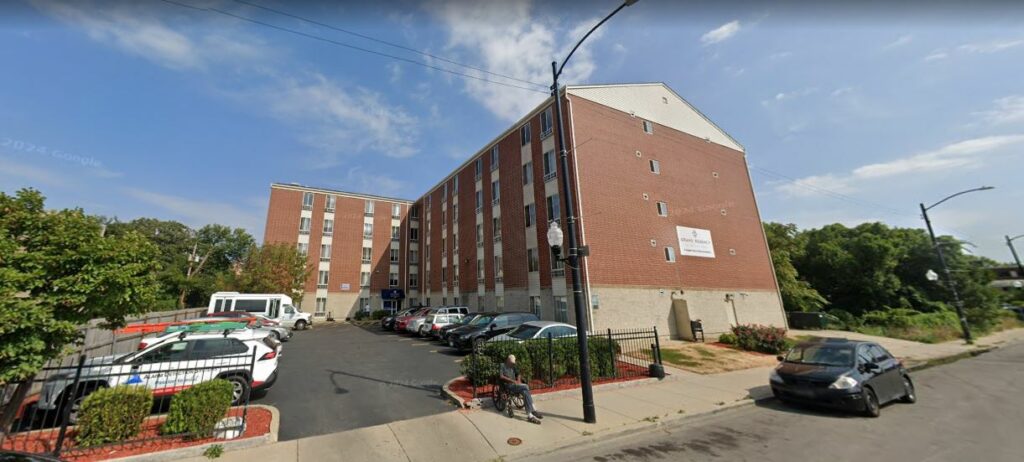
Delivering the highest quality of care, safety and comfort to seniors in Cook Chicago, IL, St. Joseph Village of Chicago is a distinguished senior living community that offers assisted living, skilled nursing, memory care, rehabilitation services and respite care. Rest comfortably in bright and spacious apartments in variations of studios, one-bedroom, and two-bedroom floor plans. Residents live as autonomously as possible with the support of personalized care services, 24-hour security, and an array of stimulating interactions.

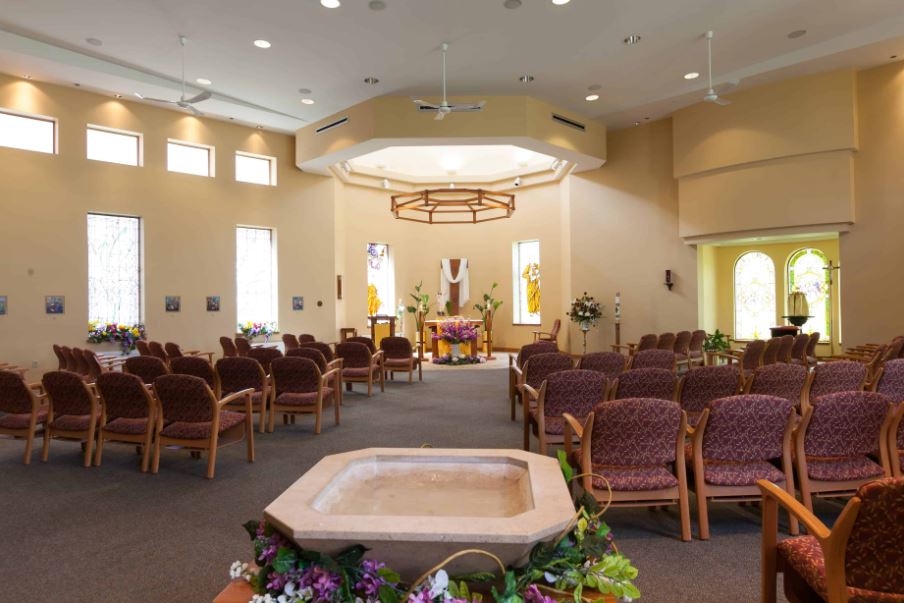
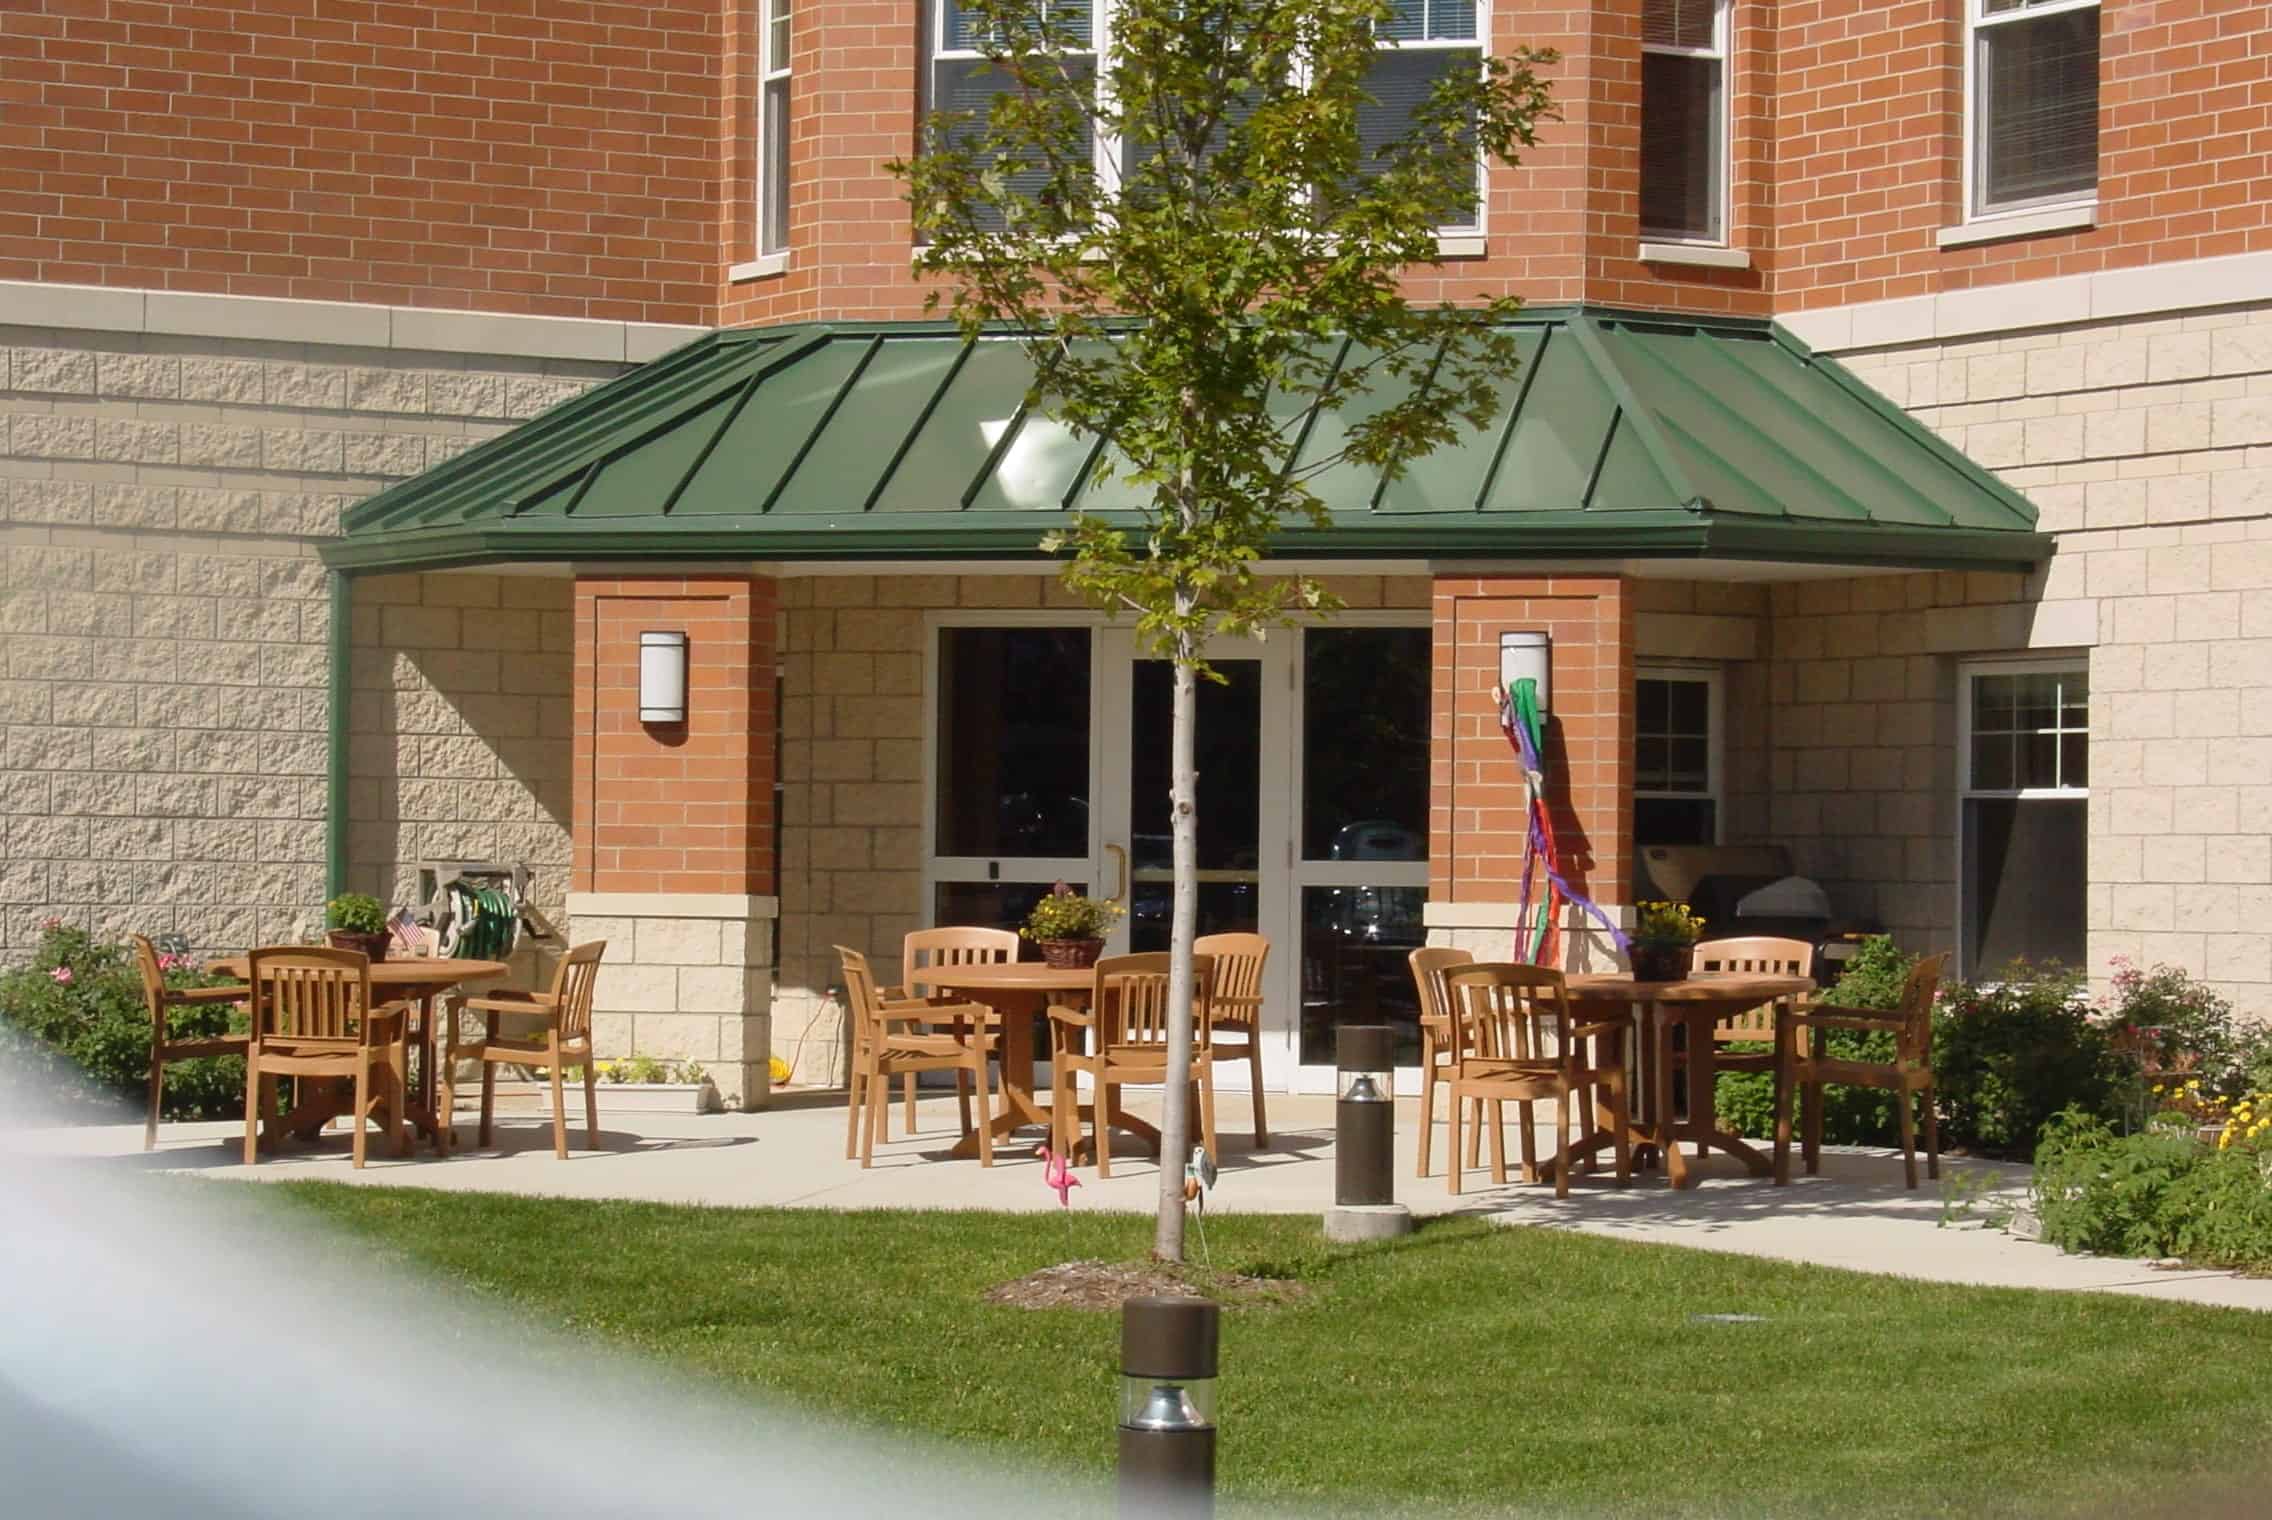
At St. Joseph Village of Chicago, residents truly experience what joyful living is with a wide array of social, recreational and leisure activities inspired by the seven dimensions of wellness. Committed to delivering a dining experience that fosters resident health and well-being, the community provides a team of excellent chefs who use fresh local ingredients to create delicious, resident-inspired meals. Here, residents’ goals, dreams and desires are thoughtfully taken into consideration for every aspect of their care plan, ensuring that all of their needs are met accordingly.

(773) 295-4119

Quality ratings

Measured by Centers for Medicare & Medicaid Services (CMS)

Overall rating Info The Overall CMS Rating combines results from health inspections, staffing levels and quality measures. Health inspections carry the most weight. Staffing and quality scores can increase or decrease the final rating based on performance compared to state and national standards.
4/5
Illinois average: 3.2/5
Health Inspection Info Based on the results of the facility's three most recent standard inspections and any complaint investigations. CMS reviews the number, scope, and severity of deficiencies, with more recent findings weighted more heavily.
4/5
Illinois average: 3.0/5
Staffing Info Measures average nursing staff hours per resident per day, including Registered Nurses (RNs) and total nursing staff. Ratings are adjusted based on the level of care residents require and are compared to state and national benchmarks.
4/5
Illinois average: 3.3/5
Quality Measures Info Based on clinical and physical health indicators reported to CMS, such as hospital readmissions, falls, pressure ulcers, and improvements in mobility. These measures reflect how well residents' health needs are being managed.
4/5
Illinois average: 3.2/5

Nursing care per resident

Info This shows how many total hours of nursing staff time are available per resident each day. Higher numbers usually mean more staff support.
4h 39m per day

This home provides 18% more nursing time per resident than the Illinois average.

Illinois average: 3h 57m per day

Capacity and availability

Smaller home

May offer a more intimate, personalized care environment.

Total beds 45

This home usually has availability

Lower occupancy suggests more openings may be available.

Lower demand than the Illinois average
Occupancy rate 68.9%
Residents per day 31
Occupancy rate
68.9%
Residents per day
31

Who this home usually serves

TYPE OF STAY

Mostly short-term rehab stays

Most residents typically stay for a few weeks or months before returning home or moving on.

Might be optimal for
Short stays Recovery Medicare-covered care

Breakdown by payment type

Medicare

54% of new residents, usually for short-term rehab.

Typical stay 1 - 2 months

Private pay

45% of new residents, often for short stays.

Typical stay 1 - 2 months

Medicaid

2% of new residents, often for long-term daily care.

Typical stay 1 - 2 years

Finances and operations

Voluntary non-profit community
Operated by a church.
Home revenue
$22.8M
Operating deficit
-$742.6K
Voluntary non-profit community Operated by a church.
Home revenue
$22,806,858.00
Operating deficit
$-742,620.00
Payroll costs Info The portion of the home's budget spent on staff, including nurses, caregivers, and other employees who support care and operations.
$4.7M
20.5% of revenue
Other operating costs Info All remaining costs needed to run the home, such as food, utilities, building maintenance, supplies and administrative expenses.
$18.9M
Total costs $23.5M
Bed community size
45-bed community
A moderately sized community that may balance personal attention with shared amenities and social activities.
Years in operation
21 years in operation
A longer operating history, which may indicate experience navigating regulations and delivering ongoing care.
Walk Score
Walk Score: 91 / 100
Walker's paradise. Daily errands do not require a car, with many shops and services nearby.

About this community

Occupancy

Occupancy rate
69%
In line with Illinois average
Occupied beds
31 / 45
Average residents 93 per day

License details

Facility type
Assisted Living/shared Housing Establishment
Status Active
Issuance April 27, 2025
Expiration April 27, 2026
County: Cook

Additional licensing details

CMS Certification Number: 145637

Ownership & operating entity

St. Joseph Village of Chicago is legally operated by FRANCISCAN COMMUNITIES, INC..

Type Of Units

Permanent Units
20 units
Alzheimer's Units
25 units
Total beds
45 units

Staffing

Key information about the people who lead and staff this community.

Leadership

Contact: Mr. Gary Mellman, Executive Director

Care Services

Offers Alzheimer's Care
Nursing Services
Rehabilitation Services
Respite Care
Memory Care
Skilled Nursing
Licensed Nurses/CNAs
24-Hour Staffing
Short-Term Rehab

All Levels of Care

Assisted Living
Skilled Nursing
Memory Care
Rehabilitation
Respite Care

Contact Information

Amenities & Lifestyle

Dining options
salon services
wellness activities
library
24-hour campus security

Programs & Activities

Activities
Life enrichment activities focus on social, physical, intellectual, and spiritual wellness.
Specific Programs
Chicago Assisted Living, Skilled Nursing, Memory Care, Rehabilitation, Respite Care, Wellbeing, Dining, Engagement, Spiritual, Events, Gallery

Dining & Nutrition

Food Description
Dining options promote resident health and well-being with fresh local ingredients and an elegant dining experience.

What does this home offer?

Housing options icon

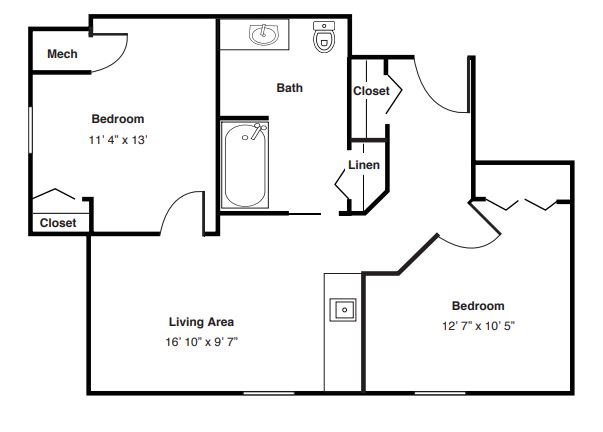
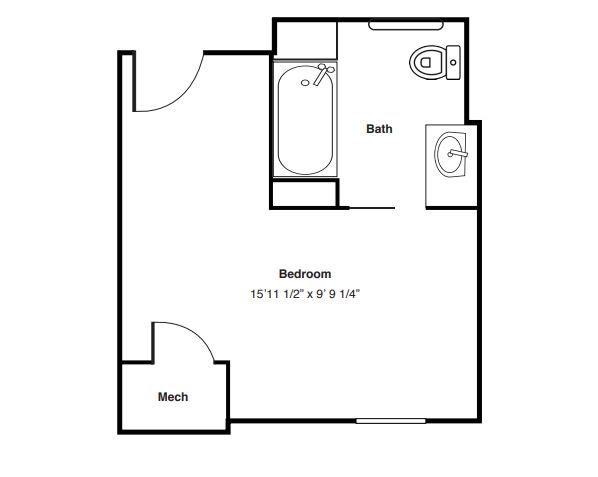
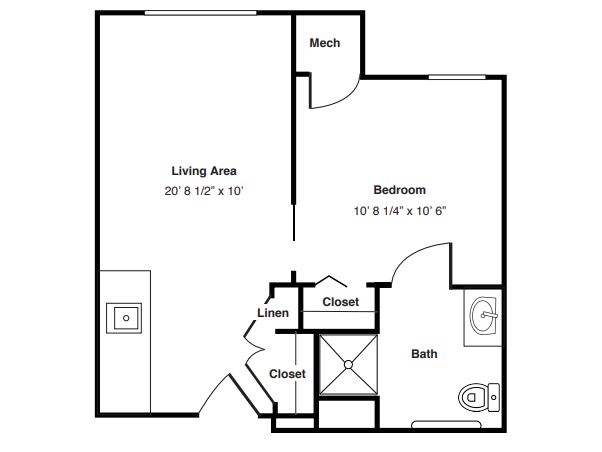
Housing Options: Studio / 1 Bed / 2 Bed

Building type icon
Building type icon

Building Type: 3-story

Transportation services icon

Transportation Services

Fitness and recreation icon

Fitness and Recreation

Types of Care at St. Joseph Village of Chicago

Assisted Living Memory Care Respite Care Skilled Nursing
Contact St. Joseph Village of Chicago

Inspection History

In Illinois, the Department of Public Health, Office of Health Care Regulation conducts annual unannounced surveys to assess compliance with state and federal healthcare facility standards.

6 visits/inspections

2 visits/inspections triggered by complaints

1 other visits

Breakdown by inspection type
  • 3 licensing inspections
  • 2 complaint investigations
  • 1 other inspection

Latest inspection

Date:October 10, 2025

Inspection history

06/07/2023 Annual Licensure Only Survey
Inspection
05/07/2024
Inspection
08/01/2024 Annual Licensure Only Survey
Inspection
05/06/2025 Complaint Original Investigation
Inspection
07/07/2025 Annual Licensure Only Survey
Inspection
10/10/2025 Complaint Original Investigation
Inspection

3 deficiencies

Deficiencies indicate regulatory issues. A higher number implies the facility had several areas requiring improvement.

Inspection Report Summary for St. Joseph Village of Chicago

The most recent inspection on August 1, 2024, identified deficiencies related to the facility’s resident satisfaction survey, quality improvement program, employee orientation, and memory care training. Earlier inspections were not provided for comparison, so it is unclear whether these issues are recurring or new. The main themes of deficiencies involved documentation and staff training requirements, particularly in memory care and employee orientation. No complaint investigations or enforcement actions were listed in the available reports. Without additional data, no clear trend in compliance can be determined.

Health Inspection History

Inspections
Total health inspections 5

Illinois average 10.4


Last Health inspection on Jul 2025

Total health citations 19

Illinois average 36.8

Citations per inspection
3.8

Illinois average 3.68


Health citations are formal notices following inspections when they fail to comply with safety and care standards.

14 of 19 citations resulted from standard inspections; and 5 of 19 resulted from complaint investigations.

Breakdown of citation severity (last 3 years)
Critical Health citations More info 0
100% better than Illinois average

Illinois average: 0.7


Serious Health citations More info 2
44% better than Illinois average

Illinois average: 3.6

0 critical citations More info Illinois average: 0.7

2 serious citations More info Illinois average: 3.6

16 moderate citations More info Illinois average: 32

1 minor citation More info Illinois average: 0.5
Citations history (last 3 years)
Quality of Care moderate citation Info Issues related to how well residents receive appropriate treatment and support for their medical and daily care needs. Jul 09, 2025
Corrected

Quality of Care moderate citation Info Issues related to how well residents receive appropriate treatment and support for their medical and daily care needs. Aug 29, 2024
Corrected

Quality of Care moderate citation Info Issues related to how well residents receive appropriate treatment and support for their medical and daily care needs. Aug 29, 2024
Corrected

Nutrition moderate citation Info Issues related to food quality, meal service, and resident's nutritional needs. Jun 14, 2024
Corrected

Compare Assisted Living around Cook County The information below is reported by the Illinois Department of Public Health, Office of Health Care Regulation.

St. Joseph Village of Chicago
NH

Nursing Home Licensed facility providing 24/7 skilled nursing care for residents with complex, ongoing medical needs. Staffed by RNs, LPNs, and CNAs. Inspected and star-rated annually by CMS. Accepts Medicare (short-term rehab) and Medicaid (long-term care).

AL

Assisted Living A licensed, long-term care setting for seniors or individuals with disabilities who need help with daily activities — like bathing, dressing, and medication management — but not 24-hour skilled nursing. Offers housing, meals, and around-the-clock support while aiming to maximize resident independence.

MC

Memory Care Secured, specialized care for people living with Alzheimer's or dementia. Staff trained in cognitive impairment, with higher staff-to-resident ratios and an environment designed to reduce confusion and wandering risk.

RC

Respite Care Short-term temporary care — days to weeks — to give family caregivers a break. Full care provided during the stay. Often used after hospitalization or to trial a facility before a permanent placement decision.

Chicago (Belmont Gardens)
54
68.9%
-
91
21
FRANCISCAN COMMUNITIES, INC.
6
2
0
Studio / 1 Bed / 2 Bed
Concord Place Retirement Community
AL

Assisted Living A licensed, long-term care setting for seniors or individuals with disabilities who need help with daily activities — like bathing, dressing, and medication management — but not 24-hour skilled nursing. Offers housing, meals, and around-the-clock support while aiming to maximize resident independence.

IL

Independent Living Lifestyle-focused communities for older adults offering dining, activities, and transportation with minimal personal care. Best for active, independent seniors who want community without medical support.

Northlake
-
-
A+
36
-
-
-
-
-
Studio / 1 Bed / 2 Bed
Grand Regency of Jackson Park Supportive Living
AL

Assisted Living A licensed, long-term care setting for seniors or individuals with disabilities who need help with daily activities — like bathing, dressing, and medication management — but not 24-hour skilled nursing. Offers housing, meals, and around-the-clock support while aiming to maximize resident independence.

IL

Independent Living Lifestyle-focused communities for older adults offering dining, activities, and transportation with minimal personal care. Best for active, independent seniors who want community without medical support.

MC

Memory Care Secured, specialized care for people living with Alzheimer's or dementia. Staff trained in cognitive impairment, with higher staff-to-resident ratios and an environment designed to reduce confusion and wandering risk.

Chicago (Grand Crossing)
-
-
-
83
-
-
-
-
-
Studio
Grand Regency of South Shore
AL

Assisted Living A licensed, long-term care setting for seniors or individuals with disabilities who need help with daily activities — like bathing, dressing, and medication management — but not 24-hour skilled nursing. Offers housing, meals, and around-the-clock support while aiming to maximize resident independence.

Chicago (South Shore)
-
-
A+
79
10
-
-
-
-
Studio / 1 Bed / 2 Bed
Midway Pointe Senior Living
AL

Assisted Living A licensed, long-term care setting for seniors or individuals with disabilities who need help with daily activities — like bathing, dressing, and medication management — but not 24-hour skilled nursing. Offers housing, meals, and around-the-clock support while aiming to maximize resident independence.

Chicago (Garfield Ridge)
-
-
A+
67
11
-
-
-
-
Studio / 1 Bed / 2 Bed

Living Spaces & Floor Plans

St Joseph Village Of Chicago P2
St Joseph Village Of Chicago P3
St Joseph Village Of Chicago P1

Places of interest near St. Joseph Village of Chicago

Address 21.0 miles from city center

Address 4021 W Belmont Ave, Chicago, IL 60641

Calculate Travel Distance to St. Joseph Village of Chicago

Add your location

Address

Staffing Data (Q2 2025)

This data corresponds to Q2 2025 and is based on CMS Payroll-Based Journal.

Total staff 93
Employees 71
Contractors 22
Staff to resident ratio 2.11:1
11% better than Illinois average

Illinois average ratio: 1.90:1

Avg staff/day 36
Average shift 7.6 hours
0% compared with Illinois average

Illinois average: 7.6 hours

Total staff hours (quarter) 24,814
Nursing staff breakdown
Registered Nurse

Manages medical care and health needs.

Total count 18
Average shift length Info Average shift length. Calculated as total hours divided by days worked and average staff per day. 8.2 hours

This role is partially covered by contractors.

Licensed Practical Nurse

Assists with medical care and medications.

Total count 7
Average shift length Info Average shift length. Calculated as total hours divided by days worked and average staff per day. 8.6 hours

This role is partially covered by contractors.

Certified Nursing Assistant

Helps with daily care and mobility.

Total count 43
Average shift length Info Average shift length. Calculated as total hours divided by days worked and average staff per day. 7.6 hours

This role is partially covered by contractors.

Contractor staffing

Total hours from contractors

6.9%

1,713 contractor hours this quarter

Speech Language Pathologist: 4 Certified Nursing Assistant: 4 Physical Therapy Assistant: 3 Licensed Practical Nurse: 2 Occupational Therapy Aide: 2 Respiratory Therapy Technician: 2 Registered Nurse: 1 Medical Director: 1 Physical Therapy Aide: 1 Occupational Therapy Assistant: 1 Qualified Social Worker: 1
Staff by category
Certified Nursing Assistant3944313,01791100%7.6
Registered Nurse171185,85191100%8.2
Licensed Practical Nurse5271,7148998%8.6
Clinical Nurse Specialist2027497178%7.9
Other Dietary Services Staff3035366066%7.3
Occupational Therapy Aide0225145965%7.3
Administrator1014485662%8
Mental Health Service Worker1014405560%8
Nurse Practitioner1013203943%8.2
Speech Language Pathologist0443092730%6.6
Physical Therapy Assistant0332632426%6.3
Dietitian2022403033%8
Physical Therapy Aide0111672224%7.6
Respiratory Therapy Technician022891415%6.4
Medical Director011783943%2
Qualified Social Worker011681213%5.7
Occupational Therapy Assistant011111516%0.7
43 Certified Nursing Assistant
% of Days 100%
18 Registered Nurse
% of Days 100%
7 Licensed Practical Nurse
% of Days 98%
2 Clinical Nurse Specialist
% of Days 78%
3 Other Dietary Services Staff
% of Days 66%
2 Occupational Therapy Aide
% of Days 65%
1 Administrator
% of Days 62%
1 Mental Health Service Worker
% of Days 60%
1 Nurse Practitioner
% of Days 43%
4 Speech Language Pathologist
% of Days 30%
3 Physical Therapy Assistant
% of Days 26%
2 Dietitian
% of Days 33%
1 Physical Therapy Aide
% of Days 24%
2 Respiratory Therapy Technician
% of Days 15%
1 Medical Director
% of Days 43%
1 Qualified Social Worker
% of Days 13%
1 Occupational Therapy Assistant
% of Days 16%

Facility Characteristics

Source: CMS Long-Term Care Facility Characteristics (Data as of Jan 2026)

Total census
44 residents
Residents by payment source
Medicare
7 residents (15.9%)
Medicaid
9 residents (20.5%)
Private pay or other
28 residents (63.6%)
Programs & Services
Residents' Group

Residents meet regularly to discuss policies, care quality, and activities

CCRC

Part of a Continuing Care Retirement Community offering multiple care levels

Active Resident Council

Organized group of residents that meets regularly to discuss facility policies, quality of life, and activities.

Quality of care over time

These measures show how residents usually do over time at this home, based on health outcomes and preventive care.

High-risk clinical events score Info A composite score based on pressure ulcers, falls with injury, weight loss, walking ability decline, and activities of daily living decline. 8.1
16% better than Illinois average

Illinois average: 9.7

Functional decline score Info A composite score based on activities of daily living decline, walking ability decline, and incontinence. 18.7
In line with Illinois average

Illinois average: 18.6

Long-stay resident measures
Need for Help with Daily Activities Increased Info Percent of long-stay residents whose need for help with daily activities has increased 8.9%
43% better than Illinois average

Illinois average: 15.5%

Walking Ability Worsened Info Percent of long-stay residents whose ability to move independently worsened 7.6%
59% better than Illinois average

Illinois average: 18.4%

Low Risk Residents with Bowel/Bladder Incontinence Info Percent of low risk long-stay residents who lose control of their bowels or bladder 39.6%
83% worse than Illinois average

Illinois average: 21.6%

Falls with Major Injury Info Percent of long-stay residents experiencing one or more falls with major injury 1.1%
68% better than Illinois average

Illinois average: 3.4%

High Risk Residents with Pressure Ulcers Info Percent of long-stay high risk residents with pressure ulcers 9.8%
86% worse than Illinois average

Illinois average: 5.3%

Urinary Tract Infection Info Percent of long-stay residents with a urinary tract infection 1.1%
37% better than Illinois average

Illinois average: 1.8%

Lost Too Much Weight Info Percent of long-stay residents who lose too much weight 13.3%
103% worse than Illinois average

Illinois average: 6.5%

Depressive Symptoms Info Percent of long-stay residents who have depressive symptoms 1.3%
97% better than Illinois average

Illinois average: 48.1%

Antipsychotic Use Info Percent of long-stay residents who received an antipsychotic medication 20.7%
In line with Illinois average

Illinois average: 20.2%

Pneumococcal Vaccine Info Percent of long-stay residents assessed and appropriately given the pneumococcal vaccine 95.7%
7% better than Illinois average

Illinois average: 89.2%

Influenza Vaccine Info Percent of long-stay residents assessed and appropriately given the seasonal influenza vaccine 95.8%
5% better than Illinois average

Illinois average: 91.6%

Short-stay resident measures
Pneumococcal Vaccine Info Percent of short-stay residents assessed and appropriately given the pneumococcal vaccine 70.2%
In line with Illinois average

Illinois average: 68.3%

Antipsychotic medication increase Info Percent of short-stay residents who newly received an antipsychotic medication 2.0%
13% better than Illinois average

Illinois average: 2.3%

Influenza Vaccine Info Percent of short-stay residents assessed and appropriately given the seasonal influenza vaccine 79.2%
26% better than Illinois average

Illinois average: 63.0%

Guides for Better Senior Living

Care Cost Calculator: See Prices in Your Area

Nursing Home Data Explorer

Don’t Wait Too Long: 7 Red Flag Signs Your Parent Needs Assisted Living Now

The True Cost of Assisted Living in 2025 – And How Families Are Paying For It

Understanding Senior Living Costs: Pricing Models, Discounts & Financial Assistance

Financial Aid for Illinois Seniors

Get financial aid guidance

Community Care Program

Illinois CCP

Age 60+, Illinois resident, at risk of nursing home placement.

~$1,215/month (individual).

$17,500 (individual, excludes home, car).

High demand in urban areas; waitlists possible.

Illinois Respite Program

IL Respite (via NFCSP)

Caregiver of someone 60+ (or with dementia), Illinois resident.

No strict limit; prioritizes low-income.

Not applicable.

Limited slots; urban/rural balance.

Supportive Living Program (SLP)

Illinois Medicaid Supportive Living Program

Age 65+ or 22-64 with disability, Illinois resident, Medicaid-eligible, needs moderate assistance (not nursing home-level).

~$2,829/month (300% FBR, individual); QIT allowed.

$2,000 (individual), $3,000 (couple) (excludes home, car).

~200 SLP sites statewide; room/board not covered.

Persons Who Are Elderly Waiver

Illinois Medicaid Elderly Waiver

Age 65+, Illinois resident, Medicaid-eligible, nursing home-level care need.

~$2,829/month (300% FBR, individual).

$2,000 (individual), $3,000 (couple).

Part of HealthChoice Illinois; consumer-directed options available.

Medicare Savings Program (MSP)

Illinois Medicare Savings Program

Age 65+ or disabled, Illinois resident, Medicare Part A/B.

~$2,510/month (QMB), ~$3,380/month (SLMB), ~$3,598/month (QI)—individual.

$9,430 (individual), $14,130 (couple).

Three tiers; no waitlist.

Senior Community Service Employment Program (SCSEP)

Illinois SCSEP

Age 55+, unemployed, low-income, Illinois resident.

~$1,983/month (125% FPL).

Not specified; income-focused.

Priority for veterans, rural residents.

Optional State Supplementation (OSS)

Illinois Optional State Supplementation

Age 65+ or disabled, Illinois resident, in approved facility, SSI recipient or low-income.

~$1,004/month (including SSI).

$2,000 (individual), $3,000 (couple).

~$50-$500/month based on facility type.

VA Aid and Attendance (A&A) and Housebound Benefits

Illinois VA Aid and Attendance/Housebound

Age 65+ or disabled veteran/spouse, Illinois resident, wartime service, need for ADL help (A&A) or homebound.

Net income < ~$1,984/month (veteran with dependent, A&A); pension offsets income.

~$155,356 (net worth limit).

High veteran demand in urban/rural areas.

Tour Icon
Planning a tour? Check our touring checklist.
Chat Icon
Thinking of living here? We can help you speak to a current resident