Occupancy rate
67%
California average: 73%

We arrange tours, appointments, and even moving support so you don’t have to
Thank you for your interest!
Our team will be in touch shortly to help with next steps.


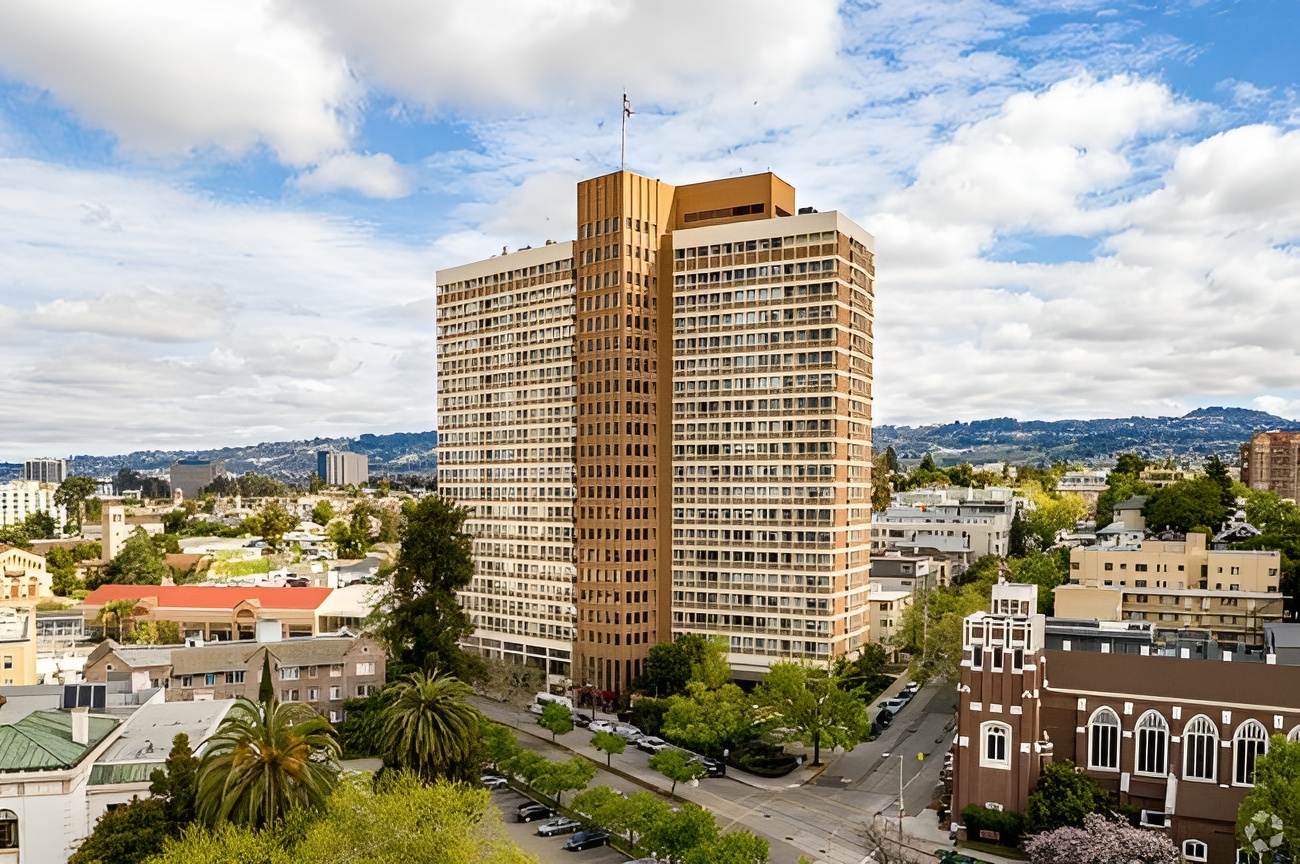
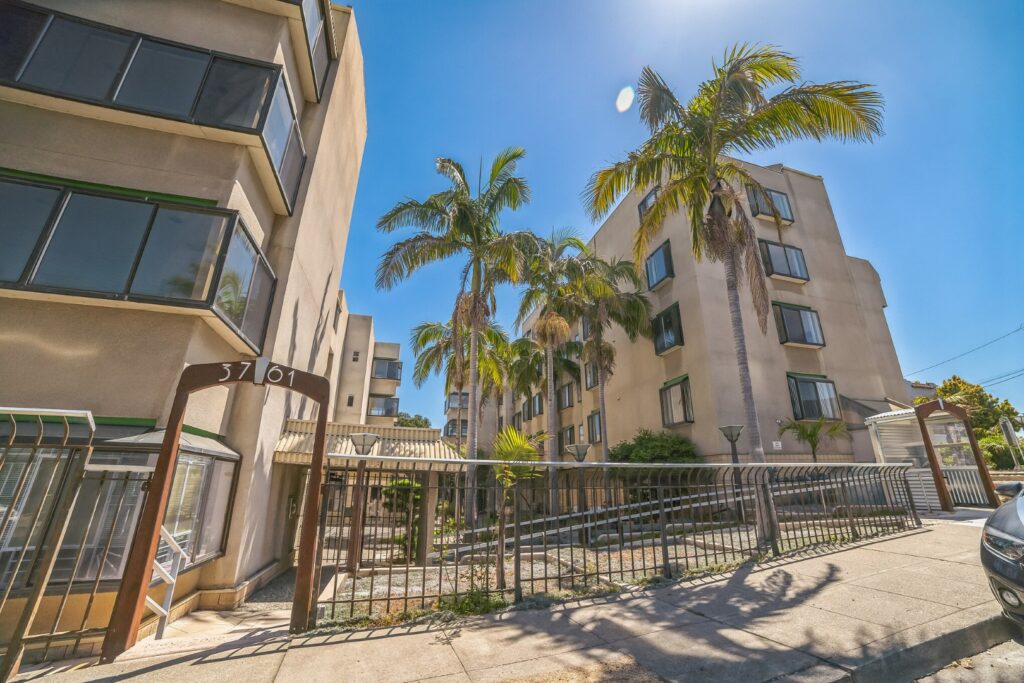
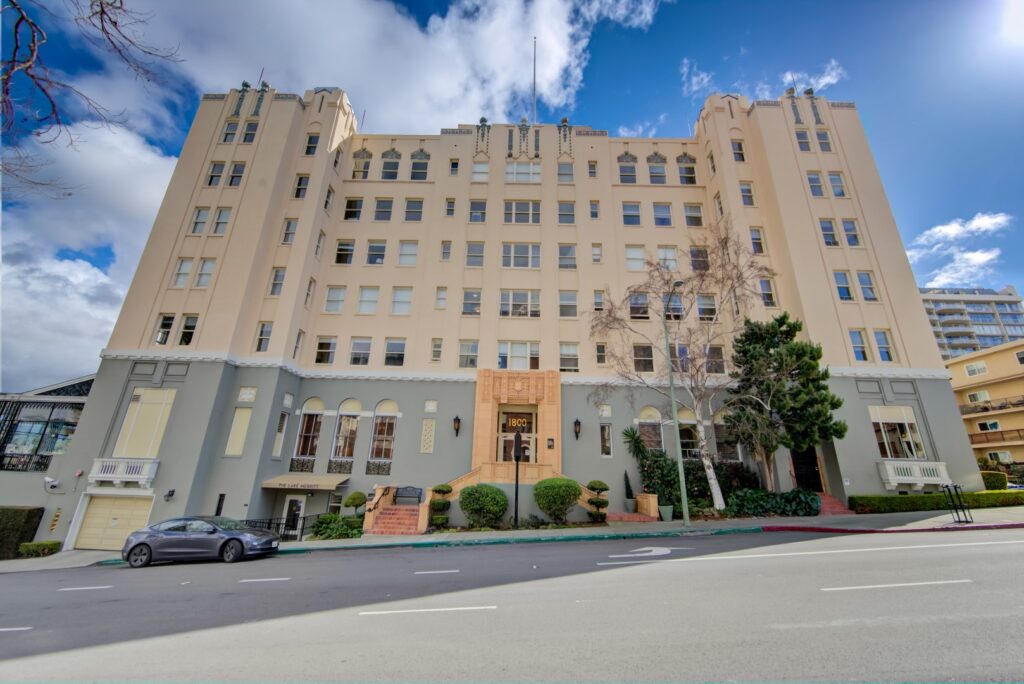
Enjoy a worry-free retirement at St. Paul’s Towers, a dedicated life-plan community in Oaklanc, CA, offering independent living, assisted living, memory care, rehabilitation, and skilled nursing. Featuring beautifully designed and spacious studio to two-bedroom floor plans, the community ensures residents are comfortable and safe. Residents can keep their peace of mind with the community’s weekly housekeeping, linen services, and round-the-clock security.
With a variety of engaging activities and enriching programs, residents are encouraged to live actively and make new friends. Delightful and well-balanced meals are also served in different dining venues to foster comfort and satisfy dietary needs and preferences. The community is equipped with libraries, an art studio, a game room, a hair salon, a community store, and a rooftop garden, creating the ideal setting for residents’ recreation and wellness.
May provide extensive amenities, services and programs.
Lower occupancy suggests more openings may be available.
Most residents typically stay for a few weeks or months before returning home or moving on.
60% of new residents, usually for short-term rehab.
40% of new residents, often for short stays.
California average: 73%
St. Paul’s Towers is legally operated by FRONT PORCH COMMUNITIES AND SERVICES.
Room Sizes: 400 - 450 / 580 - 758 / 936 - 1,800 sq. ft
Housing Options: Studio / 1 Bed / 2 Bed
Building Type: High-rise
Dining Services
Beauty Services
Housekeeping Services
Social and Recreational Activities
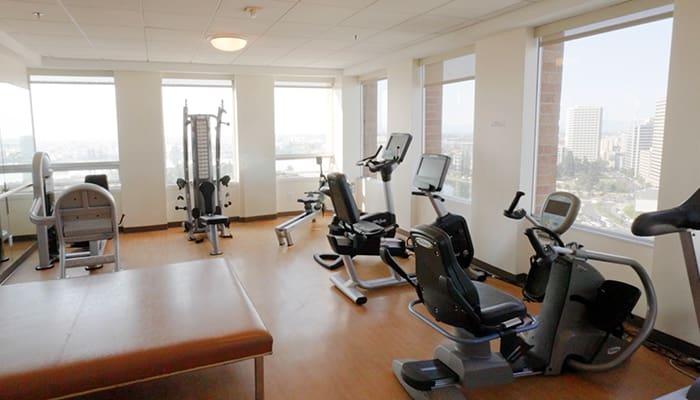
Exercise Programs
In California, the Department of Social Services (for assisted living facilities) and the Department of Public Health (for nursing homes) conduct inspections to ensure resident safety and regulatory compliance.
California average: 16 visits
6 total complaint visits
8 other visits
![]() Other visits include regulatory visits that are not routine inspections or complaint investigations, such as administrative check-ins, follow-up reviews, or licensing-related visits.
Other visits include regulatory visits that are not routine inspections or complaint investigations, such as administrative check-ins, follow-up reviews, or licensing-related visits.
13 total complaint visits
7 other visits
Investigations can have many visits.
California average: 10 complaint investigations
California average: 4 official inspections
Citations indicate regulatory violations. A higher number implies the facility had several areas requiring improvement.
California average: 10 citations
A violation that poses an immediate risk to resident health or safety, or represents a substantial failure to comply with licensing requirements.
California average: 3 serious citations
A violation that does not pose an immediate risk to resident health or safety but requires correction to remain in compliance.
California average: 4 moderate citations
Deficiencies indicate regulatory issues. A higher number implies the facility had several areas requiring improvement.
Most inspections found no deficiencies, with routine and annual visits consistently showing compliance in areas like infection control, safety, and resident care. Several complaint investigations were unsubstantiated, including allegations about resident care, environmental comfort, and refunds. However, two complaint investigations substantiated serious issues related to financial exploitation by staff and failure to notify residents promptly, as well as a failure to obtain fingerprint clearance for a caregiver, which resulted in a $500 civil penalty assessed in October 2024. The most recent report from July 8, 2025, was clean with no deficiencies cited, indicating improvement since the last enforcement action. Other issues noted were isolated and minor, with no further fines or license actions listed in the available reports.
California average 12.5
Last Health inspection on Sep 2024
California average 50.2
California average 4.65
Health citations are formal notices following inspections when they fail to comply with safety and care standards.
All 20 citations resulted from standard inspections.
California average: 0.4
California average: 1
Data sourced from CMS Health Deficiencies reports. Citation severity codes range from A (least serious) to L (most serious). Immediate Jeopardy (J-L) citations indicate situations where the facility's noncompliance has placed residents at risk of death or serious harm.
Nursing Home Licensed facility providing 24/7 skilled nursing care for residents with complex, ongoing medical needs. Staffed by RNs, LPNs, and CNAs. Inspected and star-rated annually by CMS. Accepts Medicare (short-term rehab) and Medicaid (long-term care).
Independent Living Lifestyle-focused communities for older adults offering dining, activities, and transportation with minimal personal care. Best for active, independent seniors who want community without medical support.
Independent Living Lifestyle-focused communities for older adults offering dining, activities, and transportation with minimal personal care. Best for active, independent seniors who want community without medical support.
Independent Living Lifestyle-focused communities for older adults offering dining, activities, and transportation with minimal personal care. Best for active, independent seniors who want community without medical support.
![]() 1.0 miles from city center
1.0 miles from city center
![]() 100 Bay Pl, Oakland, CA 94610
100 Bay Pl, Oakland, CA 94610
Add your location
This data corresponds to Q2 2025 and is based on CMS Payroll-Based Journal.
California average ratio: 0.00:1
California average: 7.7 hours
Manages medical care and health needs.
No contractors work on this role.
Assists with medical care and medications.
No contractors work on this role.
Helps with daily care and mobility.
No contractors work on this role.
Total hours from contractors
1,378 contractor hours this quarter
| Certified Nursing Assistant | 21 | 0 | 21 | 5,817 | 91 | 100% | 7.6 |
| Registered Nurse | 6 | 0 | 6 | 1,825 | 91 | 100% | 8.1 |
| Licensed Practical Nurse | 4 | 0 | 4 | 1,159 | 79 | 87% | 8.1 |
| Clinical Nurse Specialist | 2 | 0 | 2 | 718 | 67 | 74% | 7.3 |
| Physical Therapy Assistant | 0 | 4 | 4 | 648 | 67 | 74% | 5.5 |
| Nurse Practitioner | 1 | 0 | 1 | 504 | 63 | 69% | 8 |
| Administrator | 1 | 0 | 1 | 480 | 60 | 66% | 8 |
| Other Dietary Services Staff | 1 | 0 | 1 | 480 | 61 | 67% | 7.9 |
| Dietitian | 1 | 0 | 1 | 464 | 58 | 64% | 8 |
| RN Director of Nursing | 1 | 0 | 1 | 323 | 41 | 45% | 7.9 |
| Respiratory Therapy Technician | 0 | 4 | 4 | 297 | 62 | 68% | 4.6 |
| Speech Language Pathologist | 0 | 3 | 3 | 148 | 43 | 47% | 3.4 |
| Occupational Therapy Aide | 0 | 2 | 2 | 147 | 16 | 18% | 9.2 |
| Physical Therapy Aide | 0 | 1 | 1 | 64 | 19 | 21% | 3.4 |
| Medical Director | 0 | 1 | 1 | 27 | 26 | 29% | 1 |
| Occupational Therapy Assistant | 0 | 3 | 3 | 27 | 7 | 8% | 3.9 |
| Qualified Social Worker | 0 | 2 | 2 | 19 | 20 | 22% | 1 |
Source: CMS Long-Term Care Facility Characteristics (Data as of Jan 2026)
Residents meet regularly to discuss policies, care quality, and activities
Part of a Continuing Care Retirement Community offering multiple care levels
Organized group of residents that meets regularly to discuss facility policies, quality of life, and activities.
Data sourced from CMS Long-Term Care Facility Characteristics quarterly report. Payer mix reflects the current resident census by primary payment source.
These measures show how residents usually do over time at this home, based on health outcomes and preventive care.
California average: 6.6
California average: 11.3
California average: 11.1%
California average: 12.0%
California average: 11.3%
California average: 1.7%
California average: 5.0%
California average: 1.2%
California average: 4.2%
California average: 6.7%
California average: 10.1%
California average: 98.5%
California average: 94.0%
California average: 1.5%
California average: 93.2%
Quality measures are calculated from Minimum Data Set (MDS) assessments. For most measures, lower percentages indicate better care quality.
Historical financial and operational data for St. Paul’s Towers based on CMS SNF Cost Reports.
Loading trend charts...
Care Cost Calculator: See Prices in Your Area
Nursing Home Data Explorer
Don’t Wait Too Long: 7 Red Flag Signs Your Parent Needs Assisted Living Now
The True Cost of Assisted Living in 2025 – And How Families Are Paying For It
Understanding Senior Living Costs: Pricing Models, Discounts & Financial Assistance

Touring a community? Use this expert-backed checklist to stay organized, ask the right questions, and find the perfect fit.
We'll send you a PDF version of the touring checklist.