

Facility type
Alf

We arrange tours, appointments, and even moving support so you don’t have to
Thank you for your interest!
Our team will be in touch shortly to help with next steps.
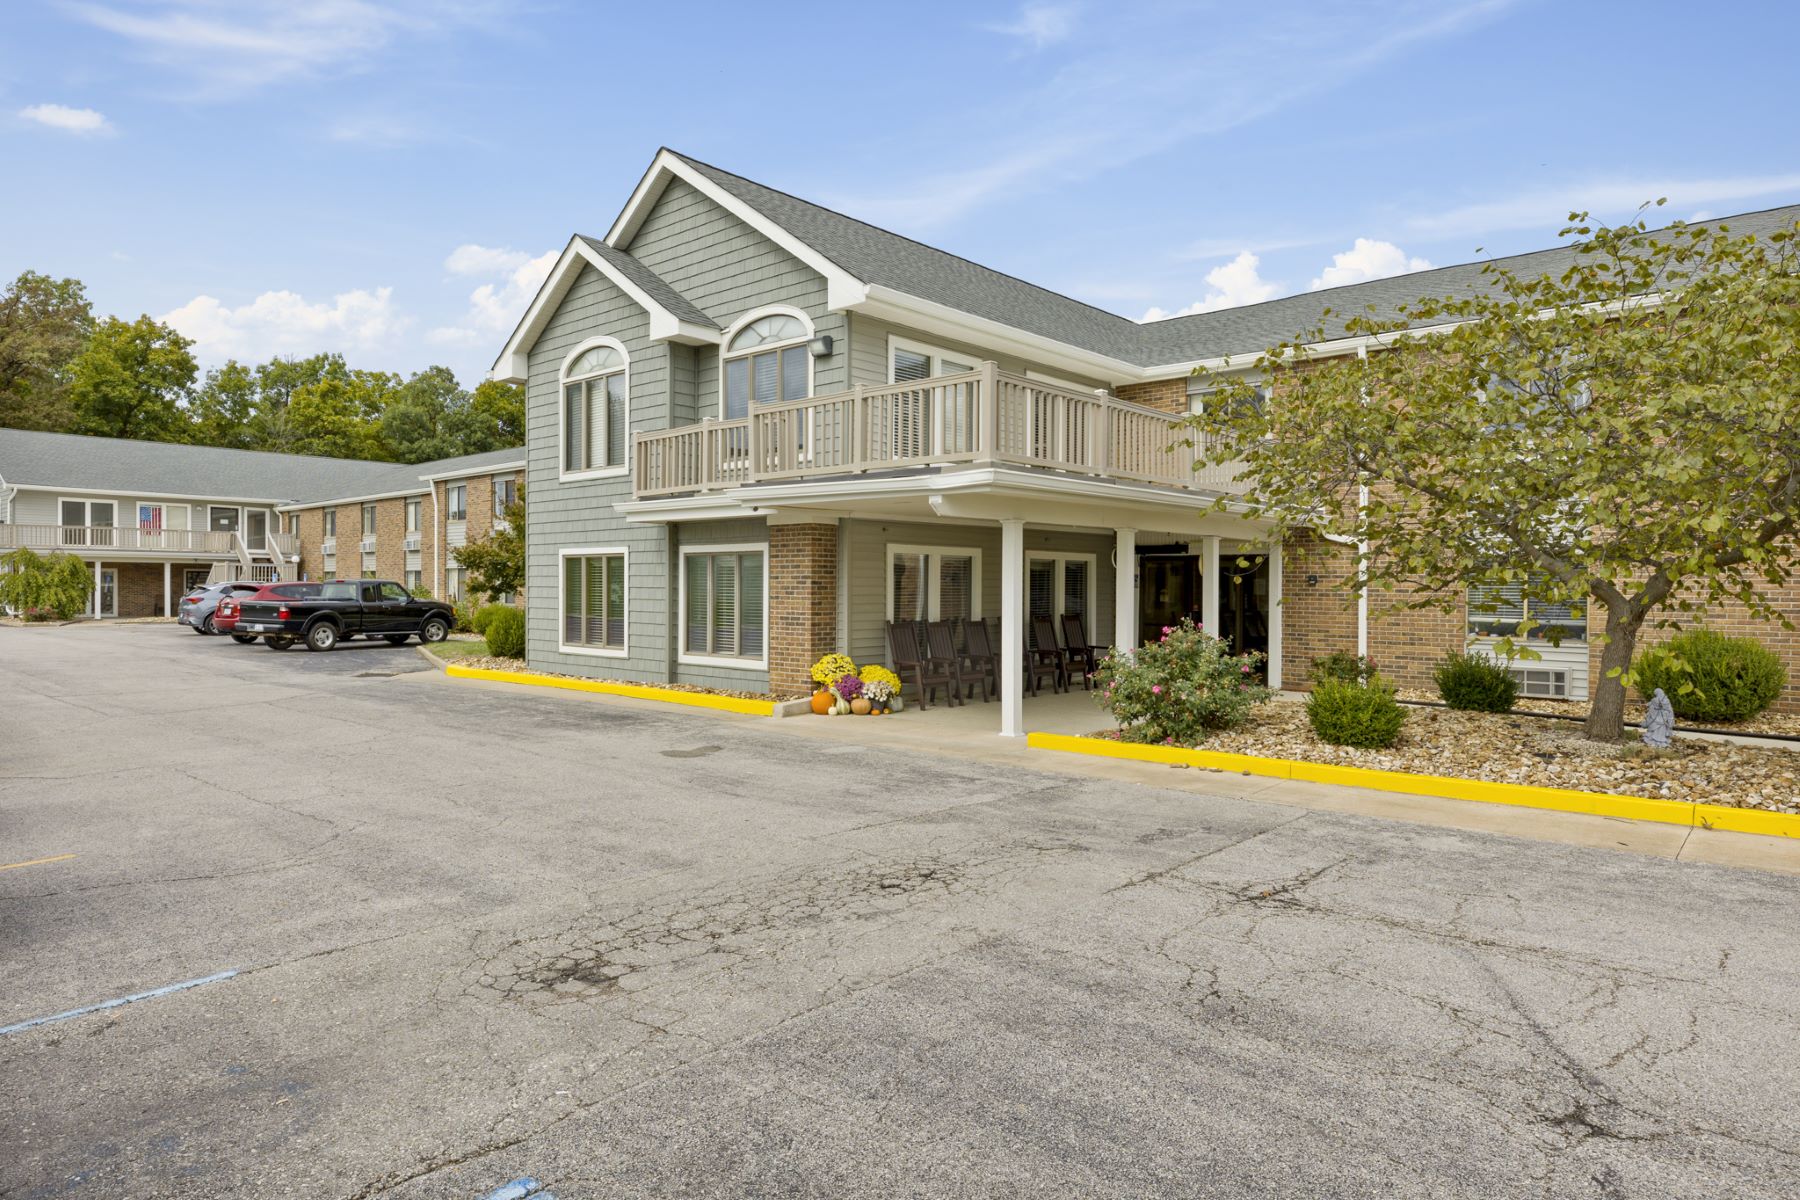
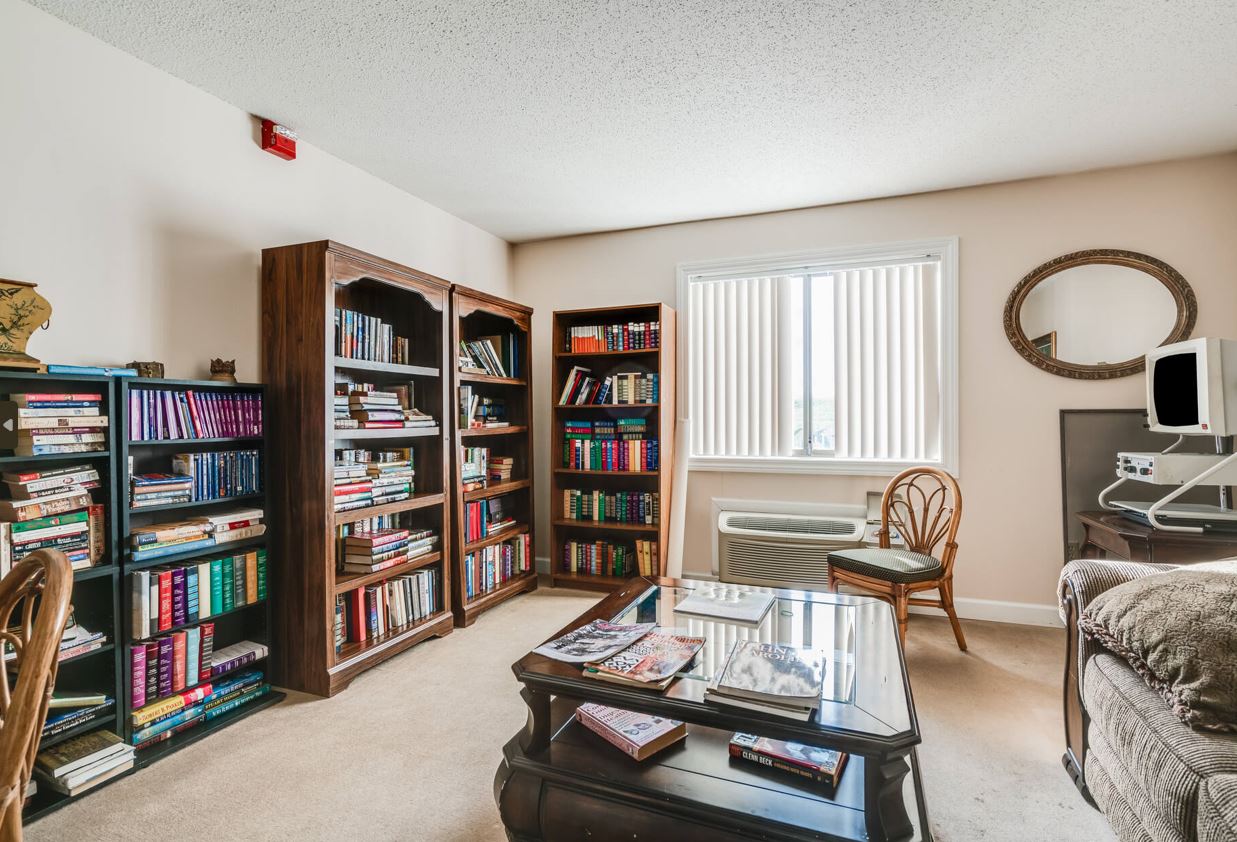
Situated within the serene beauty of Jefferson City, Stonebridge Senior Living Oak Tree (Formerly Oak Tree – ALF) graces seven acres of picturesque land, offering a tranquil and welcoming community. Embracing an all-inclusive approach, this haven ensures worry-free living for residents through a dedicated and compassionate team. With personalized attention that comes from well-trained professionals, seniors are provided with exceptional care that caters to their unique needs.
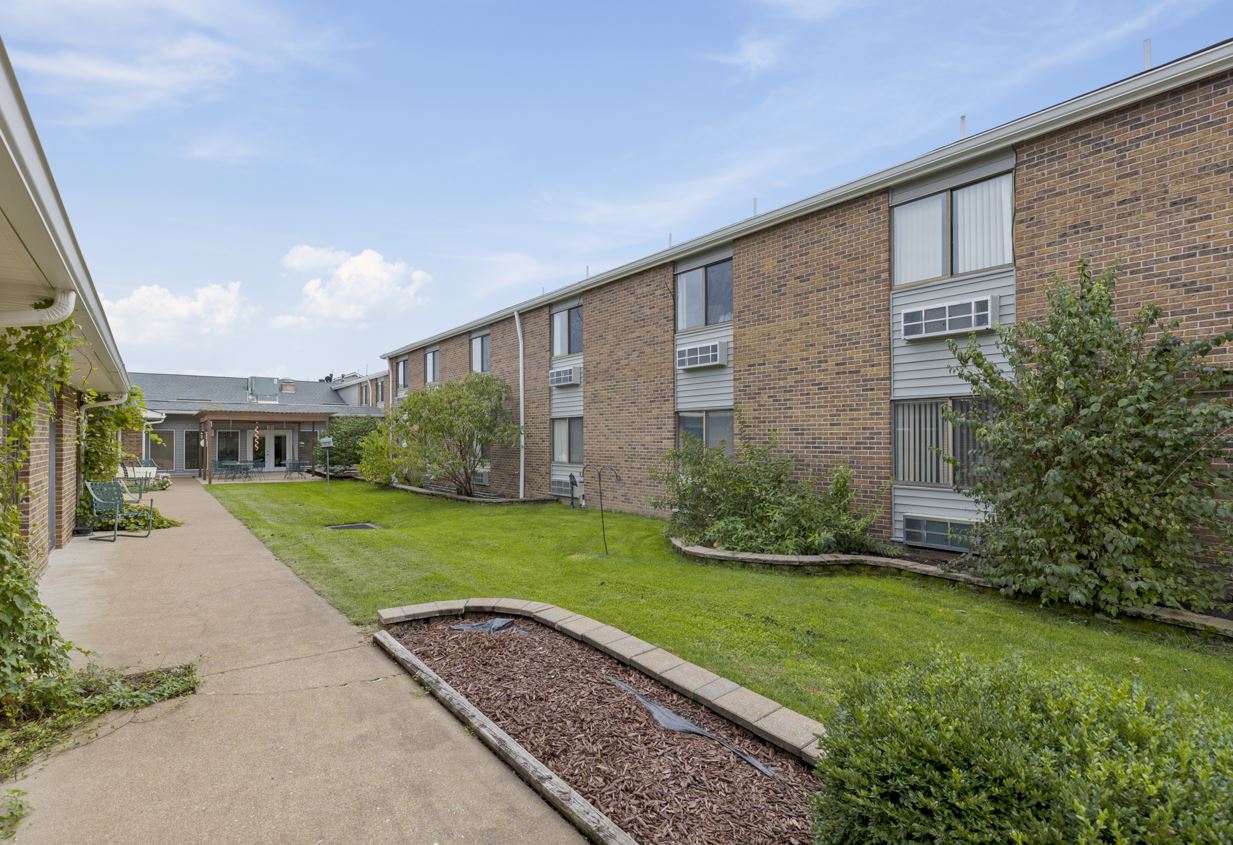
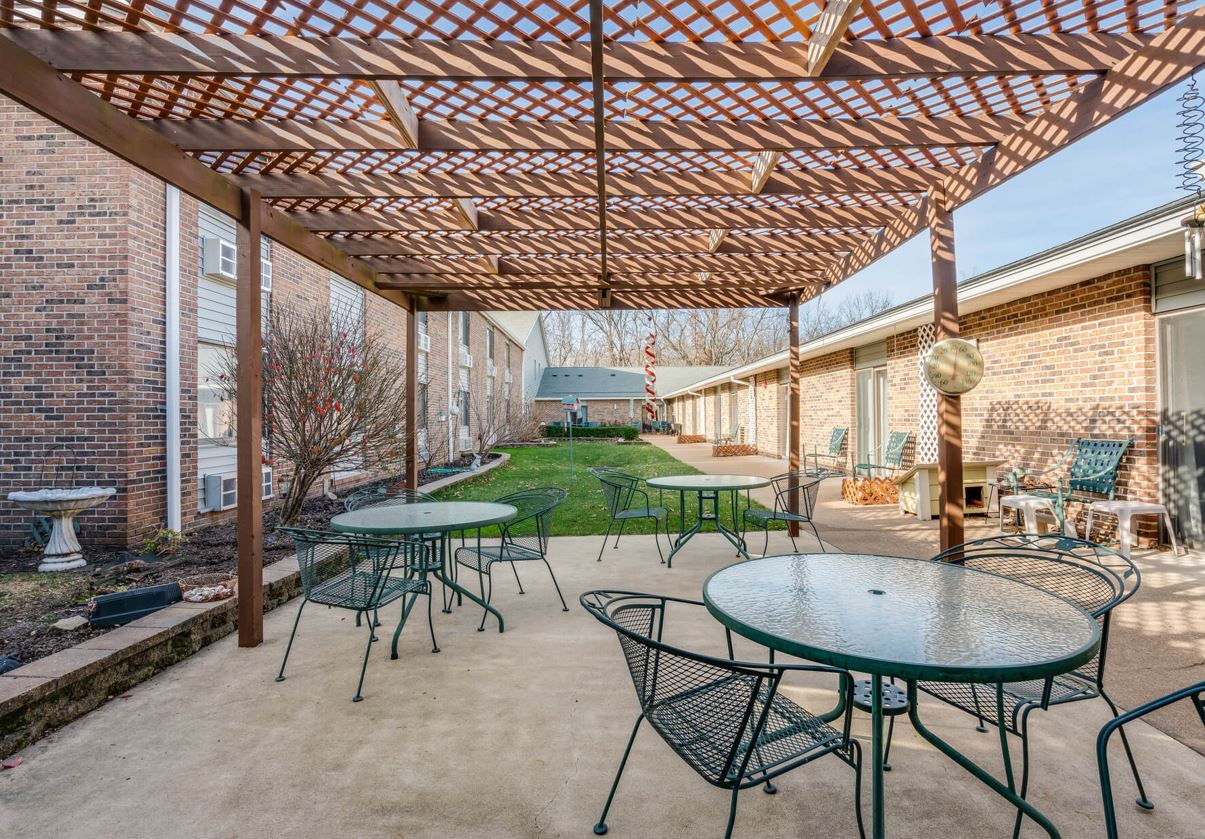
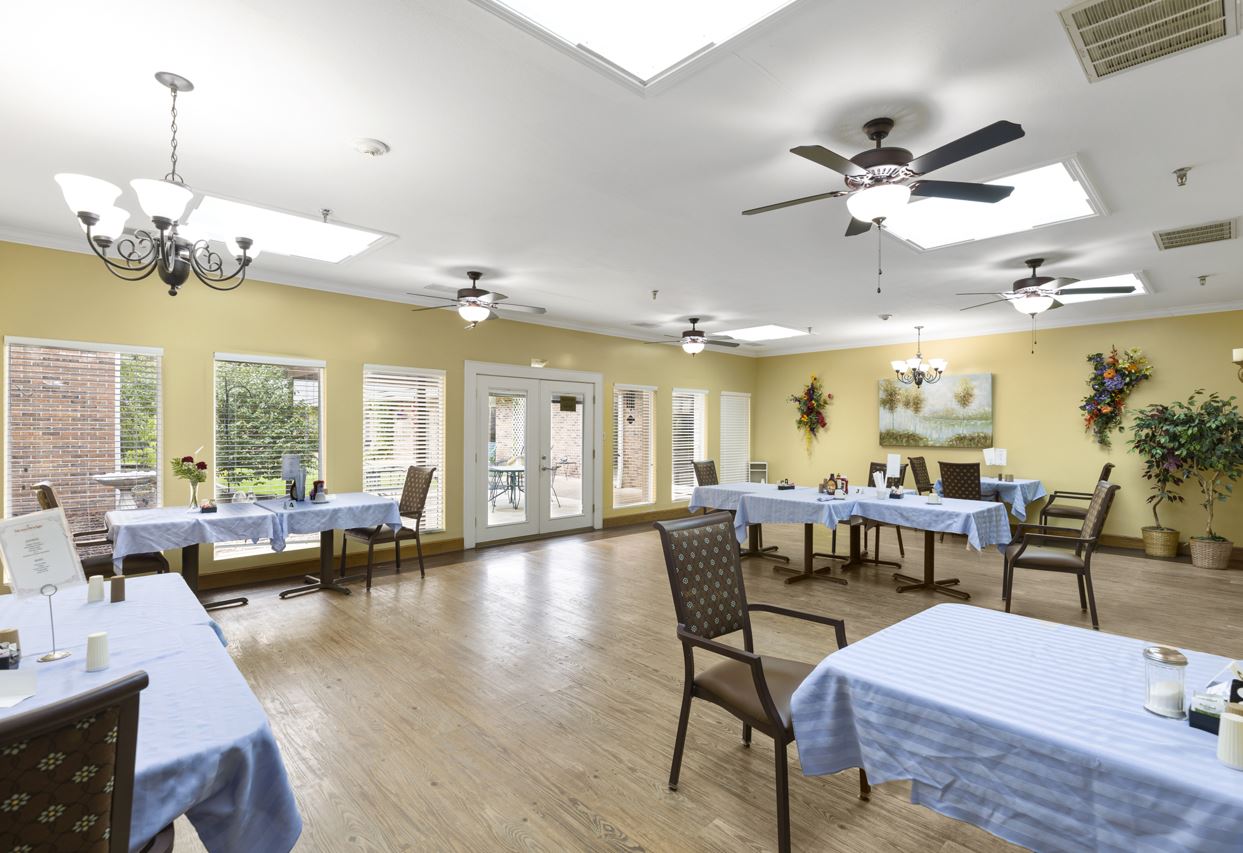
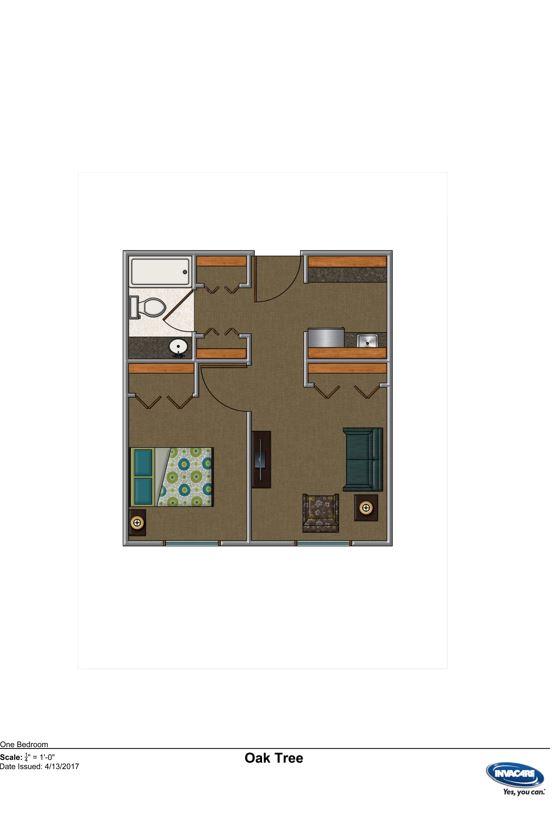
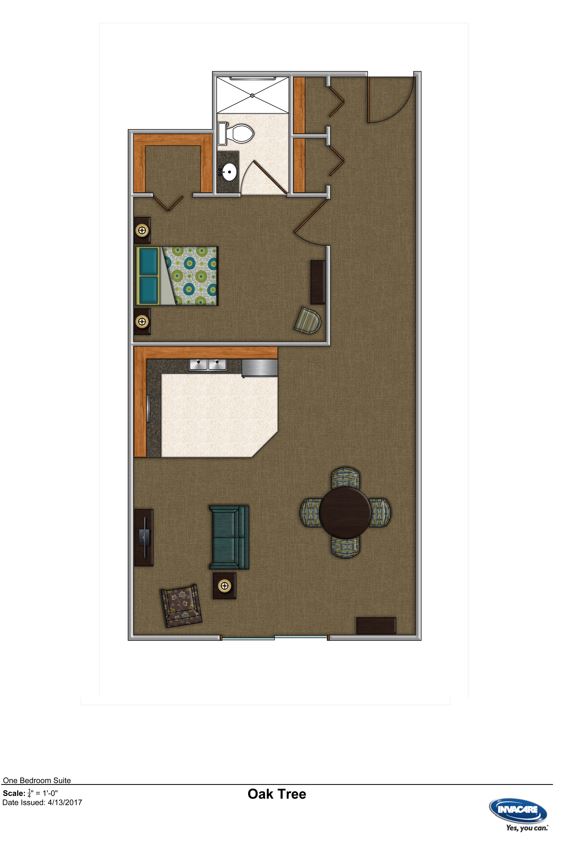
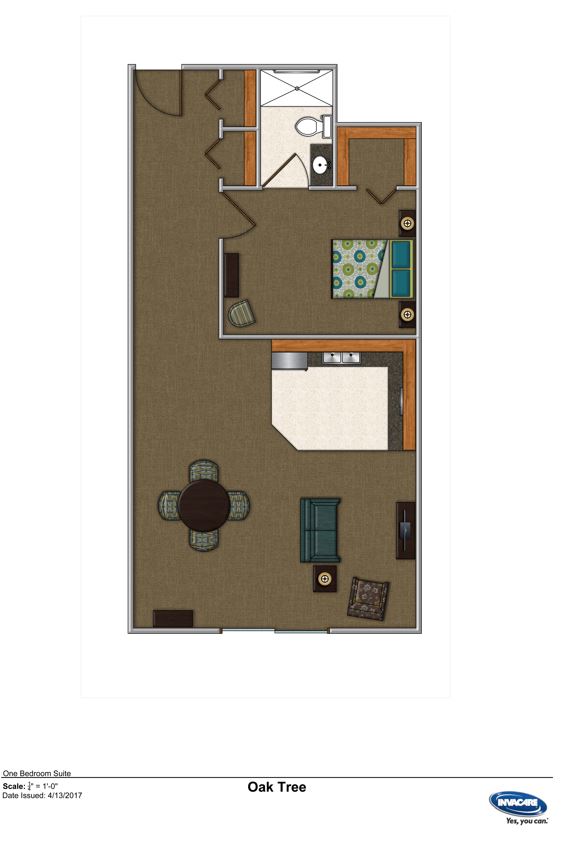
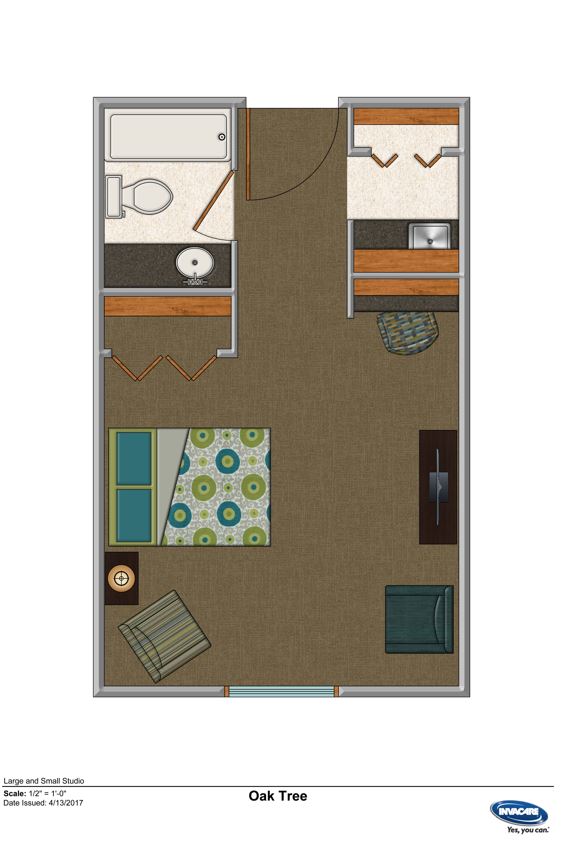
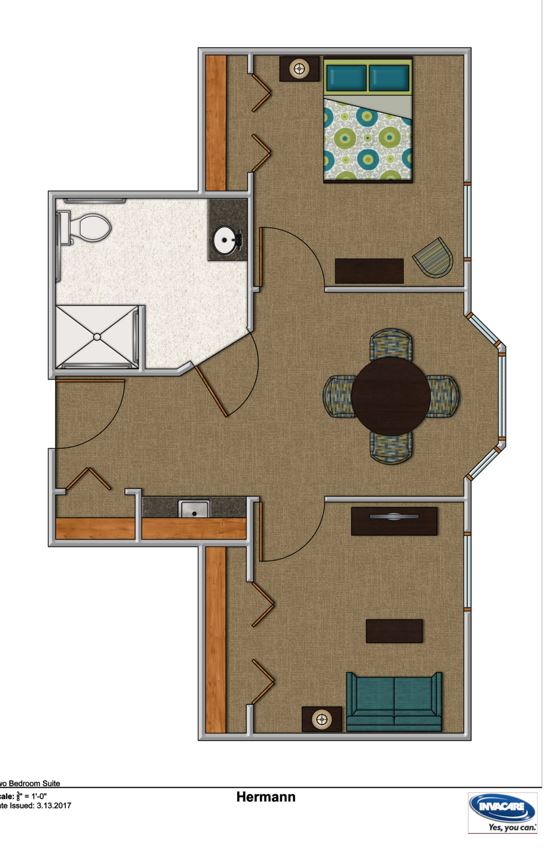
The floorplans at Stonebridge Senior Living Oak Tree are designed to accommodate various preferences, offering studios as well as one and two-bedroom options. The community flourishes with vibrant outdoor spaces that blend seamlessly with cozy and inviting interiors, providing residents with places to unwind. Whether it’s the charming outdoor areas or the clean and comfortable living spaces, every corner fosters relaxation and enjoyment. The senior-friendly bathrooms and a variety of common areas further enhance the quality of life for residents, creating an environment that nourishes the soul.
May offer a more intimate, personalized care environment.
Lower occupancy suggests more openings may be available.
This home supports both short-term rehab and long-term care, with residents staying for a wide range of durations.
38% of new residents, usually for short-term rehab.
58% of new residents, often for short stays.
4% of new residents, often for long-term daily care.
StoneBridge Senior Living Oak Tree is legally operated by ELDERCARE OF MID-MISSOURI VIII, INC, and administrated by RIDNOUR.
Pets Allowed: Yes, Pets Allowed
Housing Options: Studio / 1 Bed / 2 Bed
Transportation Services
Fitness and Recreation
Missouri average 6.6
Last Health inspection on Feb 2025
Missouri average 36.5
Missouri average 5.67
Health citations are formal notices following inspections when they fail to comply with safety and care standards.
17 of 21 citations resulted from standard inspections; and 4 of 21 resulted from complaint investigations.
Missouri average: 0.7
Missouri average: 1
Data sourced from CMS Health Deficiencies reports. Citation severity codes range from A (least serious) to L (most serious). Immediate Jeopardy (J-L) citations indicate situations where the facility's noncompliance has placed residents at risk of death or serious harm.
Assisted Living A licensed, long-term care setting for seniors or individuals with disabilities who need help with daily activities — like bathing, dressing, and medication management — but not 24-hour skilled nursing. Offers housing, meals, and around-the-clock support while aiming to maximize resident independence.
Memory Care Secured, specialized care for people living with Alzheimer's or dementia. Staff trained in cognitive impairment, with higher staff-to-resident ratios and an environment designed to reduce confusion and wandering risk.
Nursing Home Licensed facility providing 24/7 skilled nursing care for residents with complex, ongoing medical needs. Staffed by RNs, LPNs, and CNAs. Inspected and star-rated annually by CMS. Accepts Medicare (short-term rehab) and Medicaid (long-term care).
Assisted Living A licensed, long-term care setting for seniors or individuals with disabilities who need help with daily activities — like bathing, dressing, and medication management — but not 24-hour skilled nursing. Offers housing, meals, and around-the-clock support while aiming to maximize resident independence.
Assisted Living A licensed, long-term care setting for seniors or individuals with disabilities who need help with daily activities — like bathing, dressing, and medication management — but not 24-hour skilled nursing. Offers housing, meals, and around-the-clock support while aiming to maximize resident independence.
![]() 3.9 miles from city center — 1.66 miles to nearest hospital (MOCPS)
3.9 miles from city center — 1.66 miles to nearest hospital (MOCPS)
![]() 3108 W Truman Blvd, Jefferson City, MO 65109
3108 W Truman Blvd, Jefferson City, MO 65109
Add your location
This data corresponds to Q2 2025 and is based on CMS Payroll-Based Journal.
Missouri average ratio: 1.71:1
Missouri average: 8.1 hours
Manages medical care and health needs.
No contractors work on this role.
Assists with medical care and medications.
No contractors work on this role.
Helps with daily care and mobility.
No contractors work on this role.
Total hours from contractors
832 contractor hours this quarter
| Certified Nursing Assistant | 13 | 0 | 13 | 4,053 | 91 | 100% | 6.9 |
| Nurse Aide in Training | 16 | 0 | 16 | 3,024 | 91 | 100% | 7.1 |
| Licensed Practical Nurse | 5 | 0 | 5 | 2,382 | 91 | 100% | 9.4 |
| Medication Aide/Technician | 11 | 0 | 11 | 2,181 | 91 | 100% | 5.6 |
| Registered Nurse | 2 | 0 | 2 | 807 | 77 | 85% | 8.8 |
| Mental Health Service Worker | 1 | 0 | 1 | 540 | 63 | 69% | 8.6 |
| Dietitian | 1 | 0 | 1 | 510 | 64 | 70% | 8 |
| Clinical Nurse Specialist | 1 | 0 | 1 | 498 | 62 | 68% | 8 |
| Nurse Practitioner | 1 | 0 | 1 | 496 | 63 | 69% | 7.9 |
| Administrator | 1 | 0 | 1 | 440 | 55 | 60% | 8 |
| Physical Therapy Assistant | 0 | 1 | 1 | 303 | 60 | 66% | 5 |
| Speech Language Pathologist | 0 | 3 | 3 | 255 | 65 | 71% | 3.9 |
| Other Dietary Services Staff | 1 | 0 | 1 | 168 | 31 | 34% | 5.4 |
| Qualified Social Worker | 0 | 2 | 2 | 159 | 61 | 67% | 2.6 |
| Respiratory Therapy Technician | 0 | 2 | 2 | 54 | 31 | 34% | 1.8 |
| Occupational Therapy Aide | 0 | 1 | 1 | 24 | 16 | 18% | 1.5 |
| Physical Therapy Aide | 0 | 2 | 2 | 19 | 7 | 8% | 2.6 |
| Occupational Therapy Assistant | 0 | 1 | 1 | 14 | 3 | 3% | 4.7 |
| Medical Director | 0 | 1 | 1 | 5 | 3 | 3% | 1.5 |
Source: CMS Long-Term Care Facility Characteristics (Data as of Jan 2026)
Residents meet regularly to discuss policies, care quality, and activities
State-approved Nurse Aide Training and Competency Evaluation Program on-site
Organized group of residents that meets regularly to discuss facility policies, quality of life, and activities.
Data sourced from CMS Long-Term Care Facility Characteristics quarterly report. Payer mix reflects the current resident census by primary payment source.
These measures show how residents usually do over time at this home, based on health outcomes and preventive care.
Missouri average: 10.9
Missouri average: 19.5
Missouri average: 19.8%
Missouri average: 20.6%
Missouri average: 18.1%
Missouri average: 4.0%
Missouri average: 5.0%
Missouri average: 2.7%
Missouri average: 5.6%
Missouri average: 12.8%
Missouri average: 22.0%
Missouri average: 85.2%
Missouri average: 90.9%
Missouri average: 66.6%
Missouri average: 2.2%
Missouri average: 63.5%
Quality measures are calculated from Minimum Data Set (MDS) assessments. For most measures, lower percentages indicate better care quality.
Historical financial and operational data for StoneBridge Senior Living Oak Tree based on CMS SNF Cost Reports.
Loading trend charts...
Care Cost Calculator: See Prices in Your Area
Nursing Home Data Explorer
Don’t Wait Too Long: 7 Red Flag Signs Your Parent Needs Assisted Living Now
The True Cost of Assisted Living in 2025 – And How Families Are Paying For It
Understanding Senior Living Costs: Pricing Models, Discounts & Financial Assistance

Touring a community? Use this expert-backed checklist to stay organized, ask the right questions, and find the perfect fit.
We'll send you a PDF version of the touring checklist.


