


Total health inspections
14
State average 10.4
Last Health inspection on Oct 2025

We arrange tours, appointments, and even moving support so you don’t have to


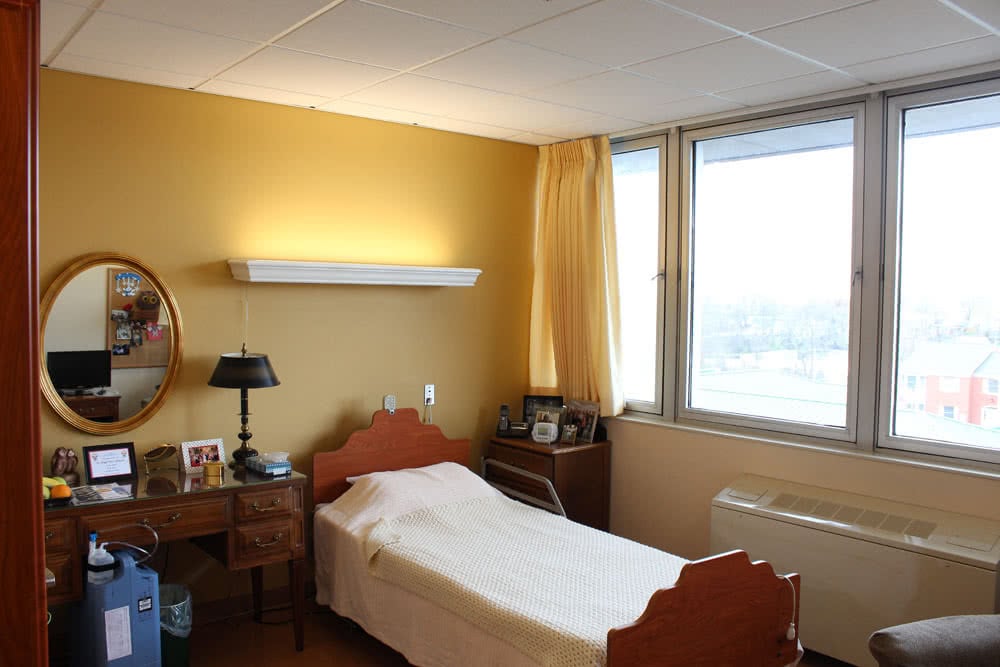
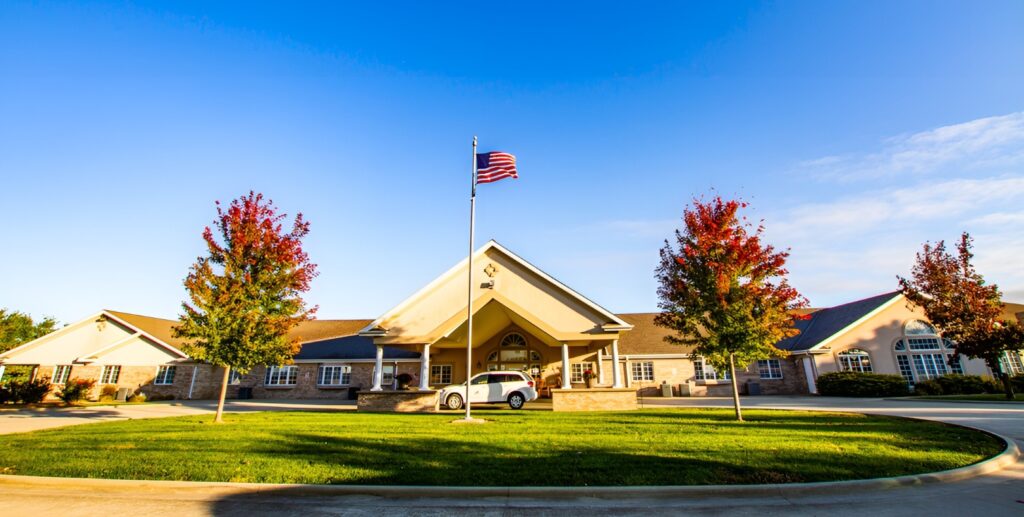
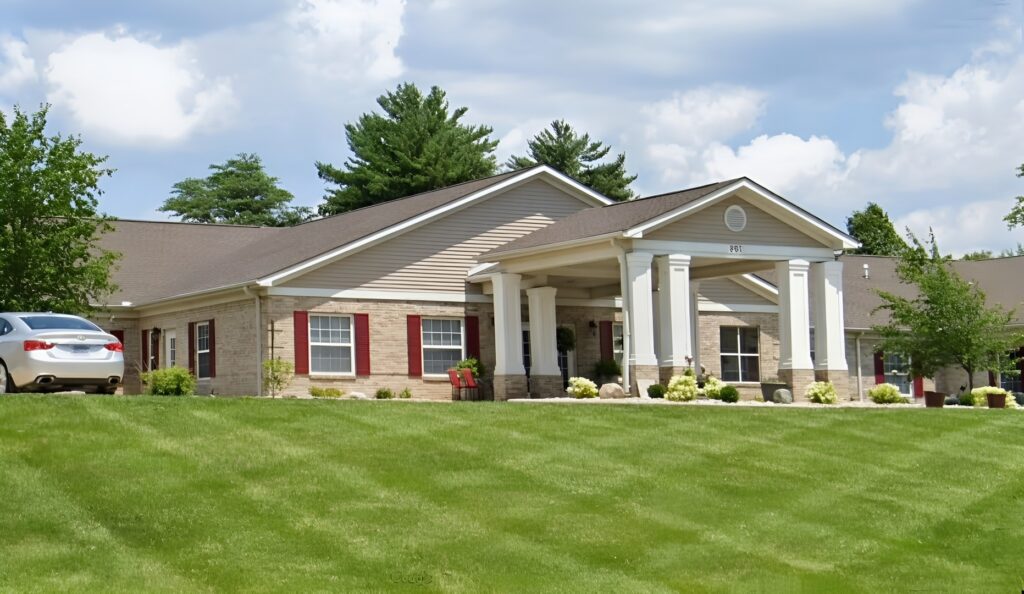
Nestled gracefully in Quincy, Illinois, Sunset Home Assisted Living provides support that nurtures residents’ independence while ensuring they receive the necessary assistance. Their focus extends beyond physical care to encompass social and emotional needs of seniors. This community boasts a range of living options, including 18 apartments, with studios and one-bedroom units designed to be handicap accessible. Each apartment is also equipped with private bathrooms featuring walk-in showers, as well as kitchenettes for added convenience.
Sunset Home Assisted Living takes pride in its meticulous housekeeping and laundry services, maintaining a spotless and well-organized environment. Residents can even enjoy Wi-Fi connectivity, and the on-site therapy services offer physical, occupational, and speech therapy for those who need it. Furthermore, the facility houses a beauty and barber salon with affordable prices to cater to residents’ grooming needs. Outdoors, a courtyard provides a picturesque setting for various activities, including picnics and cookouts, creating a vibrant community for its residents.
 Official CMS rating based on health inspections, staffing and quality measures.
Official CMS rating based on deficiencies found during state health inspections.
Official CMS rating based on nurse staffing hours per resident per day.
Official CMS rating based on clinical outcomes for residents.
Average daily nursing hours per resident (adjusted for acuity). Higher values indicate more nursing time per resident.
Official CMS rating based on health inspections, staffing and quality measures.
Official CMS rating based on deficiencies found during state health inspections.
Official CMS rating based on nurse staffing hours per resident per day.
Official CMS rating based on clinical outcomes for residents.
Average daily nursing hours per resident (adjusted for acuity). Higher values indicate more nursing time per resident.
Offers a balance of services and community atmosphere.
Lower occupancy suggests more openings may be available.
Most residents typically stay for a few weeks or months before returning home or moving on.
76% of new residents, usually for short-term rehab.
14% of new residents, often for short stays.
11% of new residents, often for long-term daily care.
The portion of the home's budget spent on staff, including nurses, caregivers, and other employees who support care and operations.
All remaining costs needed to run the home, such as food, utilities, building maintenance, supplies and administrative expenses.
Key information about the people who lead and staff this community.
Nursing Home 24/7 care needed
Assisted Living For seniors needing help with daily tasks but not full-time nursing.
Nursing
Assisted Living For seniors needing help with daily tasks but not full-time nursing.
Assisted Living For seniors needing help with daily tasks but not full-time nursing.
Assisted Living For seniors needing help with daily tasks but not full-time nursing.
Assisted Living For seniors needing help with daily tasks but not full-time nursing.
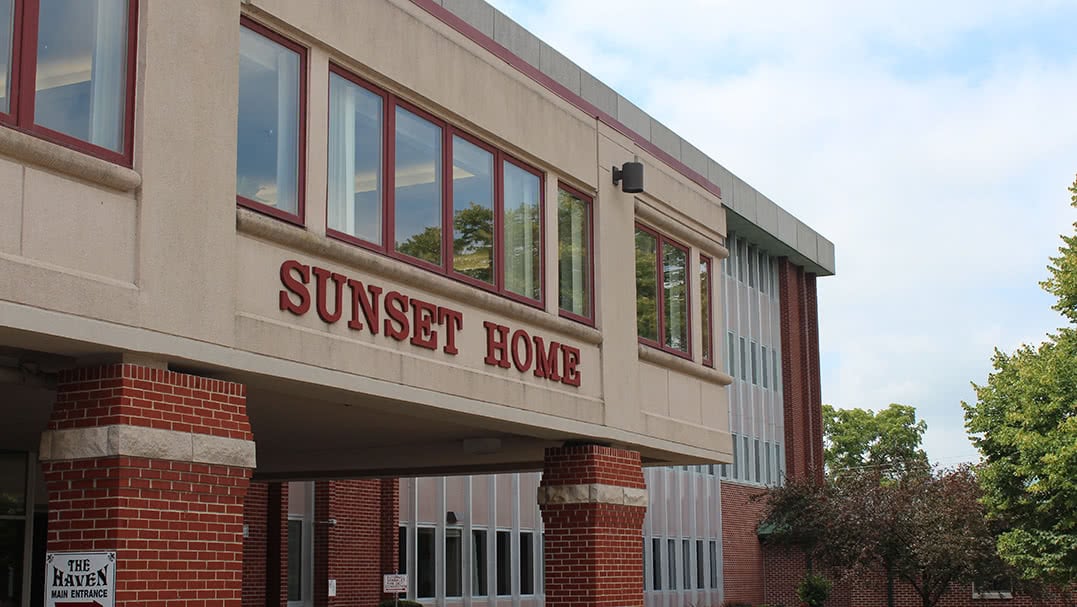
 Sunset Home Assisted Living
![]() 139 miles from city center — 0.94 miles to nearest hospital (Quincy, Illinois)
139 miles from city center — 0.94 miles to nearest hospital (Quincy, Illinois)
![]() 418 Washington St, Quincy, IL 62301
418 Washington St, Quincy, IL 62301
Add your location
Source: CMS Payroll-Based Journal (Q2 2025)
| Role ⓘ | Count ⓘ | Avg Shift (hrs) ⓘ | Uses Contractors? ⓘ |
|---|---|---|---|
| Registered Nurse | 31 | 7.5 | Yes |
| Licensed Practical Nurse | 37 | 9.1 | Yes |
| Certified Nursing Assistant | 107 | 8.5 | Yes |
| Role ⓘ | Employees ⓘ | Contractors ⓘ | Total Staff ⓘ | Total Hours ⓘ | Days Worked ⓘ | % of Days ⓘ | Avg Shift (hrs) ⓘ |
|---|---|---|---|---|---|---|---|
| Certified Nursing Assistant | 63 | 44 | 107 | 20,854 | 91 | 100% | 8.5 |
| Licensed Practical Nurse | 13 | 24 | 37 | 7,777 | 91 | 100% | 9.1 |
| Registered Nurse | 13 | 18 | 31 | 3,969 | 91 | 100% | 7.5 |
| Other Dietary Services Staff | 4 | 0 | 4 | 1,568 | 91 | 100% | 7.9 |
| Dental Services Staff | 3 | 0 | 3 | 1,288 | 74 | 81% | 7 |
| Physical Therapy Aide | 2 | 0 | 2 | 946 | 73 | 80% | 8 |
| Speech Language Pathologist | 3 | 0 | 3 | 792 | 64 | 70% | 7 |
| RN Director of Nursing | 1 | 0 | 1 | 538 | 63 | 69% | 8.5 |
| Nurse Practitioner | 1 | 0 | 1 | 499 | 63 | 69% | 7.9 |
| Administrator | 1 | 0 | 1 | 488 | 61 | 67% | 8 |
| Clinical Nurse Specialist | 2 | 0 | 2 | 451 | 63 | 69% | 7 |
| Qualified Social Worker | 1 | 0 | 1 | 404 | 63 | 69% | 6.4 |
| Physical Therapy Assistant | 1 | 0 | 1 | 172 | 46 | 51% | 3.7 |
| Respiratory Therapy Technician | 2 | 0 | 2 | 160 | 48 | 53% | 3.3 |
| Dietitian | 1 | 0 | 1 | 64 | 8 | 9% | 8 |
| Occupational Therapy Aide | 0 | 1 | 1 | 49 | 13 | 14% | 3.7 |
| Occupational Therapy Assistant | 0 | 2 | 2 | 31 | 5 | 5% | 6.2 |
State average 10.4
Last Health inspection on Oct 2025
Health citations are formal notices following inspections when they fail to comply with safety and care standards.
30 of 64 citations resulted from standard inspections; and 34 of 64 resulted from complaint investigations.
State average: 0.7
State average: 3.6
Data sourced from CMS Health Deficiencies reports. Citation severity codes range from A (least serious) to L (most serious). Immediate Jeopardy (J-L) citations indicate situations where the facility's noncompliance has placed residents at risk of death or serious harm.
Source: CMS Long-Term Care Facility Characteristics (Data as of Jan 2026)
Active councils help families stay involved in care decisions and facility operations.
These measures show how residents usually do over time at this home, based on health outcomes and preventive care.
Illinois average: 9.7
Illinois average: 18.6
Illinois average: 15.5%
Illinois average: 18.4%
Illinois average: 21.6%
Illinois average: 3.4%
Illinois average: 5.3%
Illinois average: 1.8%
Illinois average: 6.5%
Illinois average: 48.1%
Illinois average: 20.2%
Illinois average: 89.2%
Illinois average: 91.6%
Illinois average: 68.3%
Illinois average: 2.3%
Illinois average: 63.0%
Quality measures are calculated from Minimum Data Set (MDS) assessments. For most measures, lower percentages indicate better care quality.
Federal penalties imposed by CMS for regulatory violations, including civil money penalties (fines) and denials of payment for new Medicare/Medicaid admissions.
Source: CMS Penalties Database (Data as of Jan 2026)
Illinois average: $143K
Illinois average: 3.0
Illinois average: 1.1
Penalties are imposed by CMS for violations of federal nursing home regulations.
Last updated: Jan 2026
Historical financial and operational data for Sunset Home Assisted Living based on CMS SNF Cost Reports.
Loading trend charts...
Care Cost Calculator: See Prices in Your Area
Nursing Home Data Explorer
Don’t Wait Too Long: 7 Red Flag Signs Your Parent Needs Assisted Living Now
The True Cost of Assisted Living in 2025 – And How Families Are Paying For It
Understanding Senior Living Costs: Pricing Models, Discounts & Financial Assistance

We help families find affordable senior communities and unlock same day discounts, Medicaid, and Medicare options tailored to your needs.
Contact us Today
Touring a community? Use this expert-backed checklist to stay organized, ask the right questions, and find the perfect fit.
We'll send you a PDF version of the touring checklist.


