Nursing Home

Tampico Terrace Care Center

Nursing Home

Tampico Terrace Care Center

130 Tampico, Walnut Creek, CA 94598 View map
Overview of Tampico Terrace Care Center

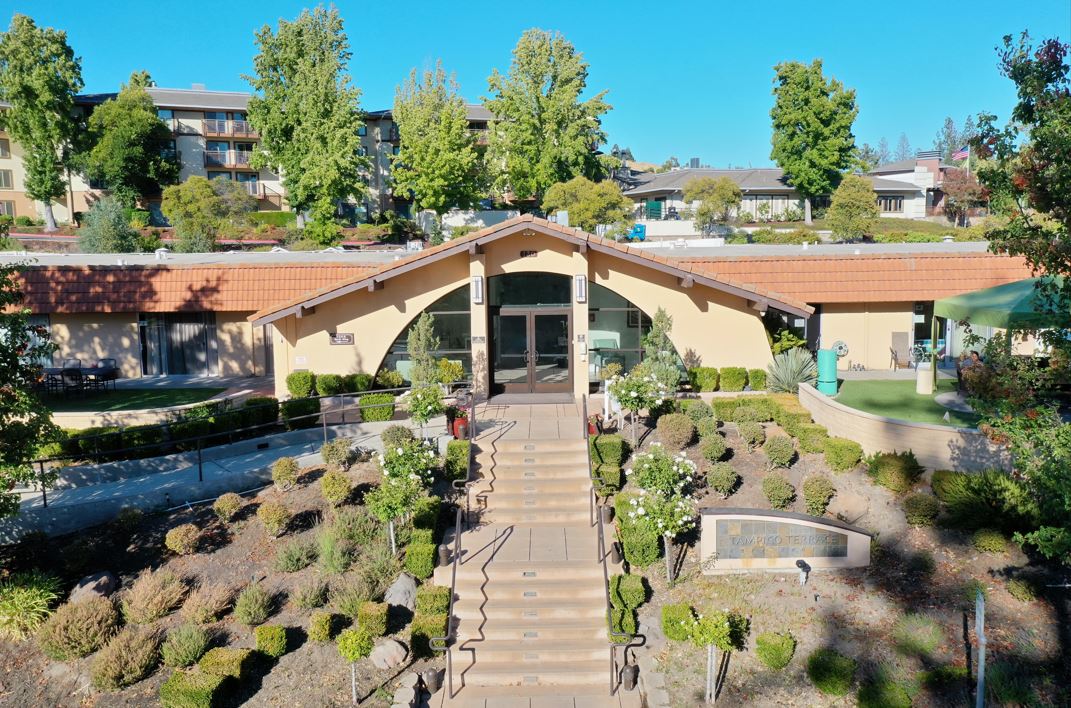
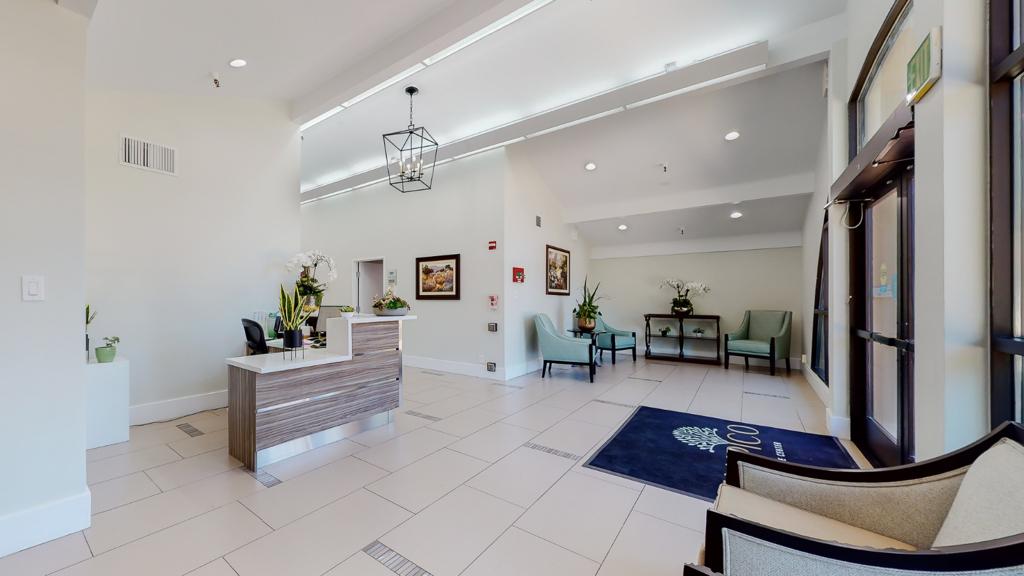
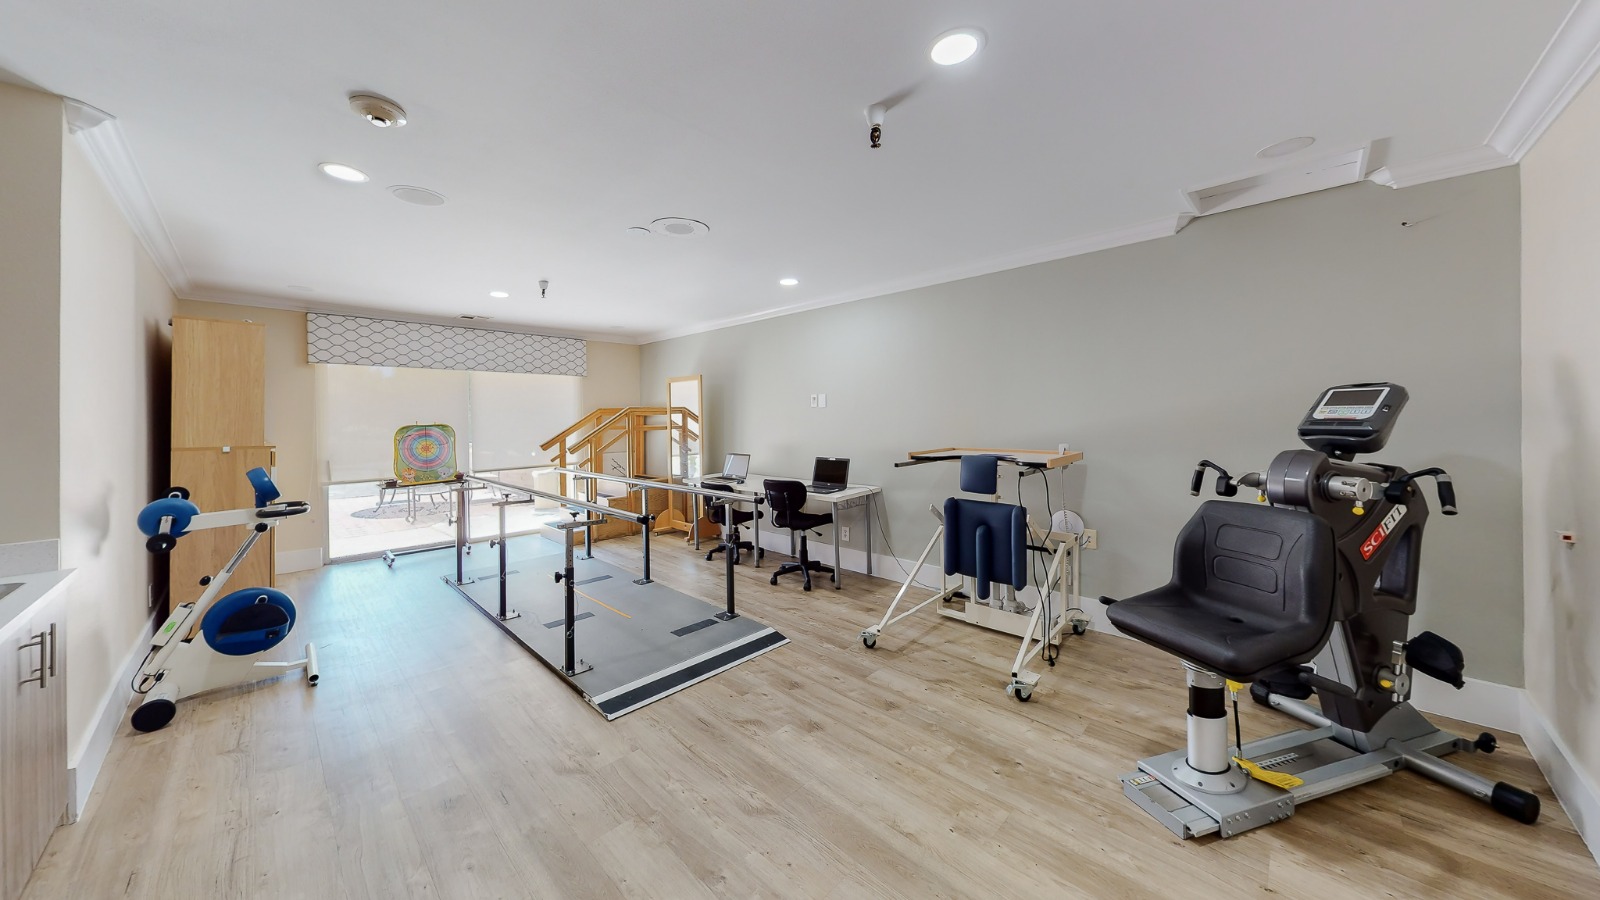
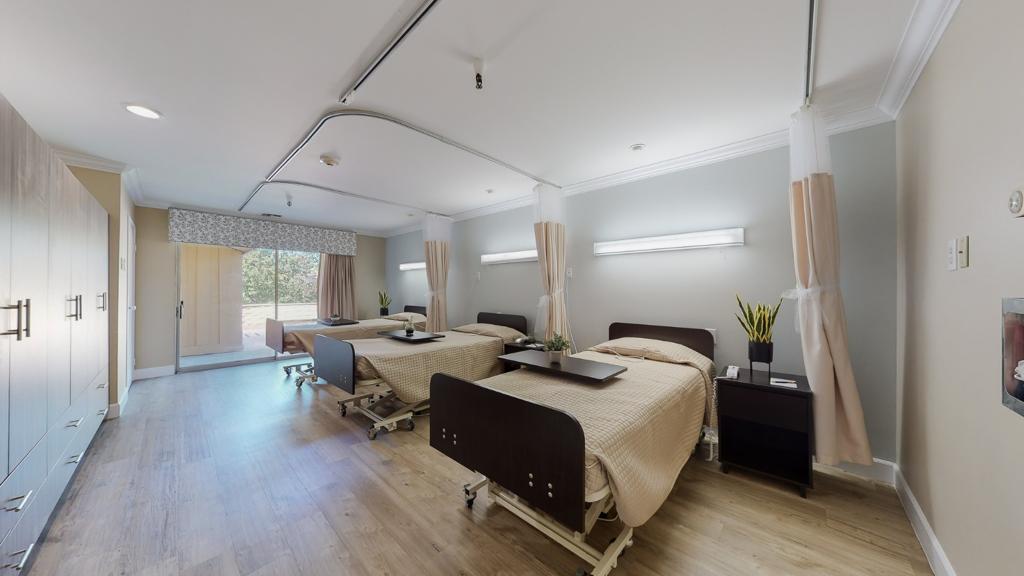
Tampico Healthcare Center is Walnut Creek’s luxury retirement home in that offers premier skilled nursing and rehabilitation services for seniors in the city. Management places great importance on delivering the highest standard of senior healthcare for individuals to recover in a relaxing and rejuvenating manner. The results-driven community offers an unmatched quality of service that promotes and improves individual wellness centered on the convenience and comfort of each unique resident, empowering them to bounce back to a better quality of life.

At Tampico, residents are at the center of care. Families are confident to place their trust in professional and compassionate caregivers who continue to provide continuous and unwavering support for their loved ones. Senior wellness emphasizes long-term and short-term care, including therapy services, medication management, healthy and delicious meal plans, 24/7 nursing care, and calendar-filled activities.

(925) 933-7970

Quality ratings

Measured by Centers for Medicare & Medicaid Services (CMS)

Overall rating Info Official CMS rating based on health inspections, staffing and quality measures.
3/5
California average: 3.1/5
Health Inspection Info Official CMS rating based on deficiencies found during state health inspections.
3/5
California average: 2.8/5
Staffing Info Official CMS rating based on nurse staffing hours per resident per day.
4/5
California average: 3.1/5
Quality Measures Info Official CMS rating based on clinical outcomes for residents.
4/5
California average: 4.1/5

Nursing care per resident

Info Average daily nursing hours per resident (adjusted for acuity). Higher values indicate more nursing time per resident.
4h 12m per day

This home provides 1% less nursing time per resident than the California average.

California average: 4h 13m per day

Staffing hours breakdown

Info Hours of care per resident per day, broken down by staff type. Data from CMS Medicare.
Staff type Facility State avg National avg
Registered Nurse (RN) Info Registered nurse hours per resident per day. 28m per day 30m per day 29m per day

Capacity and availability

Medium-capacity home

Offers a balance of services and community atmosphere.

Total beds 128

This home usually has availability

Lower occupancy suggests more openings may be available.

Lower demand than the California average
Occupancy rate 74.6%
Residents per day (avg) 118
Occupancy rate
74.6%
Residents per day (avg)
118

Who this home usually serves

TYPE OF STAY

Mostly long-term care residents

Most residents stay for extended periods and receive ongoing daily care.

Might be optimal for
Long-term daily care Ongoing support needs

Breakdown by payment type

Medicare

23% of new residents, usually for short-term rehab.

Typical stay 1 - 2 months

Private pay

12% of new residents, often for short stays.

Typical stay 2 - 3 months

Medicaid

65% of new residents, often for long-term daily care.

Typical stay 2 - 3 months

Finances and operations

Privately-owned community
Operated by a business corporation.
Home revenue
$23.0M
Profit
$2.0M
Privately-owned community Operated by a business corporation.
Home revenue
$22,968,384.00
Profit
$1,972,419.00
Payroll costs Info The portion of the home's budget spent on staff, including nurses, caregivers, and other employees who support care and operations.
$8.9M
38.9% of revenue
Other operating costs Info All remaining costs needed to run the home, such as food, utilities, building maintenance, supplies and administrative expenses.
$12.1M
Total costs $21.0M

Health Inspection History

Inspections
Total health inspections 11

California average 12.5


Last Health inspection on Oct 2025

Total health citations 40
Citations per inspection
3.64

Health citations are formal notices following inspections when they fail to comply with safety and care standards.

29 of 40 citations resulted from standard inspections; and 11 of 40 resulted from complaint investigations.

Breakdown of citation severity (last 3 years)
Critical Health citations More info 0
100% better than California average

California average: 0.4


Serious Health citations More info 0
100% better than California average

California average: 1

0 critical citations More info California average: 0.4

0 serious citations More info California average: 1

40 moderate citations More info California average: 47.2

0 minor citations More info California average: 1.5
Citations history (last 3 years)
Infection Control moderate citation Oct 11, 2025

Nutrition moderate citation Mar 27, 2025
Corrected

Nutrition moderate citation Mar 27, 2025
Corrected

Nutrition moderate citation Mar 27, 2025
Corrected

Compare Nursing Homes around Walnut Creek

The information below is reported by the California Department of Social Services and Department of Public Health.
Tampico Terrace Care Center
N

Nursing

SNF

Nursing Homes 24/7 care needed

Walnut Creek
128
40
ELLKS, MARJORIE
74.6%
$22,224,526.00
$8,940,272.00
40.2%
118
3/5
4.1966
3/5
4/5
4/5
1
40
-18%
-1%
-12%

Places of interest near Tampico Terrace Care Center

Address 1.1 miles from city center — 1.47 miles to nearest hospital (Kaiser Permanente Walnut Creek Medical Center)

Address 130 Tampico, Walnut Creek, CA 94598

Calculate Travel Distance to Tampico Terrace Care Center

Add your location

Address

Staffing Data

Source: CMS Payroll-Based Journal (Q2 2025)

171
Total Staff
168
Employees
3
Contractors
56,712
Total Hours (Quarter)
82
Avg Staff/Day
7.6
Avg Shift (hrs)
Nursing Staff Breakdown
Role Count Avg Shift (hrs) Uses Contractors?
Registered Nurse127.9 No
Licensed Practical Nurse347.9 No
Certified Nursing Assistant817.4 No
Staff by Category
Administration
2 staff
7.9hs shift avg
Nursing Staff
132 staff
7.6hs shift avg
Physicians & Practitioners
5 staff
7.8hs shift avg
Therapy Services
21 staff
7.2hs shift avg
Activities & Recreation
3 staff
11.5hs shift avg
Social Services
2 staff
5.1hs shift avg
Dietary Services
3 staff
7.9hs shift avg
Other Services
3 staff
8.5hs shift avg
Contractor Analysis
0.6%
of total hours from contractors
321 contractor hours this quarter
Qualified Activities Professional: 3
Role Employees Contractors Total Staff Total Hours Days Worked % of Days Avg Shift (hrs)
Certified Nursing Assistant8108128,16891100%7.4
Licensed Practical Nurse3403411,69191100%7.9
Registered Nurse120123,99291100%7.9
RN Director of Nursing5052,2688492%8.7
Respiratory Therapy Technician5051,6537481%7.5
Occupational Therapy Aide5051,3877785%8.3
Clinical Nurse Specialist4041,2387785%7.7
Physical Therapy Assistant5051,1117582%7.2
Dental Services Staff2021,0566470%8.5
Administrator2028496066%7.9
Speech Language Pathologist5058107279%6.3
Mental Health Service Worker1015376470%8.4
Nurse Practitioner1015046369%8
Dietitian1014445662%7.9
Other Dietary Services Staff2023434347%8
Qualified Activities Professional0333212831%11.5
Qualified Social Worker2021793538%5.1
Physical Therapy Aide1011623741%4.4

Facility Characteristics

Source: CMS Long-Term Care Facility Characteristics (Data as of Jan 2026)

Total census
121 residents
Residents by payment source
Medicare
43 residents (35.5%)
Medicaid
63 residents (52.1%)
Private pay or other
15 residents (12.4%)
Programs & Services
Residents' Group

Residents meet regularly to discuss policies, care quality, and activities

Nurse Aide Training

State-approved Nurse Aide Training and Competency Evaluation Program on-site

Active Resident Council

Organized group of residents that meets regularly to discuss facility policies, quality of life, and activities.

Quality of care over time

These measures show how residents usually do over time at this home, based on health outcomes and preventive care.

High-risk clinical events score Info A composite score based on pressure ulcers, falls with injury, weight loss, walking ability decline, and activities of daily living decline. 9.0
36% worse than California average

California average: 6.6

Functional decline score Info A composite score based on activities of daily living decline, walking ability decline, and incontinence. 16.5
45% worse than California average

California average: 11.3

Long-stay resident measures
Above average California avg: 4.3 Info CMS star rating based on long-stay quality measure performance. 5 stars = significantly above average, 1 star = significantly below average.
Need for Help with Daily Activities Increased Info Percent of long-stay residents whose need for help with daily activities has increased 14.4%
30% worse than California average

California average: 11.1%

Walking Ability Worsened Info Percent of long-stay residents whose ability to move independently worsened 16.7%
40% worse than California average

California average: 12.0%

Low Risk Residents with Bowel/Bladder Incontinence Info Percent of low risk long-stay residents who lose control of their bowels or bladder 18.4%
63% worse than California average

California average: 11.3%

Falls with Major Injury Info Percent of long-stay residents experiencing one or more falls with major injury 1.3%
21% better than California average

California average: 1.7%

High Risk Residents with Pressure Ulcers Info Percent of long-stay high risk residents with pressure ulcers 4.6%
8% better than California average

California average: 5.0%

Urinary Tract Infection Info Percent of long-stay residents with a urinary tract infection 2.1%
66% worse than California average

California average: 1.2%

Lost Too Much Weight Info Percent of long-stay residents who lose too much weight 8.2%
95% worse than California average

California average: 4.2%

Depressive Symptoms Info Percent of long-stay residents who have depressive symptoms 8.0%
20% worse than California average

California average: 6.7%

Antipsychotic Use Info Percent of long-stay residents who received an antipsychotic medication 7.6%
25% better than California average

California average: 10.1%

Pneumococcal Vaccine Info Percent of long-stay residents assessed and appropriately given the pneumococcal vaccine 100.0%
In line with California average

California average: 98.5%

Influenza Vaccine Info Percent of long-stay residents assessed and appropriately given the seasonal influenza vaccine 100.0%
In line with California average

California average: 98.2%

Hospitalizations per 1,000 days Info Number of hospitalizations per 1,000 long-stay resident days. 2.12
6% better than California average

California average: 2.25

ED visits per 1,000 days Info Number of outpatient emergency department visits per 1,000 long-stay resident days. 1.95
23% worse than California average

California average: 1.59

Short-stay resident measures
Significantly above average California avg: 3.5 Info CMS star rating based on short-stay quality measure performance. 5 stars = much above average, 1 star = much below average.
Pneumococcal Vaccine Info Percent of short-stay residents assessed and appropriately given the pneumococcal vaccine 99.5%
6% better than California average

California average: 94.0%

Antipsychotic medication increase Info Percent of short-stay residents who newly received an antipsychotic medication 0.8%
46% better than California average

California average: 1.5%

Influenza Vaccine Info Percent of short-stay residents assessed and appropriately given the seasonal influenza vaccine 97.9%
5% better than California average

California average: 93.2%

Re-hospitalized after SNF stay Info Percentage of short-stay residents who were re-hospitalized after their nursing home admission. 25.2%
9% worse than California average

California average: 23.2%

Emergency department visits Info Percentage of short-stay residents who had an outpatient emergency department visit. 13.1%
17% worse than California average

California average: 11.2%

Falls with major injury Info Percentage of SNF residents who experience falls with major injury during their stay. 0.3%
58% better than California average

California average: 0.8%

Ability to care for self at discharge Info Percentage of residents at or above expected ability to care for themselves at discharge. 70.9%
32% better than California average

California average: 53.7%

Successful return to home or community Info Rate of successful return to home or community from a skilled nursing facility. 61.2%
21% better than California average

California average: 50.6%

Guides for Better Senior Living

Care Cost Calculator: See Prices in Your Area

Nursing Home Data Explorer

Don’t Wait Too Long: 7 Red Flag Signs Your Parent Needs Assisted Living Now

The True Cost of Assisted Living in 2025 – And How Families Are Paying For It

Understanding Senior Living Costs: Pricing Models, Discounts & Financial Assistance

Financial Aid for California Seniors

Get financial aid guidance

Multipurpose Senior Services Program

MSSP (Medi-Cal Waiver)

Age 65+, California resident, Medi-Cal eligible, nursing home risk.

~$2,829/month (300% FBR, individual).

$2,000 (individual), $3,000 (couple).

County-managed; waitlists possible.

In-Home Supportive Services (IHSS)

California IHSS

Age 65+, California resident, Medicaid-eligible or low-income.

~$1,732/month (individual, Medi-Cal threshold).

$2,000 (individual).

Can hire family as caregivers.

Multipurpose Senior Services Program (MSSP)

CA MSSP

Age 65+, California resident, Medi-Cal-eligible, nursing home-eligible but community-capable.

~$2,829/month (300% FBR, individual).

$2,000 (individual).

Available in 38 counties; waitlists common.

Property Tax Postponement Program (PTP)

CA PTP

Age 62+, California resident, own and live in home, 40% equity.

~$51,500/year (household, adjusted annually).

Equity-based; no strict asset cap.

Deferred taxes accrue interest (5% as of 2024); repaid upon sale/death.

Assisted Living Waiver (ALW)

CA ALW

Age 65+ or disabled, California resident, Medi-Cal-eligible, nursing home-eligible.

~$2,829/month (300% FBR, individual).

$2,000 (individual).

Available in 15 counties (e.g., LA, Sacramento); waitlists common.

California CARES Program

CA CARES

Caregivers of California residents 60+ needing help with 3+ daily activities; no caregiver age limit.

No strict limit; cost-sharing above ~$2,500/month threshold.

Not applicable; need-based.

High demand in urban areas; complements IHSS respite.

Low-Income Home Energy Assistance Program (LIHEAP)

CA LIHEAP

Age 60+ priority, California resident, low-income, utility/heating need.

~$2,510/month (200% of poverty level, individual).

Not applicable; income-focused.

High demand in inland/coastal extremes; weatherization capped at $5,000/home.

Tour Icon
Planning a tour? Check our touring checklist.
Chat Icon
Thinking of living here? We can help you speak to a current resident