Assisted Living Home

The Bridge at Charleston

Assisted Living Home

The Bridge at Charleston

2590 Elms Plantation Blvd, Charleston, SC 29406 View map
Overview of The Bridge at Charleston
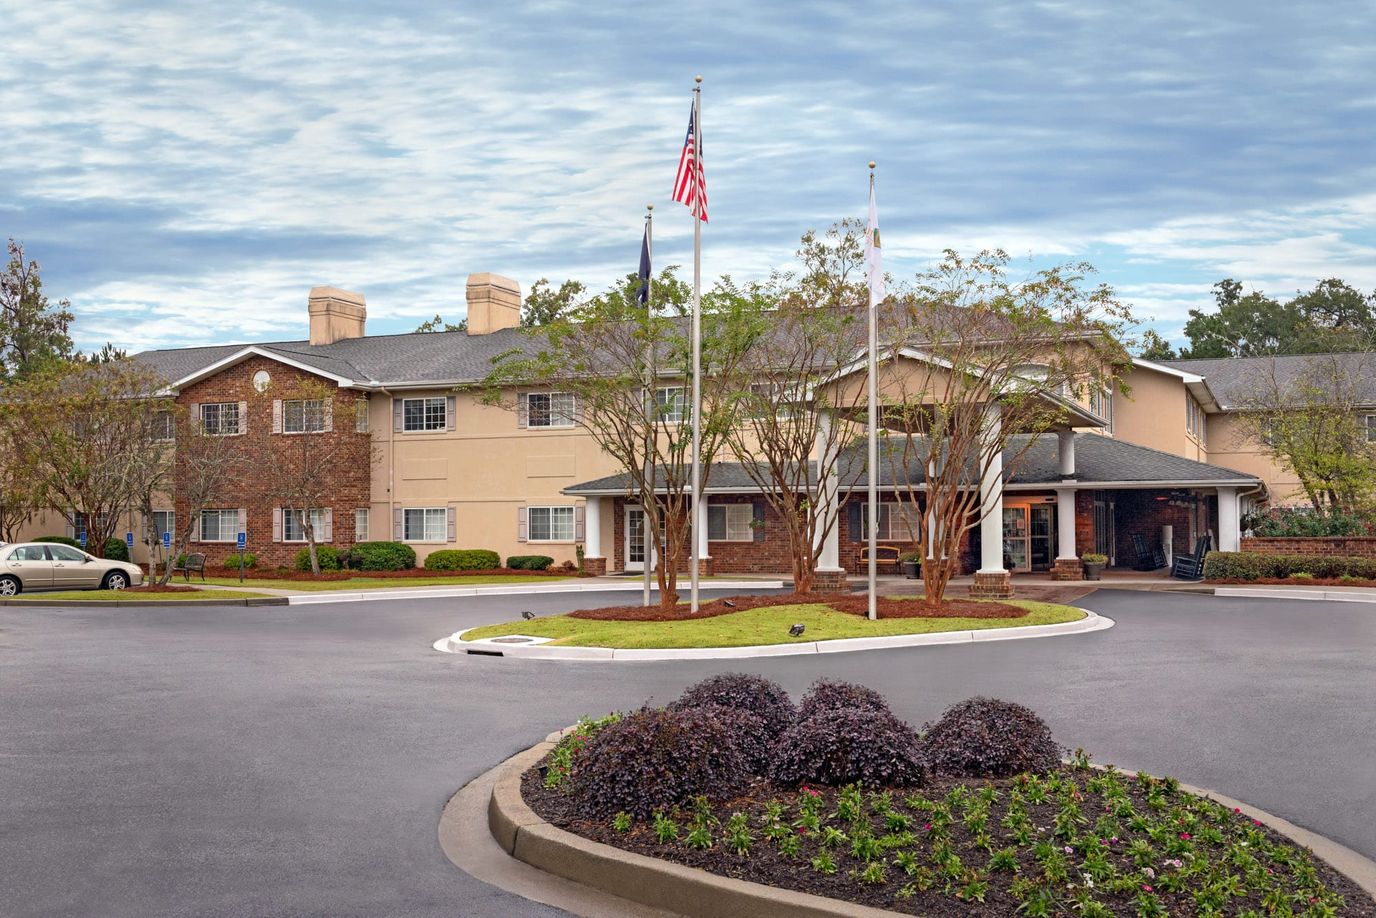
The Bridge at Charleston is a luxurious Century Park community situated in South Carolina, offering assisted living to its residents. The community provides a serene sanctuary for the elderly to enjoy their retirement in comfort while being surrounded by a range of natural and cultural attractions. Residents can explore nearby museums, markets, and breathtaking beaches that are ideal for relaxation and recreation.

With advanced sign-in and health screening technology, the community ensures that residents are safe and secure at all times. They have a wellness center, hair salon, and scheduled transportation services to cater to the various needs of residents. Residents can also enjoy the vibrant ambiance of the library, coffee room, or craft room. The beautifully landscaped grounds add to the overall charm of the home, providing residents with an elegant and refreshing environment to come home to.

(843) 553-6342

Quality ratings

Measured by Centers for Medicare & Medicaid Services (CMS)

Overall rating Info Official CMS rating based on health inspections, staffing and quality measures.
2/5
South Carolina average: 2.9/5
Health Inspection Info Official CMS rating based on deficiencies found during state health inspections.
1/5
South Carolina average: 2.7/5
Staffing Info Official CMS rating based on nurse staffing hours per resident per day.
2/5
South Carolina average: 3.0/5
Quality Measures Info Official CMS rating based on clinical outcomes for residents.
5/5
South Carolina average: 3.5/5

Nursing care per resident

Info Average daily nursing hours per resident (adjusted for acuity). Higher values indicate more nursing time per resident.
3h 25m per day

This home provides 16% less nursing time per resident than the South Carolina average.

South Carolina average: 4h 5m per day

Capacity and availability

Medium-capacity home

Offers a balance of services and community atmosphere.

Total beds 100

This home usually has availability

Lower occupancy suggests more openings may be available.

Lower demand than the South Carolina average
Occupancy rate 74%
Residents per day (avg) 112
Occupancy rate
74%
Residents per day (avg)
112

Who this home usually serves

TYPE OF STAY

Mostly short-term rehab stays

Most residents typically stay for a few weeks or months before returning home or moving on.

Might be optimal for
Short stays Recovery Medicare-covered care

Breakdown by payment type

Medicare

49% of new residents, usually for short-term rehab.

Typical stay 28 days

Private pay

47% of new residents, often for short stays.

Typical stay 1 months

Medicaid

4% of new residents, often for long-term daily care.

Typical stay 1 - 2 years

Finances and operations

Privately-owned community
Home revenue
$20.5M
Profit
$745.8K
Privately-owned community
Home revenue
$20,549,692.00
Profit
$745,770.00
Payroll costs Info The portion of the home's budget spent on staff, including nurses, caregivers, and other employees who support care and operations.
$7.5M
36.5% of revenue
Other operating costs Info All remaining costs needed to run the home, such as food, utilities, building maintenance, supplies and administrative expenses.
$12.3M
Total costs $19.8M
Bed community size
100-bed community
A larger shared setting that may offer more common spaces and organized community services.
Years in operation
24 years in operation
A longer operating history, which may indicate experience navigating regulations and delivering ongoing care.
Walk Score
Walk Score: 17 / 100
Car-dependent. Most errands require a car, with limited nearby walkable options.
BBB Rating
BBB Rating: A+ (Accredited)
An independent rating from the Better Business Bureau based on factors such as complaint history, transparency, and business practices.
How BBB ratings work

About this community

License details

Facility type
Community Residential Care Facilities
Status Active
Expiration October 31, 2026
County: Charleston

Additional licensing details

License number: CRC-1064
CMS Certification Number: 425332

Ownership & operating entity

The Bridge at Charleston is legally operated by CHARLESTON RETIREMENT INVESTORS LLC, and administrated by DAUGHERTY, KATHERYN G..

Ownership type: Ltd. Liability

Staffing

Key information about the people who lead and staff this community.

Leadership

Contact: Mr. Kurt Blalock, COO

Care Services

Offers Alzheimer's Care
Dedicated Alzheimer's Unit

Contact Information

What does this home offer?

Pets allowed icon
Pets allowed icon

Pets Allowed: Yes, Pets Allowed

Housing options icon

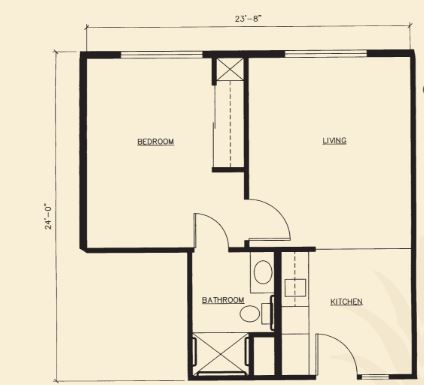
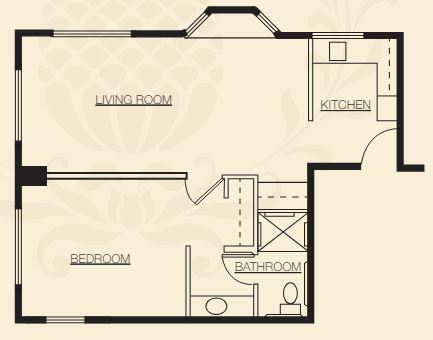
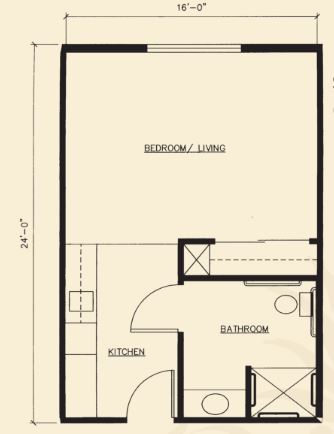
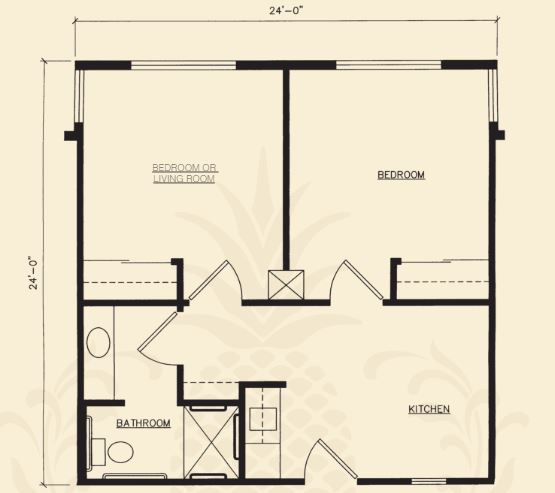
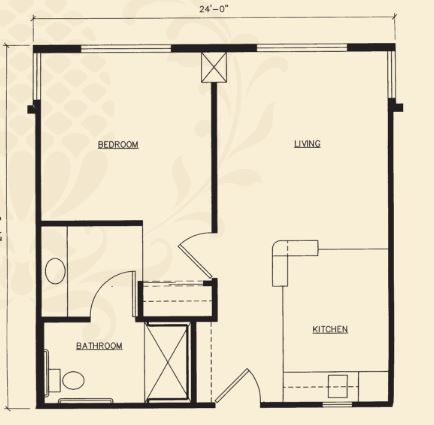
Housing Options: Studio / 1 Bed

Building type icon
Building type icon

Building Type: Two-story

Transportation services icon

Transportation Services

Fitness and recreation icon

Fitness and Recreation
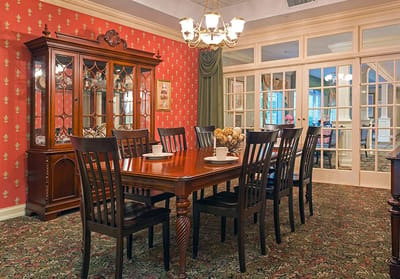
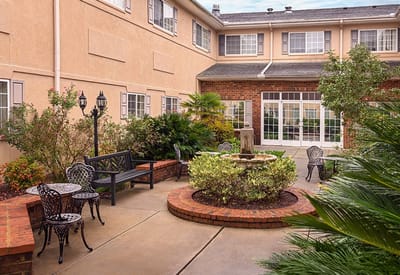
Types of Care at The Bridge at Charleston

Assisted Living
Contact The Bridge at Charleston

Health Inspection History

Inspections
Total health inspections 3

South Carolina average 3.9


Last Health inspection on Dec 2024

Total health citations 9
Citations per inspection
3

Health citations are formal notices following inspections when they fail to comply with safety and care standards.

8 of 9 citations resulted from standard inspections; and 1 of 9 resulted from complaint investigations.

Breakdown of citation severity (last 3 years)
Critical Health citations More info 2
100% worse than South Carolina average

South Carolina average: 1


Serious Health citations More info 0
100% better than South Carolina average

South Carolina average: 0.3

2 critical citations More info South Carolina average: 1

0 serious citations More info South Carolina average: 0.3

7 moderate citations More info South Carolina average: 12.3

0 minor citations More info South Carolina average: 0.1
Citations history (last 3 years)
Nutrition moderate citation Dec 20, 2024
Corrected

Pharmacy moderate citation Dec 20, 2024
Corrected

Pharmacy moderate citation Dec 20, 2024
Corrected

Pharmacy moderate citation Dec 20, 2024
Corrected

Compare Assisted Living around Charleston

The information below is reported by the South Carolina Department of Public Health, Bureau of Healthcare Quality.
The Bridge at Charleston
SNF

Nursing Home 24/7 care needed

AL

Assisted Living For seniors needing help with daily tasks but not full-time nursing.

Charleston
148
Yes
A+
17
Studio / 1 Bed
Oaks at Charleston
AL

Assisted Living For seniors needing help with daily tasks but not full-time nursing.

MC

Memory Care Specialized care for those with Memory Loss, Alzheimer's, or dementia, ensuring safety and support.

RC

Respite Care

Charleston (West Ashley)
123
Yes
-
53
Studio / 1 Bed
Dayspring Assisted Living of Johns Island
AL

Assisted Living For seniors needing help with daily tasks but not full-time nursing.

Johns Island
24
No
-
2
Studio / 1 Bed
Dayspring Assisted Living of Hollywood
AL

Assisted Living For seniors needing help with daily tasks but not full-time nursing.

Hollywood
-
No
-
1
Studio / 1 Bed
Maria‘s Priority Care
AL

Assisted Living For seniors needing help with daily tasks but not full-time nursing.

Charleston
-
No
-
65
Studio / 1 Bed

Living Spaces & Floor Plans

The Bridge At Charleston 1 Bed B
The Bridge At Charleston 1 Bed
The Bridge At Charleston Studio
The Bridge At Charleston 1 Bed D
The Bridge At Charleston 1 Bed C

Places of interest near The Bridge at Charleston

Address 17.9 miles from city center — 2.95 miles to nearest hospital (Center For Occupational & Environmental Medicine (COEM))

Address 2590 Elms Plantation Blvd, Charleston, SC 29406

Calculate Travel Distance to The Bridge at Charleston

Add your location

Address

Staffing Data

Source: CMS Payroll-Based Journal (Q2 2025)

142
Total Staff
138
Employees
4
Contractors
43,016
Total Hours (Quarter)
57
Avg Staff/Day
8.3
Avg Shift (hrs)
Nursing Staff Breakdown
Role Count Avg Shift (hrs) Uses Contractors?
Registered Nurse1110.8 No
Licensed Practical Nurse369.2 No
Certified Nursing Assistant498.6 No
Staff by Category
Administration
2 staff
8.5hs shift avg
Nursing Staff
98 staff
8.9hs shift avg
Physicians & Practitioners
6 staff
7.9hs shift avg
Therapy Services
26 staff
7.1hs shift avg
Activities & Recreation
1 staff
7.7hs shift avg
Social Services
4 staff
7hs shift avg
Dietary Services
3 staff
7.1hs shift avg
Other Services
2 staff
7.5hs shift avg
Contractor Analysis
0.8%
of total hours from contractors
358 contractor hours this quarter
Occupational Therapy Aide: 1 Occupational Therapy Assistant: 2 Medical Director: 1
Role Employees Contractors Total Staff Total Hours Days Worked % of Days Avg Shift (hrs)
Certified Nursing Assistant4904917,59491100%8.6
Licensed Practical Nurse3603610,66991100%9.2
Physical Therapy Assistant5052,1777481%7.8
Registered Nurse110111,9028593%10.8
Clinical Nurse Specialist5051,7537582%7.9
Respiratory Therapy Technician8081,6677785%7
Qualified Social Worker4041,1167178%7
Speech Language Pathologist3039197077%6.8
Other Dietary Services Staff2028778189%7
Occupational Therapy Aide1126315965%7.6
RN Director of Nursing2025245965%7.8
Administrator1015206571%8
Nurse Practitioner1014725965%8
Dental Services Staff1014645864%8
Therapeutic Recreation Specialist1014626066%7.7
Physical Therapy Aide6064305965%5.1
Dietitian1013855257%7.4
Mental Health Service Worker1013164651%6.9
Occupational Therapy Assistant0228089%10.1
Medical Director0115733%19

Facility Characteristics

Source: CMS Long-Term Care Facility Characteristics (Data as of Jan 2026)

Total census
119 residents
Residents by payment source
Medicare
23 residents (19.3%)
Medicaid
55 residents (46.2%)
Private pay or other
41 residents (34.5%)
Programs & Services
Residents' Group

Residents meet regularly to discuss policies, care quality, and activities

Nurse Aide Training

State-approved Nurse Aide Training and Competency Evaluation Program on-site

CCRC

Part of a Continuing Care Retirement Community offering multiple care levels

Active Resident Council

Organized group of residents that meets regularly to discuss facility policies, quality of life, and activities.

Quality of care over time

These measures show how residents usually do over time at this home, based on health outcomes and preventive care.

High-risk clinical events score Info A composite score based on pressure ulcers, falls with injury, weight loss, walking ability decline, and activities of daily living decline. 3.0
66% better than South Carolina average

South Carolina average: 8.7

Functional decline score Info A composite score based on activities of daily living decline, walking ability decline, and incontinence. 8.9
43% better than South Carolina average

South Carolina average: 15.5

Long-stay resident measures
Need for Help with Daily Activities Increased Info Percent of long-stay residents whose need for help with daily activities has increased 1.8%
86% better than South Carolina average

South Carolina average: 13.1%

Walking Ability Worsened Info Percent of long-stay residents whose ability to move independently worsened 3.3%
79% better than South Carolina average

South Carolina average: 16.2%

Low Risk Residents with Bowel/Bladder Incontinence Info Percent of low risk long-stay residents who lose control of their bowels or bladder 21.5%
26% worse than South Carolina average

South Carolina average: 17.0%

Falls with Major Injury Info Percent of long-stay residents experiencing one or more falls with major injury 0.7%
78% better than South Carolina average

South Carolina average: 3.0%

High Risk Residents with Pressure Ulcers Info Percent of long-stay high risk residents with pressure ulcers 3.8%
38% better than South Carolina average

South Carolina average: 6.1%

Urinary Tract Infection Info Percent of long-stay residents with a urinary tract infection 0.7%
60% better than South Carolina average

South Carolina average: 1.6%

Lost Too Much Weight Info Percent of long-stay residents who lose too much weight 5.4%
12% better than South Carolina average

South Carolina average: 6.2%

Depressive Symptoms Info Percent of long-stay residents who have depressive symptoms 0.3%
88% better than South Carolina average

South Carolina average: 2.8%

Antipsychotic Use Info Percent of long-stay residents who received an antipsychotic medication 4.5%
69% better than South Carolina average

South Carolina average: 14.5%

Pneumococcal Vaccine Info Percent of long-stay residents assessed and appropriately given the pneumococcal vaccine 93.5%
In line with South Carolina average

South Carolina average: 90.5%

Influenza Vaccine Info Percent of long-stay residents assessed and appropriately given the seasonal influenza vaccine 80.5%
11% worse than South Carolina average

South Carolina average: 90.6%

Short-stay resident measures
Pneumococcal Vaccine Info Percent of short-stay residents assessed and appropriately given the pneumococcal vaccine 43.9%
45% worse than South Carolina average

South Carolina average: 79.5%

Antipsychotic medication increase Info Percent of short-stay residents who newly received an antipsychotic medication 1.5%
13% better than South Carolina average

South Carolina average: 1.7%

Influenza Vaccine Info Percent of short-stay residents assessed and appropriately given the seasonal influenza vaccine 40.8%
48% worse than South Carolina average

South Carolina average: 78.0%

Penalties and fines

Federal penalties imposed by CMS for regulatory violations, including civil money penalties (fines) and denials of payment for new Medicare/Medicaid admissions.

Source: CMS Penalties Database (Data as of Jan 2026)

Total fines amount $24K
28% lower than South Carolina average

South Carolina average: $34K

Number of fines 2
18% fewer fines than South Carolina average

South Carolina average: 2.4

Payment Denials Info Serious action where Medicare and/or Medicaid temporarily stops payments for new residents until issues are fixed. 0
100% fewer payment denials than South Carolina average

South Carolina average: 0.1

Fines amount comparison
This facility $24K
South Carolina average $34K
Penalty History

Penalties are imposed by CMS for violations of federal nursing home regulations.

Civil Money Penalty Info Fines imposed for noncompliance, which can be assessed per day or per instance of violation. Dec 20, 2024
$17K
Civil Money Penalty Info Fines imposed for noncompliance, which can be assessed per day or per instance of violation. Sep 1, 2023
$7K

Last updated: Jan 2026

Guides for Better Senior Living

Care Cost Calculator: See Prices in Your Area

Nursing Home Data Explorer

Don’t Wait Too Long: 7 Red Flag Signs Your Parent Needs Assisted Living Now

The True Cost of Assisted Living in 2025 – And How Families Are Paying For It

Understanding Senior Living Costs: Pricing Models, Discounts & Financial Assistance

Financial Aid for South Carolina Seniors

Get financial aid guidance

Community Long Term Care (CLTC)

SC Medicaid CLTC

Age 65+ or disabled, South Carolina resident, Medicaid-eligible, nursing home-level care need.

~$2,829/month (300% FBR, individual).

$2,000 (individual), $3,000 (couple).

High rural demand; waitlists possible.

South Carolina Respite Care Program

SC NFCSP Respite

Caregiver of someone 60+ (or with dementia), South Carolina resident.

No strict limit; prioritizes low-income.

Not applicable.

Limited slots; rural/urban balance.

Medicare Savings Program (MSP)

South Carolina Medicare Savings Program

Age 65+ or disabled, SC resident, Medicare Part A/B.

~$2,510/month (QMB), ~$3,380/month (SLMB), ~$3,598/month (QI)—individual.

$9,430 (individual), $14,130 (couple).

Three tiers; includes Extra Help for Part D; no waitlist.

Low-Income Home Energy Assistance Program (LIHEAP)

South Carolina LIHEAP

Age 60+ prioritized, SC resident, low-income household.

~$3,970/month (individual, 185% FPL).

Not assessed; income-focused.

Covers gas, electric, oil; emergency aid via ECAP (~$500 max).

Senior Community Service Employment Program (SCSEP)

South Carolina SCSEP

Age 55+, unemployed, low-income, SC resident.

~$1,983/month (125% FPL).

Not specified; income-focused.

Priority for veterans, rural residents; Goodwill/AARP partnership.

VA Aid and Attendance (A&A) and Housebound Benefits

South Carolina VA Aid and Attendance/Housebound

Age 65+ or disabled veteran/spouse, SC resident, wartime service, need for ADL help (A&A) or homebound.

Net income < ~$1,984/month (veteran with dependent, A&A); pension offsets income.

~$155,356 (net worth limit).

High veteran population; supports rural/urban care needs.

Senior Farmers’ Market Nutrition Program (SFMNP)

South Carolina SFMNP

Age 60+, SC resident, low-income.

~$2,322/month (individual, 185% FPL).

Not assessed.

Vouchers (~$50/season); serves ~20,000 annually via 10 AAAs.

Homestead Exemption Program

South Carolina Homestead Exemption

Age 65+ (or disabled/blind), SC resident 1+ year, homeowner.

None; tax-based eligibility.

Not assessed; home-focused.

Saves ~$500-$1,000/year avg.; applies to primary residence.

Elderly Simplified Application Project (ESAP)

South Carolina ESAP (SNAP for Seniors)

Age 60+, SC resident, no earned income, not on SCCAP.

~$1,732/month (133% FPL, individual).

$4,250 (individual, higher than standard SNAP).

Simplified process; serves ~50,000 seniors annually.

Tour Icon
Planning a tour? Check our touring checklist.
Chat Icon
Thinking of living here? We can help you speak to a current resident