Explore Open Rooms

1 Contact details
2 What type of senior care service are you looking for?
3 What budget do you have in mind for senior care?
4 How soon do you need to find care?
5 Additional details

Thank you for your interest!

Our team will be in touch shortly to help with next steps.

Assisted Living in Hamilton County

CMS overall rating Info The Overall CMS Rating combines results from health inspections, staffing levels and quality measures. Health inspections carry the most weight. Staffing and quality scores can increase or decrease the final rating based on performance compared to state and national standards.

The Bridge at Ooltewah

5901 Snow Hill Rd, Ooltewah, TN 37363 View map
Overview of The Bridge at Ooltewah

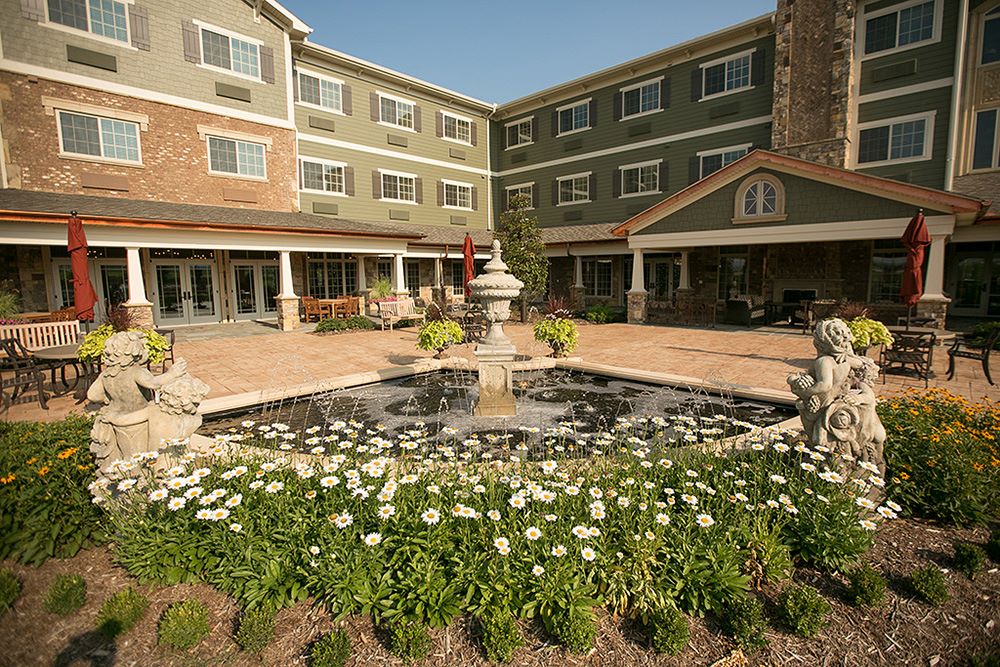
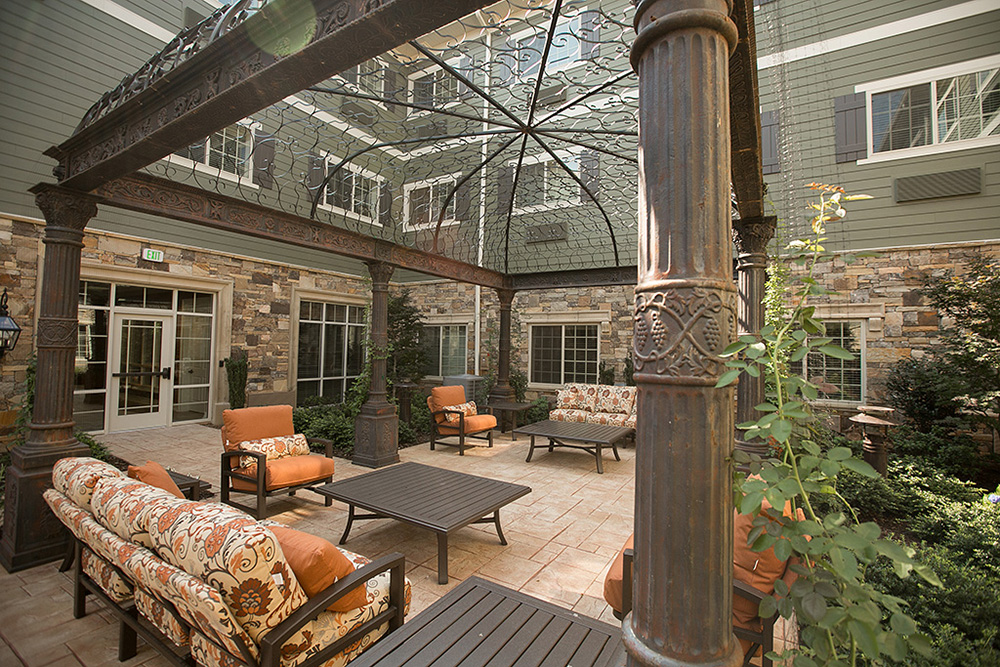
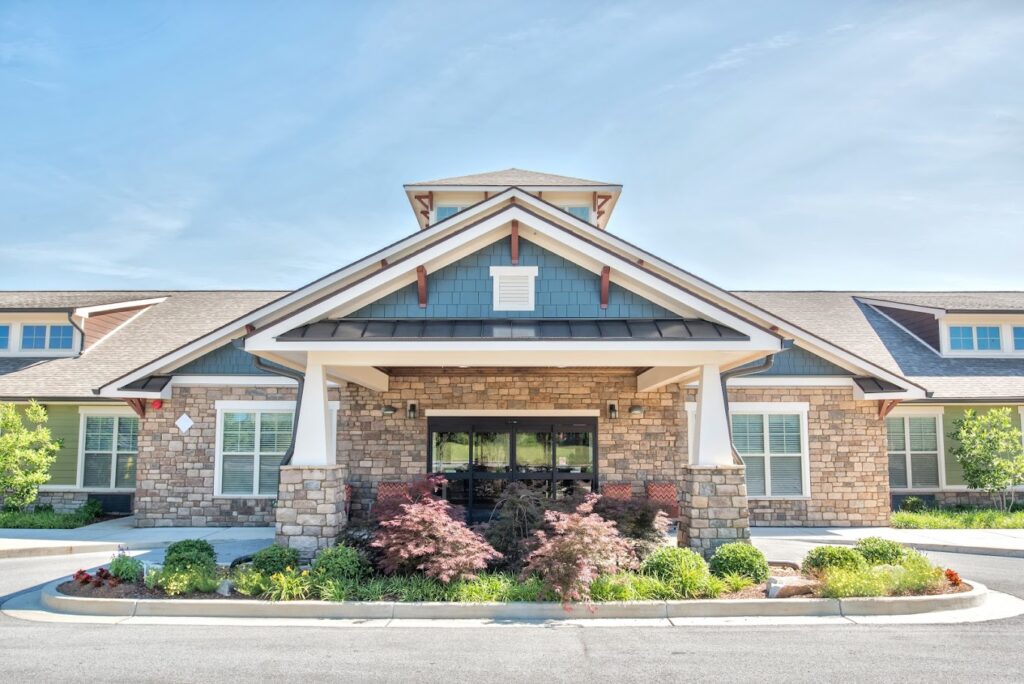
The Bridge at Ooltewah is a distinct senior living community situated in the quiet lands of Snow Hill Road, Ooltewah, TN, which provides assisted living. Enjoy every minute of your best years while resting in the peaceful and welcoming residences of the community in a selection of 15 well-designed floor plans. With a respectful and specially trained team lending extra hands around the clock, seniors let go of their worries and lead an inspiring life.

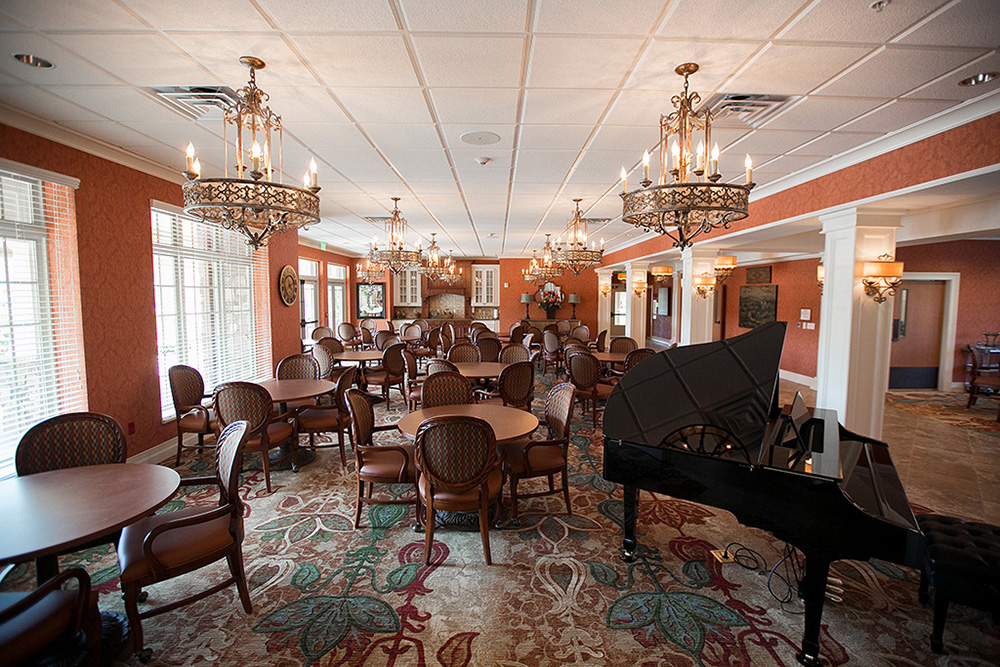
Learn new things and gain meaningful experiences through exciting programs and enriching activities. Indulge in fine dining options and satiate your cravings with delicious and healthy meals. Brimming with friendly spaces and a warm community, The Bridge at Ooltewah is great for seniors aiming to optimize their freedom while staying engaged with their surroundings.

(423) 760-8540

Quality ratings

Measured by Centers for Medicare & Medicaid Services (CMS)

Overall rating Info The Overall CMS Rating combines results from health inspections, staffing levels and quality measures. Health inspections carry the most weight. Staffing and quality scores can increase or decrease the final rating based on performance compared to state and national standards.
4/5
Tennessee average: 3.1/5
Health Inspection Info Based on the results of the facility's three most recent standard inspections and any complaint investigations. CMS reviews the number, scope, and severity of deficiencies, with more recent findings weighted more heavily.
4/5
Tennessee average: 2.9/5
Staffing Info Measures average nursing staff hours per resident per day, including Registered Nurses (RNs) and total nursing staff. Ratings are adjusted based on the level of care residents require and are compared to state and national benchmarks.
3/5
Tennessee average: 2.5/5
Quality Measures Info Based on clinical and physical health indicators reported to CMS, such as hospital readmissions, falls, pressure ulcers, and improvements in mobility. These measures reflect how well residents' health needs are being managed.
4/5
Tennessee average: 3.7/5

Nursing care per resident

Info This shows how many total hours of nursing staff time are available per resident each day. Higher numbers usually mean more staff support.
3h 35m per day

This home provides 2% less nursing time per resident than the Tennessee average.

Tennessee average: 3h 40m per day

Capacity and availability

Medium-capacity home

Offers a balance of services and community atmosphere.

Total beds 108

This home usually has availability

Lower occupancy suggests more openings may be available.

Lower demand than the Tennessee average
Occupancy rate 60%
Residents per day (avg) 81
Occupancy rate
60%
Residents per day (avg)
81

Who this home usually serves

TYPE OF STAY

Mix of rehab and long-term care

This home supports both short-term rehab and long-term care, with residents staying for a wide range of durations.

Breakdown by payment type

Medicare

43% of new residents, usually for short-term rehab.

Typical stay 1 months

Private pay

57% of new residents, often for short stays.

Typical stay 1 months

Finances and operations

Privately-owned community
Home revenue
$18.4M
Profit
$133.6K
Privately-owned community
Home revenue
$18,401,265.00
Profit
$133,639.00
Payroll costs Info The portion of the home's budget spent on staff, including nurses, caregivers, and other employees who support care and operations.
$6.6M
35.8% of revenue
Other operating costs Info All remaining costs needed to run the home, such as food, utilities, building maintenance, supplies and administrative expenses.
$11.7M
Total costs $18.3M
Bed community size
108-bed community
A larger shared setting that may offer more common spaces and organized community services.
Years in operation
25 years in operation
A longer operating history, which may indicate experience navigating regulations and delivering ongoing care.
Walk Score
Walk Score: 40 / 100
Somewhat walkable. A few nearby services may be reachable on foot, but most trips require transportation.
BBB Rating
BBB Rating: A+ (Accredited)
An independent rating from the Better Business Bureau based on factors such as complaint history, transparency, and business practices.
How BBB ratings work

About this community

Occupancy

Occupancy rate
94%
32% higher than Tennessee average

Tennessee average: 72%

Occupied beds
102 / 108
Average residents 82 per day

License Details

Facility TypeAssisted Care Living Facility
StatusLicensed
IssuanceJuly 31, 2014
ExpirationJuly 31, 2026
CountyHamilton

Additional Licensing Details

License Number00000381
CMS Certification Number445511

Ownership & Operating Entity

The Bridge at Ooltewah is legally operated by Ooltewah ALF Investors, LLC, and administrated by Caleb Lee.

Staffing

Key information about the people who lead and staff this community.

Leadership

ContactMr. Caleb Lee, Executive Director

What does this home offer?

Building type icon
Building type icon

Building Type: 3-story

Transportation services icon

Transportation Services

Fitness and recreation icon

Fitness and Recreation

Types of Care at The Bridge at Ooltewah

Assisted Living
Contact The Bridge at Ooltewah

Residents information

Stay stats

Average length of stay
84 days
Total residents
116
Total admissions (2024)
33
Total discharges (2024)
37

Discharges

  • To hospital 21
  • Deceased 16

Demographics

GENDER

  • Female Residents 65.5%
  • Male Residents 34.5%

AGE DISTRIBUTION

  • Under 60 1.7%
  • 65-69 4.3%
  • 70-74 13.8%
  • 75-79 41.4%
  • 80-84 31%
  • 85-89 6.9%
  • 90 or more 0.9%

ETHNICITY

  • Black Residents 0.9%
  • White Residents 99.1%

Inspection History

In Tennessee, the Department of Health, Division of Health Care Facilities performs unannounced inspections and investigations to ensure facilities provide high-quality resident care.

Health Inspection History

Inspections
Total health inspections 3

Tennessee average 3.5


Last Health inspection on Dec 2022

Total health citations 6

Tennessee average 15.4

Citations per inspection
2

Tennessee average 4.39


Health citations are formal notices following inspections when they fail to comply with safety and care standards.

All 6 citations resulted from standard inspections.

Breakdown of citation severity (last 3 years)
Critical Health citations More info 0
100% better than Tennessee average

Tennessee average: 1.1


Serious Health citations More info 0
100% better than Tennessee average

Tennessee average: 0.6

0 critical citations More info Tennessee average: 1.1

0 serious citations More info Tennessee average: 0.6

6 moderate citations More info Tennessee average: 13.7

0 minor citations More info Tennessee average: 0.1
Citations history (last 3 years)
Quality of Care moderate citation Info Issues related to how well residents receive appropriate treatment and support for their medical and daily care needs. Dec 14, 2022
Corrected

Quality of Care moderate citation Info Issues related to how well residents receive appropriate treatment and support for their medical and daily care needs. Dec 14, 2022
Corrected

Care Planning moderate citation Info Issues related to creating and updating personalized care plans for residents based on their needs and conditions. Dec 14, 2022
Corrected

Care Planning moderate citation Info Issues related to creating and updating personalized care plans for residents based on their needs and conditions. Sep 25, 2019
Corrected

Compare Assisted Living around Hamilton County The information below is reported by the Tennessee Department of Health, Division of Health Care Facilities.

Filter by care type
The Bridge at Ooltewah
NH

Nursing Home Licensed facility providing 24/7 skilled nursing care for residents with complex, ongoing medical needs. Staffed by RNs, LPNs, and CNAs. Inspected and star-rated annually by CMS. Accepts Medicare (short-term rehab) and Medicaid (long-term care).

AL

Assisted Living A licensed, long-term care setting for seniors or individuals with disabilities who need help with daily activities — like bathing, dressing, and medication management — but not 24-hour skilled nursing. Offers housing, meals, and around-the-clock support while aiming to maximize resident independence.

Ooltewah (Mill Run)
120
No
40
25
60.0%
A+
Caleb Lee
Ooltewah Alf Investors, Llc
84 days
Dominion Senior Living of Hixson
AL

Assisted Living A licensed, long-term care setting for seniors or individuals with disabilities who need help with daily activities — like bathing, dressing, and medication management — but not 24-hour skilled nursing. Offers housing, meals, and around-the-clock support while aiming to maximize resident independence.

Hixson (Hixson)
67
No
41
9
92.5%
A+
Chester Matheny
Dominion Of Chattanooga Opco, Llc
522 days
The Rosewood at Fort Oglethorpe
AL

Assisted Living A licensed, long-term care setting for seniors or individuals with disabilities who need help with daily activities — like bathing, dressing, and medication management — but not 24-hour skilled nursing. Offers housing, meals, and around-the-clock support while aiming to maximize resident independence.

Fort Oglethorpe
60
Yes
46
21
-
A+
Mr Gregory Pflug
-
-
Regency House Assisted Living
AL

Assisted Living A licensed, long-term care setting for seniors or individuals with disabilities who need help with daily activities — like bathing, dressing, and medication management — but not 24-hour skilled nursing. Offers housing, meals, and around-the-clock support while aiming to maximize resident independence.

Hixson (Hixson)
54
Yes
36
26
77.8%
-
Kelli Melia Harless
Chattanooga Sh Operations, Llc
229 days
Regency Senior Living
AL

Assisted Living A licensed, long-term care setting for seniors or individuals with disabilities who need help with daily activities — like bathing, dressing, and medication management — but not 24-hour skilled nursing. Offers housing, meals, and around-the-clock support while aiming to maximize resident independence.

Collegedale
-
No
16
-
-
-
-
-
-

Places of interest near The Bridge at Ooltewah

Address 3.6 miles from city center

Address 5901 Snow Hill Rd, Ooltewah, TN 37363

Calculate Travel Distance to The Bridge at Ooltewah

Add your location

Address

Staffing Data (Q2 2025)

This data corresponds to Q2 2025 and is based on CMS Payroll-Based Journal.

Total staff 149
Employees 141
Contractors 8
Staff to resident ratio 2.13:1
19% better than Tennessee average

Tennessee average ratio: 1.79:1

Avg staff/day 58
Average shift 8.3 hours
0% compared with Tennessee average

Tennessee average: 8.3 hours

Total staff hours (quarter) 43,715
Nursing staff breakdown
Registered Nurse

Manages medical care and health needs.

Total count 23
Average shift length Info Average shift length. Calculated as total hours divided by days worked and average staff per day. 8.4 hours

No contractors work on this role.

Licensed Practical Nurse

Assists with medical care and medications.

Total count 15
Average shift length Info Average shift length. Calculated as total hours divided by days worked and average staff per day. 8.9 hours

No contractors work on this role.

Certified Nursing Assistant

Helps with daily care and mobility.

Total count 49
Average shift length Info Average shift length. Calculated as total hours divided by days worked and average staff per day. 8.9 hours

No contractors work on this role.

Contractor staffing

Total hours from contractors

0.8%

338 contractor hours this quarter

Occupational Therapy Aide: 4 Occupational Therapy Assistant: 3 Other Physician: 1
Staff by category
Certified Nursing Assistant4904916,48891100%8.9
Licensed Practical Nurse150155,16591100%8.9
Registered Nurse230234,75991100%8.4
Speech Language Pathologist8082,3188897%7.3
Respiratory Therapy Technician7072,1218088%7.5
Physical Therapy Aide5052,0676571%7.6
Clinical Nurse Specialist4041,8107380%8.5
Qualified Social Worker6061,4966875%7.3
Physical Therapy Assistant6061,3717380%7.3
RN Director of Nursing2021,1497582%9.1
Dental Services Staff2028556774%7.7
Therapeutic Recreation Specialist2028456571%7.6
Dietitian1015426673%8.2
Administrator1015206571%8
Mental Health Service Worker1015046066%8.4
Other Dietary Services Staff2024725864%8.1
Nurse Aide in Training6064623943%8.4
Nurse Practitioner1014355459%8.1
Occupational Therapy Aide0442615459%3.5
Occupational Therapy Assistant0334244%10.5
Other Physician0113533%11.5
49 Certified Nursing Assistant
% of Days 100%
15 Licensed Practical Nurse
% of Days 100%
23 Registered Nurse
% of Days 100%
8 Speech Language Pathologist
% of Days 97%
7 Respiratory Therapy Technician
% of Days 88%
5 Physical Therapy Aide
% of Days 71%
4 Clinical Nurse Specialist
% of Days 80%
6 Qualified Social Worker
% of Days 75%
6 Physical Therapy Assistant
% of Days 80%
2 RN Director of Nursing
% of Days 82%
2 Dental Services Staff
% of Days 74%
2 Therapeutic Recreation Specialist
% of Days 71%
1 Dietitian
% of Days 73%
1 Administrator
% of Days 71%
1 Mental Health Service Worker
% of Days 66%
2 Other Dietary Services Staff
% of Days 64%
6 Nurse Aide in Training
% of Days 43%
1 Nurse Practitioner
% of Days 59%
4 Occupational Therapy Aide
% of Days 59%
3 Occupational Therapy Assistant
% of Days 4%
1 Other Physician
% of Days 3%

Facility Characteristics

Source: CMS Long-Term Care Facility Characteristics (Data as of Jan 2026)

Total census
70 residents
Residents by payment source
Medicare
16 residents (22.9%)
Private pay or other
54 residents (77.1%)
Programs & Services
Residents' Group

Residents meet regularly to discuss policies, care quality, and activities

Active Resident Council

Organized group of residents that meets regularly to discuss facility policies, quality of life, and activities.

Quality of care over time

These measures show how residents usually do over time at this home, based on health outcomes and preventive care.

High-risk clinical events score Info A composite score based on pressure ulcers, falls with injury, weight loss, walking ability decline, and activities of daily living decline. 9.5
10% better than Tennessee average

Tennessee average: 10.5

Functional decline score Info A composite score based on activities of daily living decline, walking ability decline, and incontinence. 11.7
40% better than Tennessee average

Tennessee average: 19.5

Long-stay resident measures
Need for Help with Daily Activities Increased Info Percent of long-stay residents whose need for help with daily activities has increased 6.7%
58% better than Tennessee average

Tennessee average: 16.0%

Walking Ability Worsened Info Percent of long-stay residents whose ability to move independently worsened 11.9%
45% better than Tennessee average

Tennessee average: 21.7%

Low Risk Residents with Bowel/Bladder Incontinence Info Percent of low risk long-stay residents who lose control of their bowels or bladder 16.4%
21% better than Tennessee average

Tennessee average: 20.7%

Falls with Major Injury Info Percent of long-stay residents experiencing one or more falls with major injury 2.4%
36% better than Tennessee average

Tennessee average: 3.7%

High Risk Residents with Pressure Ulcers Info Percent of long-stay high risk residents with pressure ulcers 25.3%
365% worse than Tennessee average

Tennessee average: 5.4%

Urinary Tract Infection Info Percent of long-stay residents with a urinary tract infection 0.8%
61% better than Tennessee average

Tennessee average: 2.1%

Lost Too Much Weight Info Percent of long-stay residents who lose too much weight 1.0%
84% better than Tennessee average

Tennessee average: 6.3%

Depressive Symptoms Info Percent of long-stay residents who have depressive symptoms 8.4%
24% better than Tennessee average

Tennessee average: 11.0%

Antipsychotic Use Info Percent of long-stay residents who received an antipsychotic medication 13.4%
19% better than Tennessee average

Tennessee average: 16.5%

Pneumococcal Vaccine Info Percent of long-stay residents assessed and appropriately given the pneumococcal vaccine 98.4%
9% better than Tennessee average

Tennessee average: 89.9%

Influenza Vaccine Info Percent of long-stay residents assessed and appropriately given the seasonal influenza vaccine 91.9%
In line with Tennessee average

Tennessee average: 94.5%

Short-stay resident measures
Pneumococcal Vaccine Info Percent of short-stay residents assessed and appropriately given the pneumococcal vaccine 96.7%
21% better than Tennessee average

Tennessee average: 79.7%

Antipsychotic medication increase Info Percent of short-stay residents who newly received an antipsychotic medication 2.0%
17% worse than Tennessee average

Tennessee average: 1.7%

Influenza Vaccine Info Percent of short-stay residents assessed and appropriately given the seasonal influenza vaccine 92.6%
16% better than Tennessee average

Tennessee average: 79.8%

Guides for Better Senior Living

Care Cost Calculator: See Prices in Your Area

Nursing Home Data Explorer

Don’t Wait Too Long: 7 Red Flag Signs Your Parent Needs Assisted Living Now

The True Cost of Assisted Living in 2025 – And How Families Are Paying For It

Understanding Senior Living Costs: Pricing Models, Discounts & Financial Assistance

Financial Aid for Tennessee Seniors

Get financial aid guidance

CHOICES Program

TN Medicaid CHOICES

Age 65+ or disabled, Tennessee resident, Medicaid-eligible, nursing home-level care need.

~$2,829/month (300% FBR, individual).

$2,000 (individual), $3,000 (couple).

Managed care model; high rural demand.

Tennessee Options for Community Living

TN Options

Age 60+, Tennessee resident, at risk of nursing home.

~$2,000/month (individual, varies).

$5,000 (individual).

Limited funding; rural/urban balance.

Medicare Savings Program (MSP)

Tennessee Medicare Savings Program

Age 65+ or disabled, TN resident, Medicare Part A/B.

~$2,510/month (QMB), ~$3,380/month (SLMB), ~$3,598/month (QI)—individual.

$9,430 (individual), $14,130 (couple).

Three tiers; includes Extra Help for Part D; no waitlist.

Low-Income Home Energy Assistance Program (LIHEAP)

Tennessee LIHEAP

Age 60+ prioritized, TN resident, low-income household.

~$3,970/month (individual, 185% FPL).

Not assessed; income-focused.

Covers gas, electric, propane; emergency aid available.

Family Caregiver Support Program (FCSP)

Tennessee Family Caregiver Support Program

Caregivers of 60+ needing care or 55+ caregivers of others; TN resident; functional needs (2+ ADLs).

No strict cap; prioritizes low-income (~$24,980/year).

Not assessed; need-based.

Includes grandparent caregivers; high rural demand.

Senior Community Service Employment Program (SCSEP)

Tennessee SCSEP

Age 55+, unemployed, low-income, TN resident.

~$1,983/month (125% FPL).

Not specified; income-focused.

Priority for veterans, rural residents; AARP/Goodwill partnership.

VA Aid and Attendance (A&A) and Housebound Benefits

Tennessee VA Aid and Attendance/Housebound

Age 65+ or disabled veteran/spouse, TN resident, wartime service, need for ADL help (A&A) or homebound.

Net income < ~$1,984/month (veteran with dependent, A&A); pension offsets income.

~$155,356 (net worth limit).

High veteran population; supports rural/urban care needs.

Elderly Nutrition Program

Tennessee Elderly Nutrition Program

Age 60+, TN resident; no income limit but prioritizes low-income.

None; donations encouraged.

Not assessed.

Serves ~50,000 annually; 200+ congregate sites plus Meals on Wheels.

Property Tax Relief Program

Tennessee Property Tax Relief Program

Age 65+, TN resident, homeowner/renter (or widow/er 50+, disabled 18+).

~$45,000/year (household, excludes half of Social Security).

Not assessed; income-focused.

Rebates up to $1,000; serves ~100,000 annually.

Tour Icon
Planning a tour? Check our touring checklist.
Chat Icon
Thinking of living here? We can help you speak to a current resident