Explore Open Rooms

1 Contact details
2 What type of senior care service are you looking for?
3 What budget do you have in mind for senior care?
4 How soon do you need to find care?
5 Additional details

Thank you for your interest!

Our team will be in touch shortly to help with next steps.

Nursing Home

The Center for Living and Rehabilitation

Nursing Home

The Center for Living and Rehabilitation

160 Hospital Dr, Bennington, VT 05201 View map
Overview of The Center for Living and Rehabilitation

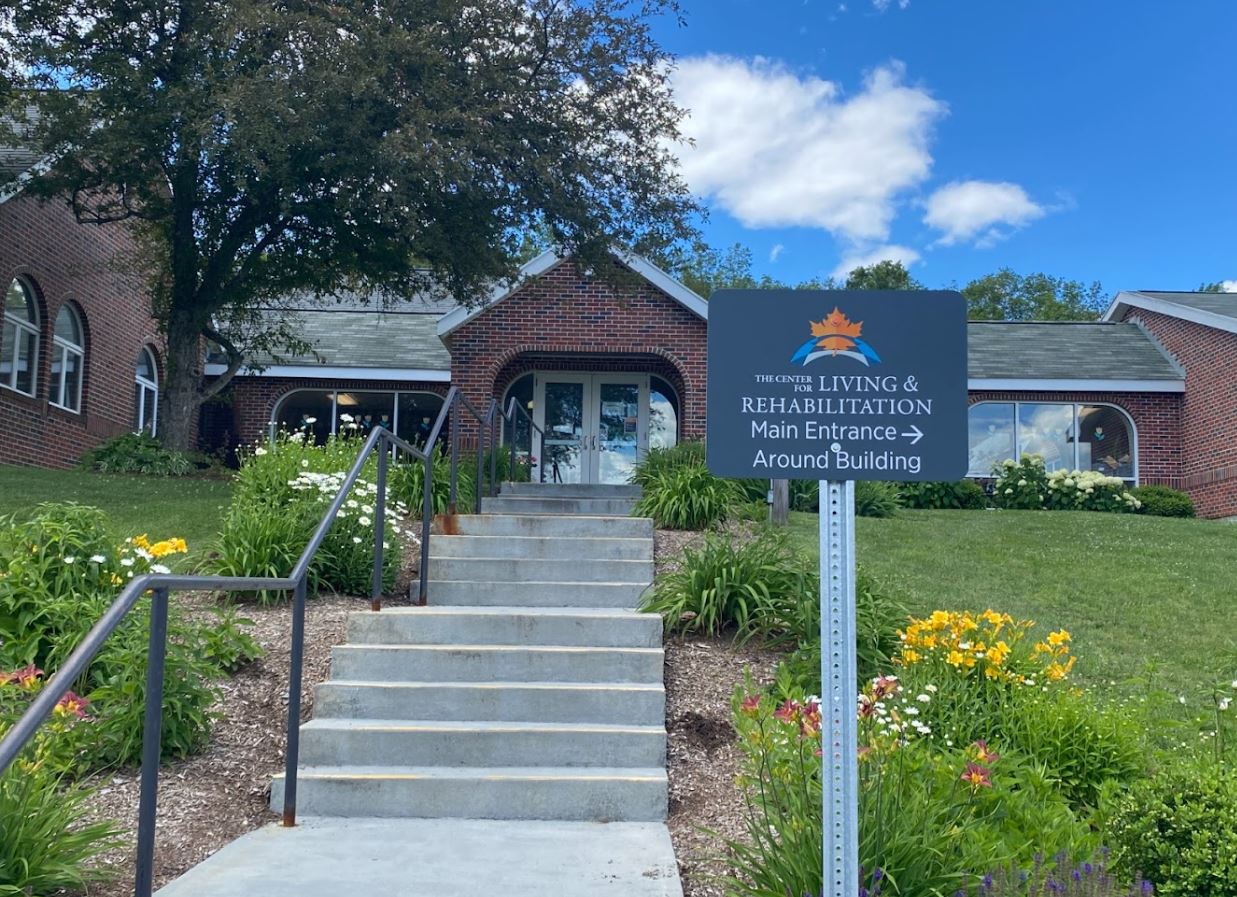
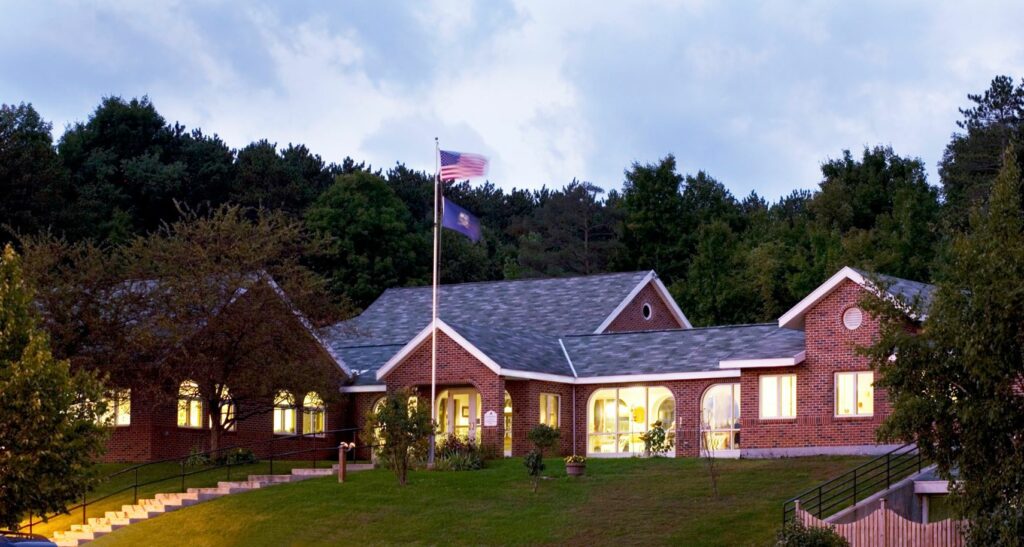
Situated in the vibrant and lush surroundings of Bennington, VT, The Center for Living and Rehabilitation is a trusted senior living community providing various care options including subacute rehabilitation, orthopedic, infectious disease, long-term, palliative, memory, and respite care. The community strives to provide the highest quality of care for seniors so they can jump back into their lives as soon as possible. A kind and compassionate team lends extra care and support around the clock to ensure residents thrive and reach their full potential.

Utilizing an innovative approach, the community ensures seniors receive the utmost medical assistance and unmatched comfort. Create unforgettable moments with friends and cherish personal time within the tranquil and stunning spaces of the community. With healthy and tasty meals, seniors can rest assured of meeting their dietary needs and tastes. The Center for Living and Rehabilitation is a safe place for seniors to spend their healing journey without worries.

(802) 447-1547

Quality ratings

Measured by Centers for Medicare & Medicaid Services (CMS)

Overall rating Info The Overall CMS Rating combines results from health inspections, staffing levels and quality measures. Health inspections carry the most weight. Staffing and quality scores can increase or decrease the final rating based on performance compared to state and national standards.
3/5
Vermont average: 2.6/5
Health Inspection Info Based on the results of the facility's three most recent standard inspections and any complaint investigations. CMS reviews the number, scope, and severity of deficiencies, with more recent findings weighted more heavily.
3/5
Vermont average: 2.6/5
Staffing Info Measures average nursing staff hours per resident per day, including Registered Nurses (RNs) and total nursing staff. Ratings are adjusted based on the level of care residents require and are compared to state and national benchmarks.
3/5
Vermont average: 3.1/5
Quality Measures Info Based on clinical and physical health indicators reported to CMS, such as hospital readmissions, falls, pressure ulcers, and improvements in mobility. These measures reflect how well residents' health needs are being managed.
4/5
Vermont average: 3.1/5

Nursing care per resident

Info This shows how many total hours of nursing staff time are available per resident each day. Higher numbers usually mean more staff support.
3h 56m per day

This home provides 7% less nursing time per resident than the Vermont average.

Vermont average: 4h 13m per day

Capacity and availability

Medium-capacity home

Offers a balance of services and community atmosphere.

Total beds 130

This home is often near full

That suggests steady demand, but availability may be limited.

Higher demand than most homes in Vermont
Occupancy rate 100.1%
Residents per day (avg) 122
Occupancy rate
100.1%
Residents per day (avg)
122

Who this home usually serves

TYPE OF STAY

Mostly short-term rehab stays

Most residents typically stay for a few weeks or months before returning home or moving on.

Might be optimal for
Short stays Recovery Medicare-covered care

Breakdown by payment type

Medicare

57% of new residents, usually for short-term rehab.

Typical stay 28 days

Private pay

43% of new residents, often for short stays.

Typical stay 5 months

Finances and operations

Privately-owned community
Operated by a partnership between two or more business owners.
Home revenue
$19.8M
Profit
$648.7K
Privately-owned community Operated by a partnership between two or more business owners.
Home revenue
$19,846,573.00
Profit
$648,740.00
Payroll costs Info The portion of the home's budget spent on staff, including nurses, caregivers, and other employees who support care and operations.
$6.4M
32.3% of revenue
Other operating costs Info All remaining costs needed to run the home, such as food, utilities, building maintenance, supplies and administrative expenses.
$12.7M
Total costs $19.2M
Walk Score
Walk Score: 13 / 100
Car-dependent. Most errands require a car, with limited nearby walkable options.

About this community

License details

Facility type
Nursing Home
County: Bennington

Care Services

Provides Memory Care

Contact Information

Fax: 802-447-5482

What does this home offer?

Housing options icon

Housing Options: Private Rooms / Semi-Private Rooms

Building type icon
Building type icon

Building Type: Single-story

Types of Care at The Center for Living and Rehabilitation

Nursing Home Memory Care Respite Care

Inspection History

In Vermont, the Department of Disabilities, Aging and Independent Living is the authority responsible for inspecting facilities and investigating complaints to protect resident well-being.

12 visits/inspections

6 visits/inspections triggered by complaints

1 routine inspections

Results

12 with issues

0 without issues

Latest inspection

Date:December 30, 2025
Type:Annual Inspection

51 deficiencies

Deficiencies indicate regulatory issues. A higher number implies the facility had several areas requiring improvement.

Health Inspection History

Inspections
Total health inspections 10

Vermont average 6.5


Last Health inspection on Aug 2025

Total health citations 39

Vermont average 28.9

Citations per inspection
3.9

Vermont average 4.31


Health citations are formal notices following inspections when they fail to comply with safety and care standards.

24 of 39 citations resulted from standard inspections; 14 of 39 resulted from complaint investigations; and 1 of 39 came from combined inspections (standard and complaint).

Breakdown of citation severity (last 3 years)
Critical Health citations More info 0
100% better than Vermont average

Vermont average: 0.7


Serious Health citations More info 0
100% better than Vermont average

Vermont average: 1.9

0 critical citations More info Vermont average: 0.7

0 serious citations More info Vermont average: 1.9

35 moderate citations More info Vermont average: 24.6

4 minor citations More info Vermont average: 1.5
Citations history (last 3 years)
Quality of Care moderate citation Info Issues related to how well residents receive appropriate treatment and support for their medical and daily care needs. Aug 28, 2025
Corrected

Quality of Care moderate citation Info Issues related to how well residents receive appropriate treatment and support for their medical and daily care needs. Jun 30, 2025
Corrected

Infection Control moderate citation Info Issues related to preventing and controlling infections, including hygiene practices and safety protocols. Apr 30, 2025
Corrected

Pharmacy moderate citation Info Issues related to medication management, including how drugs are stored, administered, and monitored. Apr 30, 2025
Corrected

Compare Nursing Homes around Bennington The information below is reported by the Vermont Department of Disabilities, Aging and Independent Living.

1 facility compared · CMS & VT Dept. of Health data · Updated Mar 2026

The Center for Living and Rehabilitation
NH

Nursing Home Licensed facility providing 24/7 skilled nursing care for residents with complex, ongoing medical needs. Staffed by RNs, LPNs, and CNAs. Inspected and star-rated annually by CMS. Accepts Medicare (short-term rehab) and Medicaid (long-term care).

Bennington (Bennington)
130
100.1%
+24%
3.93
-1%
-8%
0
39
0
122
13
Bn Member Llc
$19,5M
$6,4M
32.8%
475029
Private Rooms / Semi-Private Rooms

Places of interest near The Center for Living and Rehabilitation

Address 1.3 miles from city center

Address 160 Hospital Dr, Bennington, VT 05201

Calculate Travel Distance to The Center for Living and Rehabilitation

Add your location

Address

Staffing Data (Q2 2025)

This data corresponds to Q2 2025 and is based on CMS Payroll-Based Journal.

Total staff 180
Employees 138
Contractors 42
Staff to resident ratio 1.43:1
12% worse than Vermont average

Vermont average ratio: 1.63:1

Avg staff/day 73
Average shift 8.5 hours
0% compared with Vermont average

Vermont average: 8.2 hours

Total staff hours (quarter) 56,275
Nursing staff breakdown
Registered Nurse

Manages medical care and health needs.

Total count 21
Average shift length Info Average shift length. Calculated as total hours divided by days worked and average staff per day. 7.9 hours

This role is partially covered by contractors.

Licensed Practical Nurse

Assists with medical care and medications.

Total count 32
Average shift length Info Average shift length. Calculated as total hours divided by days worked and average staff per day. 9.7 hours

This role is partially covered by contractors.

Certified Nursing Assistant

Helps with daily care and mobility.

Total count 80
Average shift length Info Average shift length. Calculated as total hours divided by days worked and average staff per day. 8.9 hours

This role is partially covered by contractors.

Contractor staffing

Total hours from contractors

29.9%

16,846 contractor hours this quarter

Certified Nursing Assistant: 26 Licensed Practical Nurse: 13 Registered Nurse: 3
Staff by category
Certified Nursing Assistant54268025,56191100%8.9
Licensed Practical Nurse19133212,18591100%9.7
Registered Nurse183216,12891100%7.9
Physical Therapy Assistant4041,9687380%7.9
Other Dietary Services Staff110111,8779099%5.6
Respiratory Therapy Technician9091,6167886%6.4
Clinical Nurse Specialist5051,3766571%8
Speech Language Pathologist6061,1117481%7.2
Physical Therapy Aide2029607279%7.7
Administrator2029186571%7.6
Mental Health Service Worker2027476369%8
Qualified Social Worker2024866369%7.3
RN Director of Nursing1014505662%8
Occupational Therapy Aide1014165459%7.7
Nurse Practitioner1014005763%7
Dietitian101781011%7.8
80 Certified Nursing Assistant
% of Days 100%
32 Licensed Practical Nurse
% of Days 100%
21 Registered Nurse
% of Days 100%
4 Physical Therapy Assistant
% of Days 80%
11 Other Dietary Services Staff
% of Days 99%
9 Respiratory Therapy Technician
% of Days 86%
5 Clinical Nurse Specialist
% of Days 71%
6 Speech Language Pathologist
% of Days 81%
2 Physical Therapy Aide
% of Days 79%
2 Administrator
% of Days 71%
2 Mental Health Service Worker
% of Days 69%
2 Qualified Social Worker
% of Days 69%
1 RN Director of Nursing
% of Days 62%
1 Occupational Therapy Aide
% of Days 59%
1 Nurse Practitioner
% of Days 63%
1 Dietitian
% of Days 11%

Facility Characteristics

Source: CMS Long-Term Care Facility Characteristics (Data as of Jan 2026)

Total census
126 residents
Residents by payment source
Medicare
37 residents (29.4%)
Medicaid
67 residents (53.2%)
Private pay or other
22 residents (17.5%)
Programs & Services
Residents' Group

Residents meet regularly to discuss policies, care quality, and activities

Nurse Aide Training

State-approved Nurse Aide Training and Competency Evaluation Program on-site

Active Resident Council

Organized group of residents that meets regularly to discuss facility policies, quality of life, and activities.

Quality of care over time

These measures show how residents usually do over time at this home, based on health outcomes and preventive care.

High-risk clinical events score Info A composite score based on pressure ulcers, falls with injury, weight loss, walking ability decline, and activities of daily living decline. 7.3
37% better than Vermont average

Vermont average: 11.6

Functional decline score Info A composite score based on activities of daily living decline, walking ability decline, and incontinence. 15.4
32% better than Vermont average

Vermont average: 22.7

Long-stay resident measures
Need for Help with Daily Activities Increased Info Percent of long-stay residents whose need for help with daily activities has increased 4.6%
78% better than Vermont average

Vermont average: 20.4%

Walking Ability Worsened Info Percent of long-stay residents whose ability to move independently worsened 5.9%
70% better than Vermont average

Vermont average: 20.1%

Low Risk Residents with Bowel/Bladder Incontinence Info Percent of low risk long-stay residents who lose control of their bowels or bladder 35.7%
29% worse than Vermont average

Vermont average: 27.6%

Falls with Major Injury Info Percent of long-stay residents experiencing one or more falls with major injury 4.9%
16% better than Vermont average

Vermont average: 5.8%

High Risk Residents with Pressure Ulcers Info Percent of long-stay high risk residents with pressure ulcers 13.6%
113% worse than Vermont average

Vermont average: 6.4%

Urinary Tract Infection Info Percent of long-stay residents with a urinary tract infection 2.4%
6% better than Vermont average

Vermont average: 2.5%

Lost Too Much Weight Info Percent of long-stay residents who lose too much weight 7.5%
37% worse than Vermont average

Vermont average: 5.5%

Depressive Symptoms Info Percent of long-stay residents who have depressive symptoms 24.7%
146% worse than Vermont average

Vermont average: 10.0%

Antipsychotic Use Info Percent of long-stay residents who received an antipsychotic medication 16.5%
15% better than Vermont average

Vermont average: 19.4%

Pneumococcal Vaccine Info Percent of long-stay residents assessed and appropriately given the pneumococcal vaccine 98.9%
In line with Vermont average

Vermont average: 95.6%

Influenza Vaccine Info Percent of long-stay residents assessed and appropriately given the seasonal influenza vaccine 100.0%
In line with Vermont average

Vermont average: 97.6%

Short-stay resident measures
Pneumococcal Vaccine Info Percent of short-stay residents assessed and appropriately given the pneumococcal vaccine 86.7%
In line with Vermont average

Vermont average: 86.3%

Antipsychotic medication increase Info Percent of short-stay residents who newly received an antipsychotic medication 1.1%
37% better than Vermont average

Vermont average: 1.7%

Influenza Vaccine Info Percent of short-stay residents assessed and appropriately given the seasonal influenza vaccine 77.6%
In line with Vermont average

Vermont average: 78.9%

Guides for Better Senior Living

Care Cost Calculator: See Prices in Your Area

Nursing Home Data Explorer

Don’t Wait Too Long: 7 Red Flag Signs Your Parent Needs Assisted Living Now

The True Cost of Assisted Living in 2025 – And How Families Are Paying For It

Understanding Senior Living Costs: Pricing Models, Discounts & Financial Assistance

Financial Aid for Vermont Seniors

Get financial aid guidance

Choices for Care

VT Medicaid CFC

Age 65+ or disabled, Vermont resident, Medicaid-eligible, nursing home-level care need.

~$2,829/month (300% FBR, individual).

$2,000 (individual), $3,000 (couple).

Small state; rural access emphasis.

Vermont Assistive Community Care Services (ACCS)

VT ACCS

Age 65+, Vermont resident, in approved residential setting.

~$1,732/month (individual, varies).

$2,000 (individual).

Facility-based; limited funding.

Older Americans Act (OAA) Services

Vermont OAA Services

Age 60+, VT resident; no income/asset limits.

None; donations encouraged.

Not assessed.

5 AAAs (Age Well, CVCOA, NEKCOA, Senior Solutions, SVCOA); rural focus.

Medicare Savings Program (MSP)

Vermont Medicare Savings Program

Age 65+ or disabled, VT resident, Medicare Part A/B.

~$2,510/month (QMB), ~$3,380/month (SLMB), ~$3,598/month (QI)—individual.

$9,430 (individual), $14,130 (couple).

Includes Extra Help for Part D; no waitlist.

Fuel Assistance Program

Vermont Seasonal Fuel Assistance

Age 60+ prioritized, VT resident, low-income household.

~$3,970/month (185% FPL).

Not assessed.

Covers oil, gas, wood; emergency aid available.

Family Caregiver Support Program (FCSP)

Vermont Family Caregiver Support Program

Caregivers of 60+ needing care or 55+ caregivers of others; VT resident; 2+ ADLs.

No strict cap; prioritizes low-income (~$24,980/year).

Not assessed.

Includes grandparent caregivers; serves ~1,000 annually.

Senior Community Service Employment Program (SCSEP)

Vermont SCSEP

Age 55+, unemployed, low-income, VT resident.

~$1,983/month (125% FPL).

Not specified.

Priority for veterans, rural residents; AARP partnership.

VA Aid and Attendance (A&A) and Housebound Benefits

Vermont VA Aid and Attendance/Housebound

Age 65+ or disabled veteran/spouse, VT resident, wartime service, ADL help (A&A) or homebound.

Net income < ~$1,984/month (veteran with dependent, A&A); pension offsets income.

~$155,356 (net worth).

High rural veteran use; supports care costs.

Property Tax Adjustment Assistance

Vermont Property Tax Credit

Age 65+ (or all ages), VT resident, homeowner/renter, income-based.

~$47,000/year (household); caps credit at ~$128,000.

Not assessed.

Credits up to $8,000; serves ~20,000 households.

Commodity Supplemental Food Program (CSFP)

Vermont CSFP

Age 60+, VT resident, low-income.

~$1,632/month (130% FPL).

Not assessed.

Serves ~5,000 seniors via 50+ drop sites.

Attendant Services Program (ASP)

Vermont Attendant Services Program

Age 65+ (or disabled 18+), VT resident, severe/permanent disability, 2+ ADL needs.

Medicaid-eligible (~$2,829/month) or near-eligible for General Fund.

$2,000 (individual) for Medicaid; varies for General Fund.

Participants hire/manage caregivers; serves ~500 annually.