Explore Open Rooms

1 Contact details
2 What type of senior care service are you looking for?
3 What budget do you have in mind for senior care?
4 How soon do you need to find care?
5 Additional details

Thank you for your interest!

Our team will be in touch shortly to help with next steps.

Senior Living Home

The Suites at Someren Glen

Senior Living Home

The Suites at Someren Glen

5000 E Arapahoe Rd, Centennial, CO 80122 View map
Overview of The Suites at Someren Glen

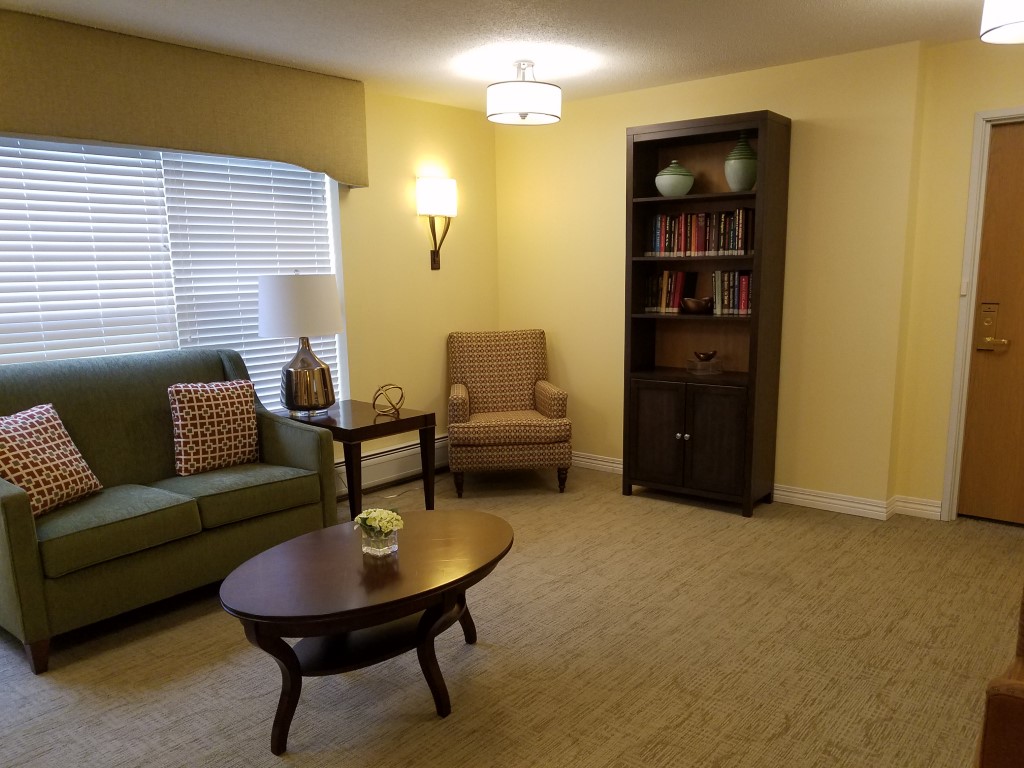
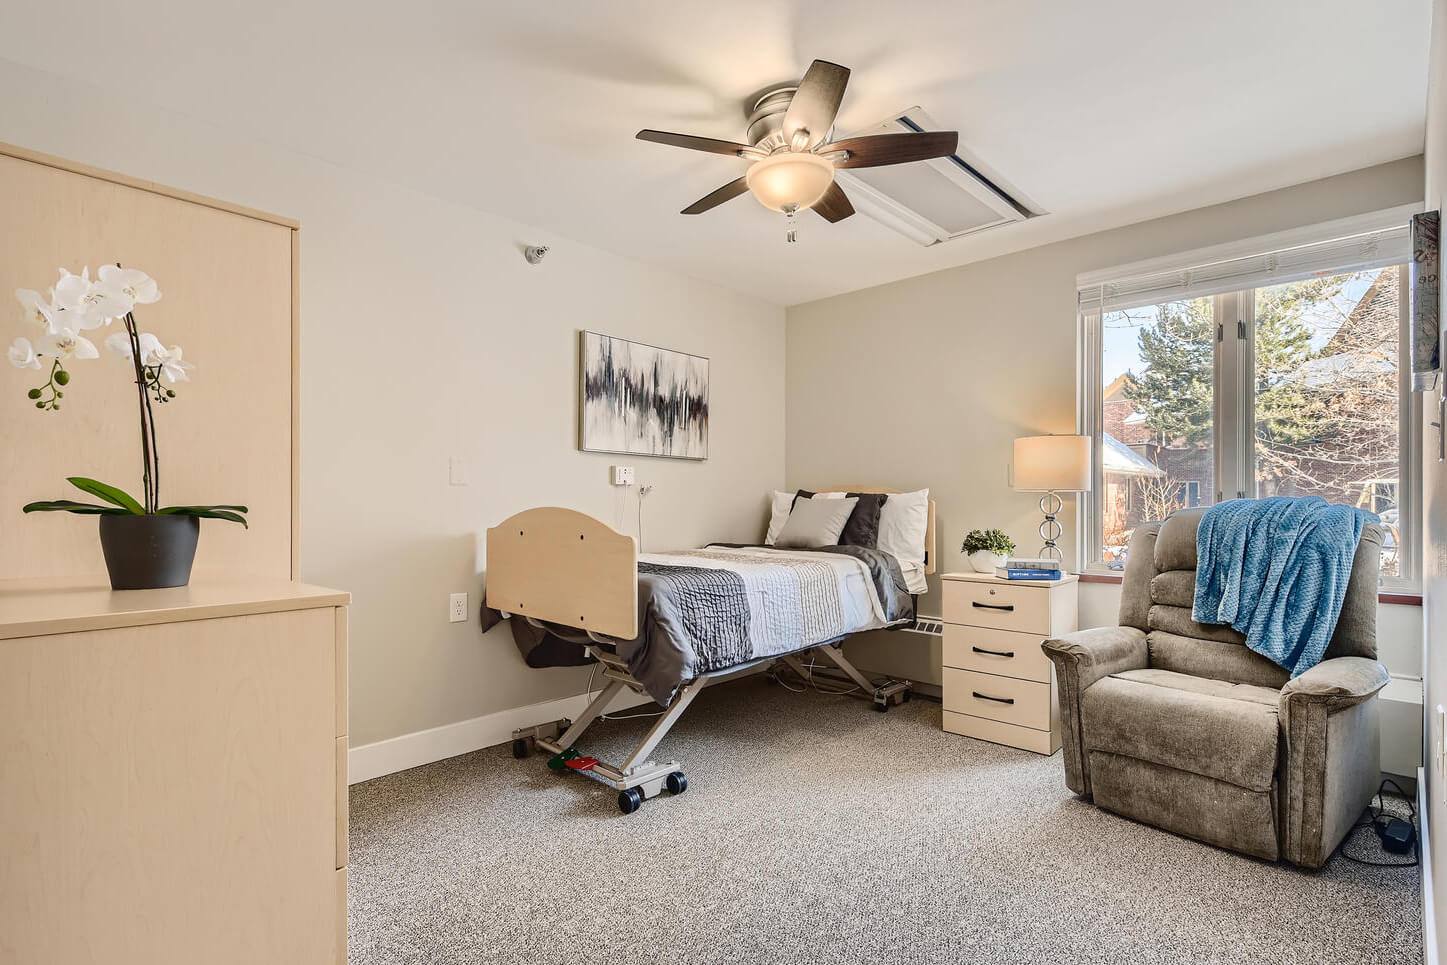
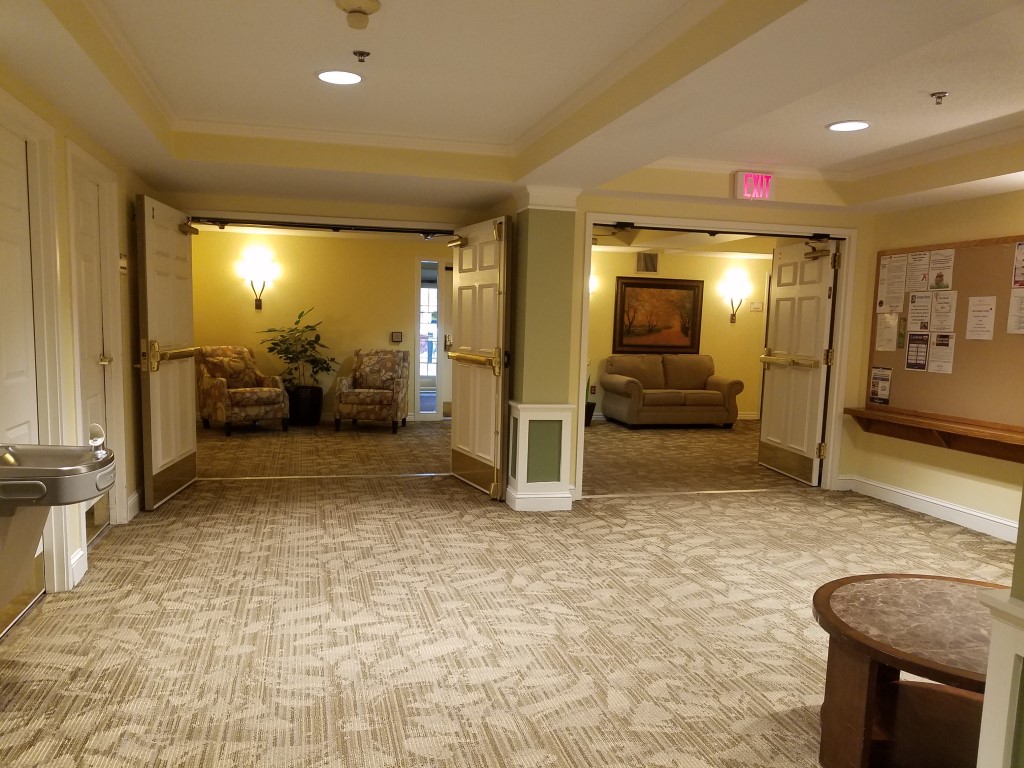
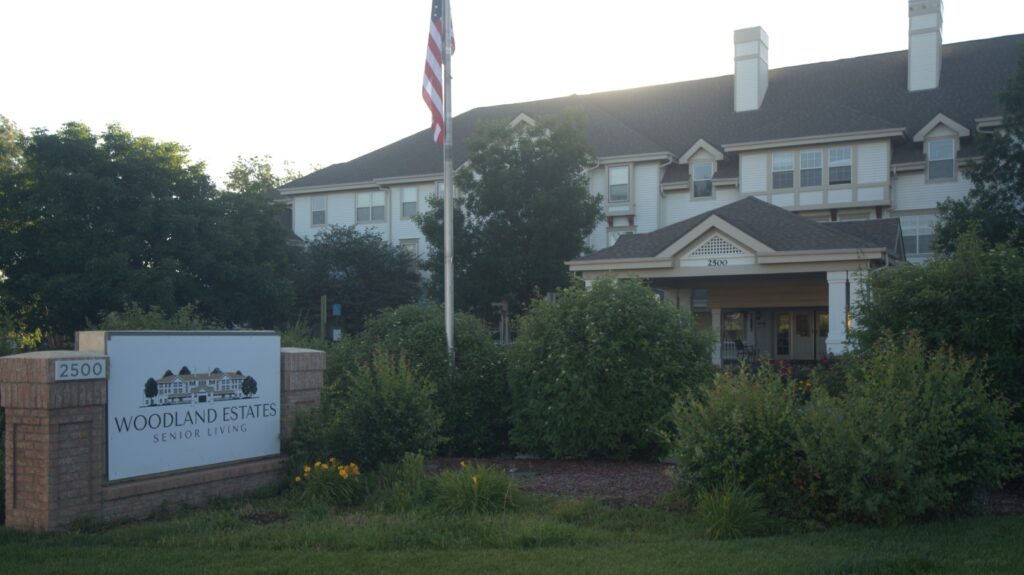
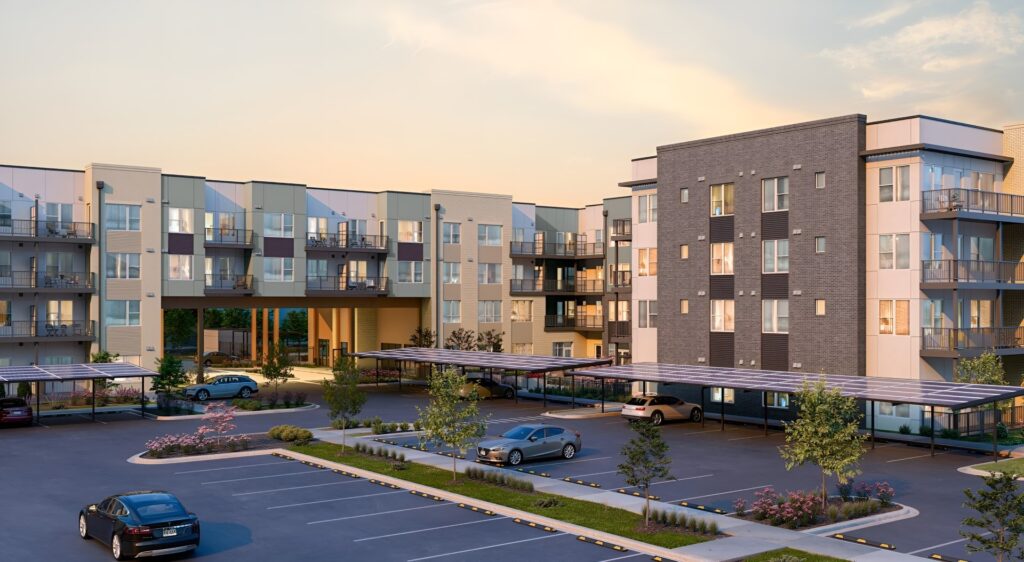
Enjoy the best of your golden years at The Suites at Someren Glen, a distinct community in Centennial, CO, offering independent living, rehabilitation, and skilled nursing. Residents receive top-notch care tailored to their unique needs from a compassionate and well-trained team available around the clock. Purposely built and spacious accommodations are also available in a nurturing and welcoming environment, ensuring residents can feel a sense of belonging during their stay.

Here, residents will not feel lonely with a thoughtfully curated calendar of exciting events and engaging programs conducted to keep them active and socially connected. Healthy and delicious meals are served to satisfy residents’ dietary needs and preferences. The community’s comprehensive care and extensive amenities.

(303) 779-5000

Quality ratings

Measured by Centers for Medicare & Medicaid Services (CMS)

Overall rating Info The Overall CMS Rating combines results from health inspections, staffing levels and quality measures. Health inspections carry the most weight. Staffing and quality scores can increase or decrease the final rating based on performance compared to state and national standards.
3/5
Colorado average: 3.2/5
Health Inspection Info Based on the results of the facility's three most recent standard inspections and any complaint investigations. CMS reviews the number, scope, and severity of deficiencies, with more recent findings weighted more heavily.
3/5
Colorado average: 2.8/5
Staffing Info Measures average nursing staff hours per resident per day, including Registered Nurses (RNs) and total nursing staff. Ratings are adjusted based on the level of care residents require and are compared to state and national benchmarks.
4/5
Colorado average: 3.1/5
Quality Measures Info Based on clinical and physical health indicators reported to CMS, such as hospital readmissions, falls, pressure ulcers, and improvements in mobility. These measures reflect how well residents' health needs are being managed.
3/5
Colorado average: 4.1/5

Nursing care per resident

Info This shows how many total hours of nursing staff time are available per resident each day. Higher numbers usually mean more staff support.
5h 4m per day

This home provides 31% more nursing time per resident than the Colorado average.

Colorado average: 3h 51m per day

Capacity and availability

Medium-capacity home

Offers a balance of services and community atmosphere.

Total beds 109

This home usually has availability

Lower occupancy suggests more openings may be available.

Lower demand than the Colorado average
Occupancy rate 84.1%
Residents per day (avg) 81
Occupancy rate
84.1%
Residents per day (avg)
81

Who this home usually serves

TYPE OF STAY

Mostly short-term rehab stays

Most residents typically stay for a few weeks or months before returning home or moving on.

Might be optimal for
Short stays Recovery Medicare-covered care

Breakdown by payment type

Medicare

89% of new residents, usually for short-term rehab.

Typical stay 10 days

Private pay

9% of new residents, often for short stays.

Typical stay 1 - 2 years

Medicaid

2% of new residents, often for long-term daily care.

Typical stay 5 years

Finances and operations

Voluntary non-profit community
Operated by a church.
Home revenue
$24.2M
Surplus of revenue
$977.4K
Voluntary non-profit community Operated by a church.
Home revenue
$24,243,886.00
Surplus of revenue
$977,432.00
Payroll costs Info The portion of the home's budget spent on staff, including nurses, caregivers, and other employees who support care and operations.
$7.0M
29% of revenue
Other operating costs Info All remaining costs needed to run the home, such as food, utilities, building maintenance, supplies and administrative expenses.
$16.2M
Total costs $23.3M
Bed community size
109-bed community
A larger shared setting that may offer more common spaces and organized community services.
Walk Score
Walk Score: 70 / 100
Very walkable. Most errands can be accomplished on foot, and many essentials are within a short walk.

About this community

Occupancy

Occupancy rate
84%
In line with Colorado average
Occupied beds
92 / 109
Average residents 72 per day

License details

Status Active

Ownership & operating entity

The Suites at Someren Glen is administrated by Ray, Jennifer.

Owner: CHRISTIAN LIVING NEIGHBORHOODS

What does this home offer?

Pets allowed icon
Pets allowed icon

Pets Allowed: Yes, Pets Allowed

Housing options icon

Housing Options: Studio / 1 Bed / 2 Bed

Building type icon
Building type icon

Building Type: 3-story

Dining services icon

Dining Services

Beauty services icon

Beauty Services

Transportation services icon

Transportation Services

Housekeeping icon
Housekeeping icon

Housekeeping Services

Social and recreational activities icon

Social and Recreational Activities

Parking Available icon

Parking Available

Types of Care at The Suites at Someren Glen

Independent Living Assisted Living Memory Care Skilled Nursing
Contact The Suites at Someren Glen

Access & Eligibility

Ways to qualify for care at this community, including accepted programs and payment options.

Medicaid Accepted

This facility is certified for eligible Medicaid services.

Medicare Accepted

This facility is certified for eligible Medicare services.

Payment & Funding Options

Private pay Medicaid Medicare

Inspection History

In Colorado, the Department of Public Health and Environment, Health Facilities Division is the regulatory body that performs unannounced surveys and publishes facility inspection findings.

Health Inspection History

Inspections
Total health inspections 6

Colorado average 4.8


Last Health inspection on Apr 2025

Total health citations 19

Colorado average 24.8

Citations per inspection
3.17

Colorado average 5.2


Health citations are formal notices following inspections when they fail to comply with safety and care standards.

14 of 19 citations resulted from standard inspections; and 5 of 19 resulted from complaint investigations.

Breakdown of citation severity (last 3 years)
Critical Health citations More info 0
100% better than Colorado average

Colorado average: 0.4


Serious Health citations More info 3
43% worse than Colorado average

Colorado average: 2.1

0 critical citations More info Colorado average: 0.4

3 serious citations More info Colorado average: 2.1

16 moderate citations More info Colorado average: 22.2

0 minor citations More info Colorado average: 0.2
Citations history (last 3 years)
Quality of Care moderate citation Info Issues related to how well residents receive appropriate treatment and support for their medical and daily care needs. Apr 30, 2025
Corrected

Resident Rights moderate citation Info Issues related to resident's rights, including dignity, privacy, and the ability to make decisions about their care. Apr 30, 2025
Corrected

Infection Control moderate citation Info Issues related to preventing and controlling infections, including hygiene practices and safety protocols. Apr 25, 2024
Corrected

Nursing Services moderate citation Info Issues related to the availability and quality of nursing staff and the care they provide. Apr 25, 2024
Corrected

Compare Assisted Living around Arapahoe County The information below is reported by the Colorado Department of Public Health and Environment, Health Facilities Division.

Woodland Estates Senior Living
AL

Assisted Living A licensed, long-term care setting for seniors or individuals with disabilities who need help with daily activities — like bathing, dressing, and medication management — but not 24-hour skilled nursing. Offers housing, meals, and around-the-clock support while aiming to maximize resident independence.

IL

Independent Living Lifestyle-focused communities for older adults offering dining, activities, and transportation with minimal personal care. Best for active, independent seniors who want community without medical support.

MC

Memory Care Secured, specialized care for people living with Alzheimer's or dementia. Staff trained in cognitive impairment, with higher staff-to-resident ratios and an environment designed to reduce confusion and wandering risk.

NH

Nursing Home Licensed facility providing 24/7 skilled nursing care for residents with complex, ongoing medical needs. Staffed by RNs, LPNs, and CNAs. Inspected and star-rated annually by CMS. Accepts Medicare (short-term rehab) and Medicaid (long-term care).

Denver
135
Yes
18
Studio / 1 Bed / 2 Bed
The Suites at Someren Glen
NH

Nursing Home Licensed facility providing 24/7 skilled nursing care for residents with complex, ongoing medical needs. Staffed by RNs, LPNs, and CNAs. Inspected and star-rated annually by CMS. Accepts Medicare (short-term rehab) and Medicaid (long-term care).

AL

Assisted Living A licensed, long-term care setting for seniors or individuals with disabilities who need help with daily activities — like bathing, dressing, and medication management — but not 24-hour skilled nursing. Offers housing, meals, and around-the-clock support while aiming to maximize resident independence.

IL

Independent Living Lifestyle-focused communities for older adults offering dining, activities, and transportation with minimal personal care. Best for active, independent seniors who want community without medical support.

MC

Memory Care Secured, specialized care for people living with Alzheimer's or dementia. Staff trained in cognitive impairment, with higher staff-to-resident ratios and an environment designed to reduce confusion and wandering risk.

Centennial
109
Yes
70
Studio / 1 Bed / 2 Bed
Rocky Mountain Assisted Living and Memory Care
AL

Assisted Living A licensed, long-term care setting for seniors or individuals with disabilities who need help with daily activities — like bathing, dressing, and medication management — but not 24-hour skilled nursing. Offers housing, meals, and around-the-clock support while aiming to maximize resident independence.

MC

Memory Care Secured, specialized care for people living with Alzheimer's or dementia. Staff trained in cognitive impairment, with higher staff-to-resident ratios and an environment designed to reduce confusion and wandering risk.

Greenwood Village
-
No
-
Studio / 1 Bed / 2 Bed
Amberley at Inverness
IL

Independent Living Lifestyle-focused communities for older adults offering dining, activities, and transportation with minimal personal care. Best for active, independent seniors who want community without medical support.

Englewood
-
No
38
1 Bed / 2 Bed / 3 Bed
Aspendale Centennial
IL

Independent Living Lifestyle-focused communities for older adults offering dining, activities, and transportation with minimal personal care. Best for active, independent seniors who want community without medical support.

Centennial
-
No
30
1 Bed / 2 Bed

Places of interest near The Suites at Someren Glen

Address 3.9 miles from city center
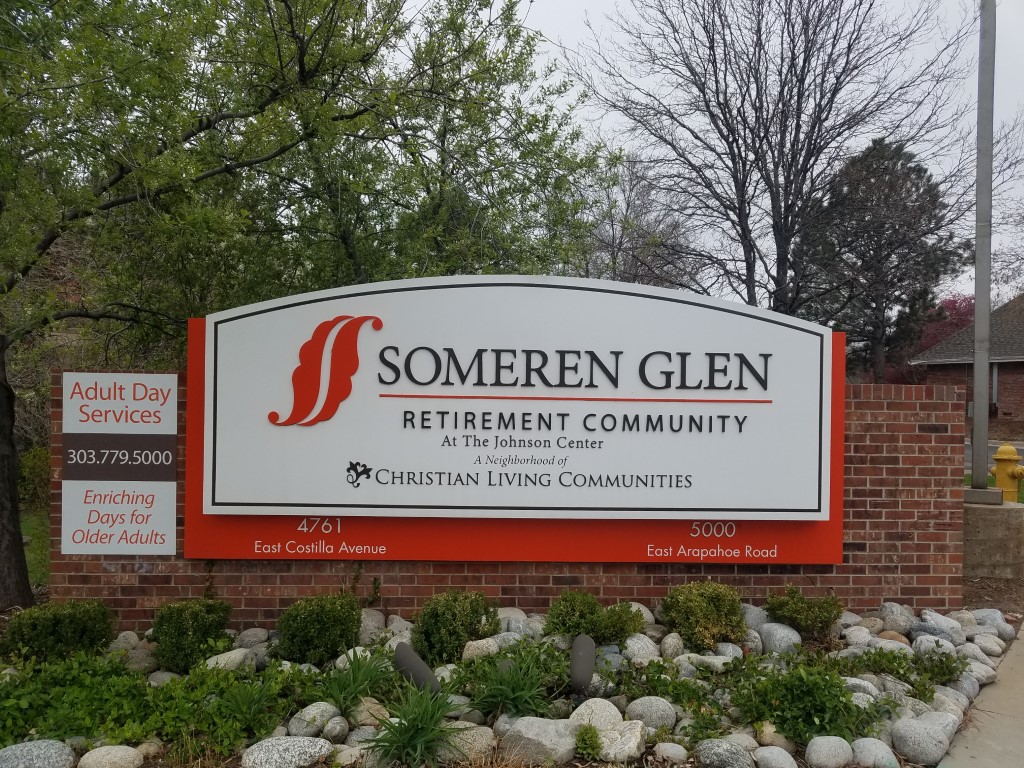
Address 5000 E Arapahoe Rd, Centennial, CO 80122

Calculate Travel Distance to The Suites at Someren Glen

Add your location

Address

Staffing Data (Q2 2025)

This data corresponds to Q2 2025 and is based on CMS Payroll-Based Journal.

Total staff 190
Employees 115
Contractors 75
Staff to resident ratio 2.09:1
10% better than Colorado average

Colorado average ratio: 1.91:1

Avg staff/day 51
Average shift 8.7 hours
5% better than Colorado average

Colorado average: 8.3 hours

Total staff hours (quarter) 40,150
Nursing staff breakdown
Registered Nurse

Manages medical care and health needs.

Total count 41
Average shift length Info Average shift length. Calculated as total hours divided by days worked and average staff per day. 9.2 hours

This role is partially covered by contractors.

Licensed Practical Nurse

Assists with medical care and medications.

Total count 35
Average shift length Info Average shift length. Calculated as total hours divided by days worked and average staff per day. 9.2 hours

This role is partially covered by contractors.

Certified Nursing Assistant

Helps with daily care and mobility.

Total count 80
Average shift length Info Average shift length. Calculated as total hours divided by days worked and average staff per day. 9.5 hours

This role is partially covered by contractors.

Contractor staffing

Total hours from contractors

10.8%

4,329 contractor hours this quarter

Certified Nursing Assistant: 23 Licensed Practical Nurse: 16 Registered Nurse: 12 Qualified Social Worker: 4 Physical Therapy Assistant: 4 Respiratory Therapy Technician: 4 Medication Aide/Technician: 4 Occupational Therapy Aide: 3 Physical Therapy Aide: 3 Therapeutic Recreation Specialist: 1 Speech Language Pathologist: 1
Staff by category
Certified Nursing Assistant57238020,85891100%9.5
Registered Nurse2912416,47791100%9.2
Licensed Practical Nurse1916355,95291100%9.2
Clinical Nurse Specialist2021,0326571%7.9
Nurse Practitioner2021,0276571%7.9
RN Director of Nursing2028307380%6.7
Respiratory Therapy Technician0446047684%4.6
Dental Services Staff2025185965%8.4
Administrator2025116268%8
Speech Language Pathologist0114786369%7.6
Therapeutic Recreation Specialist0114086673%6.2
Physical Therapy Assistant0443996976%4.9
Occupational Therapy Aide0333556571%4
Qualified Social Worker0443546571%5.4
Physical Therapy Aide0332315459%3.7
Medication Aide/Technician044119910%9.9
80 Certified Nursing Assistant
% of Days 100%
41 Registered Nurse
% of Days 100%
35 Licensed Practical Nurse
% of Days 100%
2 Clinical Nurse Specialist
% of Days 71%
2 Nurse Practitioner
% of Days 71%
2 RN Director of Nursing
% of Days 80%
4 Respiratory Therapy Technician
% of Days 84%
2 Dental Services Staff
% of Days 65%
2 Administrator
% of Days 68%
1 Speech Language Pathologist
% of Days 69%
1 Therapeutic Recreation Specialist
% of Days 73%
4 Physical Therapy Assistant
% of Days 76%
3 Occupational Therapy Aide
% of Days 71%
4 Qualified Social Worker
% of Days 71%
3 Physical Therapy Aide
% of Days 59%
4 Medication Aide/Technician
% of Days 10%

Facility Characteristics

Source: CMS Long-Term Care Facility Characteristics (Data as of Jan 2026)

Total census
91 residents
Residents by payment source
Medicare
18 residents (19.8%)
Medicaid
29 residents (31.9%)
Private pay or other
44 residents (48.4%)
Programs & Services
Residents' Group

Residents meet regularly to discuss policies, care quality, and activities

Family Member Group

Family members meet regularly to discuss policies, care quality, and activities

CCRC

Part of a Continuing Care Retirement Community offering multiple care levels

Active Family Council

Organized group of family members that meets regularly to discuss facility policies, resident care, and activities.

Active Resident Council

Organized group of residents that meets regularly to discuss facility policies, quality of life, and activities.

Quality of care over time

These measures show how residents usually do over time at this home, based on health outcomes and preventive care.

High-risk clinical events score Info A composite score based on pressure ulcers, falls with injury, weight loss, walking ability decline, and activities of daily living decline. 13.9
54% worse than Colorado average

Colorado average: 9.0

Functional decline score Info A composite score based on activities of daily living decline, walking ability decline, and incontinence. 33.0
75% worse than Colorado average

Colorado average: 18.8

Long-stay resident measures
Need for Help with Daily Activities Increased Info Percent of long-stay residents whose need for help with daily activities has increased 26.7%
66% worse than Colorado average

Colorado average: 16.0%

Walking Ability Worsened Info Percent of long-stay residents whose ability to move independently worsened 30.9%
82% worse than Colorado average

Colorado average: 17.0%

Low Risk Residents with Bowel/Bladder Incontinence Info Percent of low risk long-stay residents who lose control of their bowels or bladder 41.4%
78% worse than Colorado average

Colorado average: 23.2%

Falls with Major Injury Info Percent of long-stay residents experiencing one or more falls with major injury 3.3%
In line with Colorado average

Colorado average: 3.3%

High Risk Residents with Pressure Ulcers Info Percent of long-stay high risk residents with pressure ulcers 4.9%
26% worse than Colorado average

Colorado average: 3.9%

Urinary Tract Infection Info Percent of long-stay residents with a urinary tract infection 2.1%
46% worse than Colorado average

Colorado average: 1.4%

Lost Too Much Weight Info Percent of long-stay residents who lose too much weight 4.0%
23% better than Colorado average

Colorado average: 5.2%

Depressive Symptoms Info Percent of long-stay residents who have depressive symptoms 2.8%
62% better than Colorado average

Colorado average: 7.2%

Antipsychotic Use Info Percent of long-stay residents who received an antipsychotic medication 12.4%
34% better than Colorado average

Colorado average: 18.8%

Pneumococcal Vaccine Info Percent of long-stay residents assessed and appropriately given the pneumococcal vaccine 44.0%
53% worse than Colorado average

Colorado average: 93.3%

Influenza Vaccine Info Percent of long-stay residents assessed and appropriately given the seasonal influenza vaccine 100.0%
6% better than Colorado average

Colorado average: 94.7%

Short-stay resident measures
Pneumococcal Vaccine Info Percent of short-stay residents assessed and appropriately given the pneumococcal vaccine 28.4%
63% worse than Colorado average

Colorado average: 76.6%

Antipsychotic medication increase Info Percent of short-stay residents who newly received an antipsychotic medication 2.3%
63% worse than Colorado average

Colorado average: 1.4%

Influenza Vaccine Info Percent of short-stay residents assessed and appropriately given the seasonal influenza vaccine 31.9%
58% worse than Colorado average

Colorado average: 75.6%

Penalties and fines

Federal penalties imposed by CMS for regulatory violations, including civil money penalties (fines) and denials of payment for new Medicare/Medicaid admissions.

Source: CMS Penalties Database (Data as of Jan 2026)

Total fines amount $36K
8% lower than Colorado average

Colorado average: $40K

Number of fines 1
55% fewer fines than Colorado average

Colorado average: 2.2

Payment Denials Info Serious action where Medicare and/or Medicaid temporarily stops payments for new residents until issues are fixed. 1
276% more payment denials than Colorado average

Colorado average: 0.3

Fines amount comparison
This facility $36K
Colorado average $40K
Penalty History

Penalties are imposed by CMS for violations of federal nursing home regulations.

Civil Money Penalty Info Fines imposed for noncompliance, which can be assessed per day or per instance of violation. Apr 25, 2024
$36K
Payment Denial Info Serious action where Medicare and/or Medicaid temporarily stops payments for new residents until issues are fixed. Apr 25, 2024
32 days

Last updated: Jan 2026

Guides for Better Senior Living

Care Cost Calculator: See Prices in Your Area

Nursing Home Data Explorer

Don’t Wait Too Long: 7 Red Flag Signs Your Parent Needs Assisted Living Now

The True Cost of Assisted Living in 2025 – And How Families Are Paying For It

Understanding Senior Living Costs: Pricing Models, Discounts & Financial Assistance

Financial Aid for Colorado Seniors

Get financial aid guidance

Elderly, Blind, and Disabled Waiver

Colorado Medicaid EBD Waiver

Age 65+ or disabled, Colorado resident, Medicaid- eligible, nursing home-level care need.

~$2,829/month (300% FBR, individual).

$2,000 (individual), $3,000 (couple).

Requires level-of-care assessment by case manager.

Old Age Pension (OAP) Health Care Program

Colorado OAP

Age 60+, Colorado resident.

~$1,215/month (individual).

$2,000 (individual).

Supplements SSI; limited medical coverage.

Program of All-Inclusive Care for the Elderly (PACE)

Colorado Medicaid PACE

Age 55+, Colorado resident, nursing home-level care need, safe with PACE support.

~$2,829/month (300% FBR).

$2,000 (individual), $3,000 (couple).

Limited to specific regions (e.g., Denver, Pueblo).

Home Care Allowance (HCA)

Colorado Home Care Allowance (HCA)

Seniors typically 65+, Age 5+ with disability, Colorado resident, financial/functional need.

~$1,004/month (individual, stricter than waivers).

$2,000 (individual), $3,000 (couple).

Must need help with ADLs; not Medicaid-waiver eligible.

Senior Community Service Employment Program (SCSEP)

Colorado SCSEP (federally funded, state-administered)

Age 55+, unemployed, low-income, Colorado resident.

~$1,983/month (125% FPL, individual).

Not specified; income-focused.

Priority for veterans, rural residents.

Tour Icon
Planning a tour? Check our touring checklist.
Chat Icon
Thinking of living here? We can help you speak to a current resident