Explore Open Rooms

1 Contact details
2 What type of senior care service are you looking for?
3 What budget do you have in mind for senior care?
4 How soon do you need to find care?
5 Additional details

Thank you for your interest!

Our team will be in touch shortly to help with next steps.

Nursing Home

Willow Creek Healthcare Center

Nursing Home

Willow Creek Healthcare Center

650 W Alluvial Ave, Clovis, CA 93611 View map
Overview of Willow Creek Healthcare Center

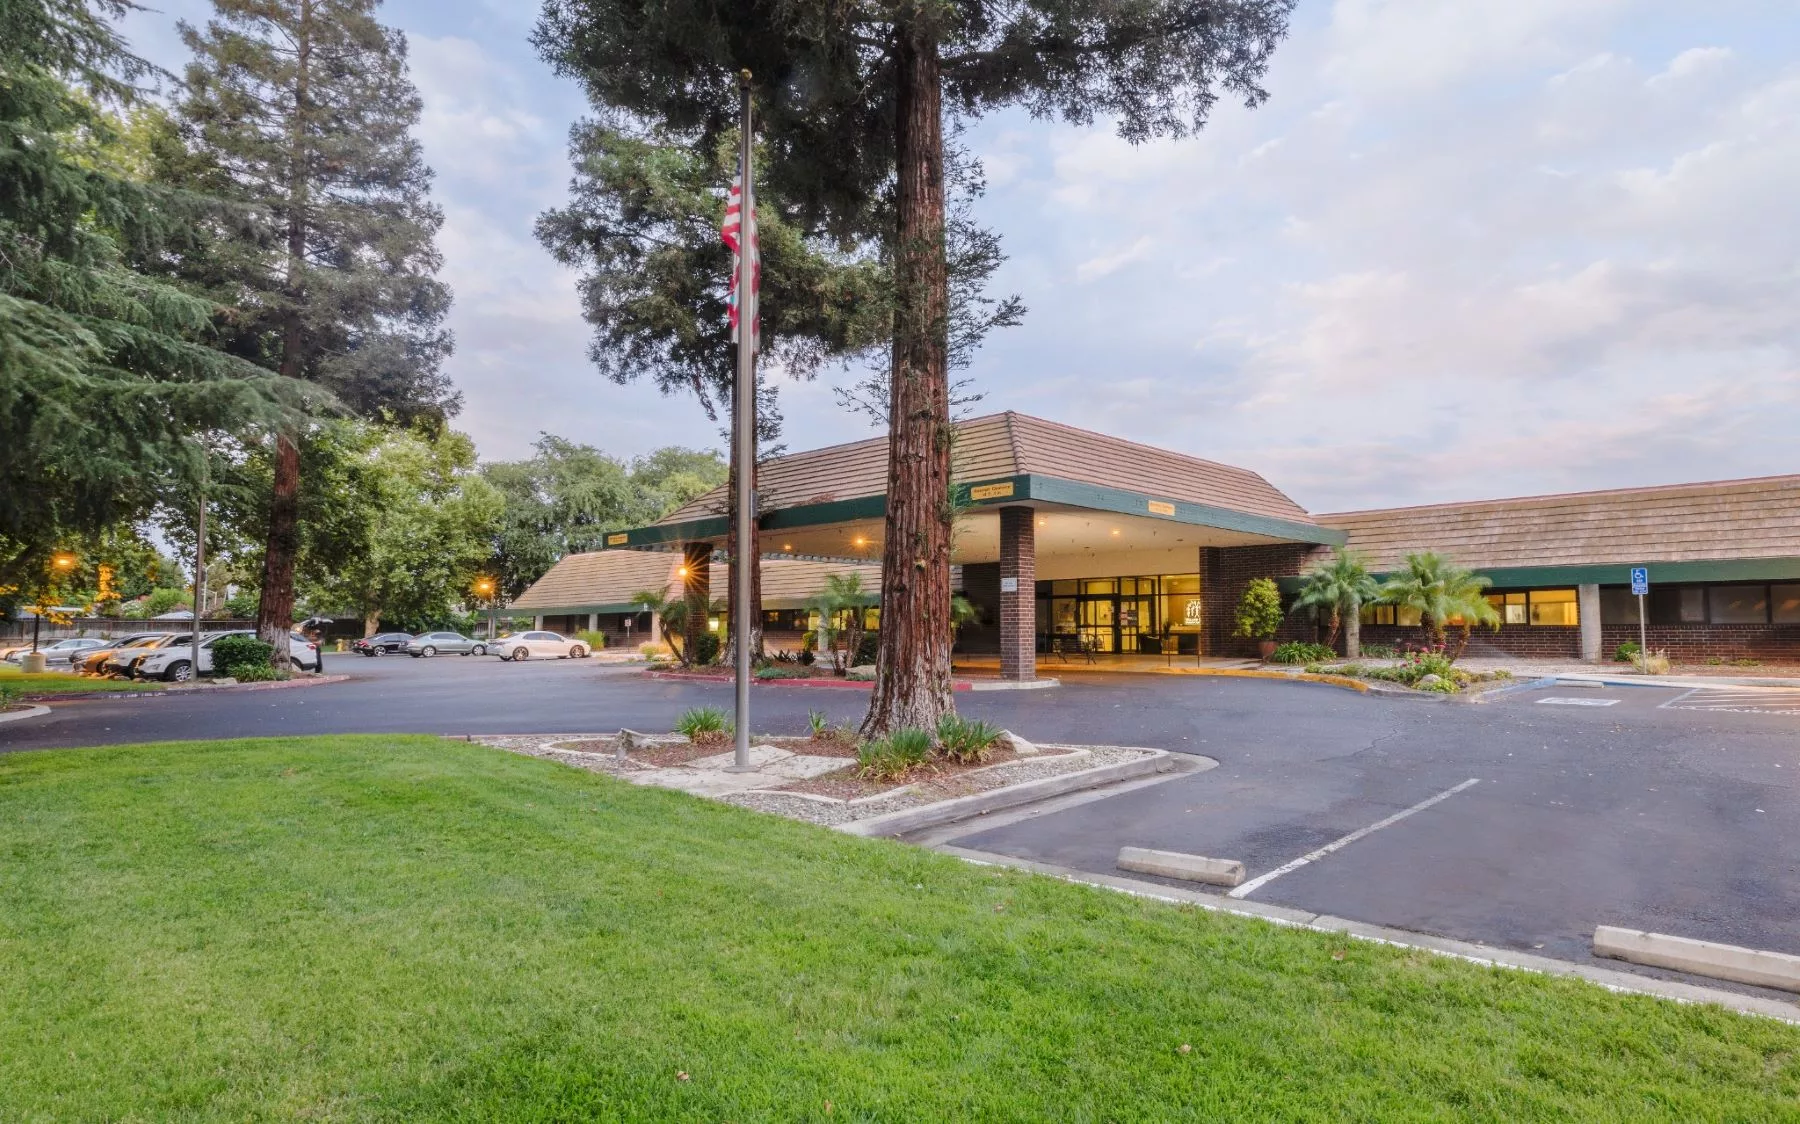
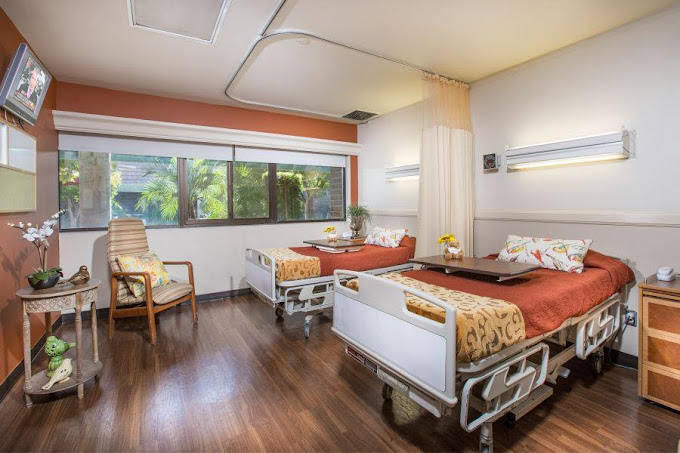
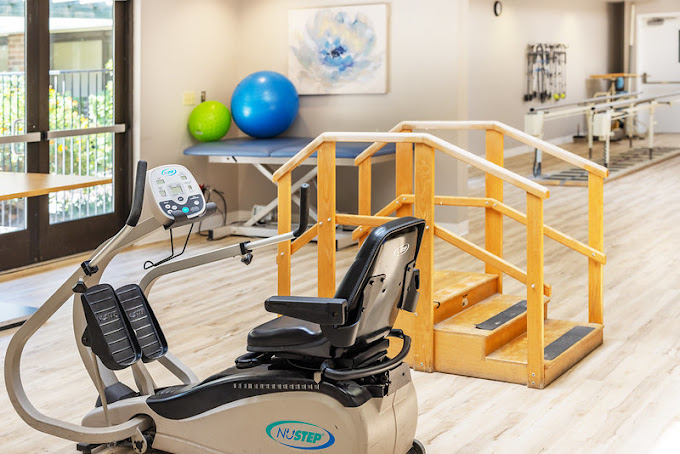
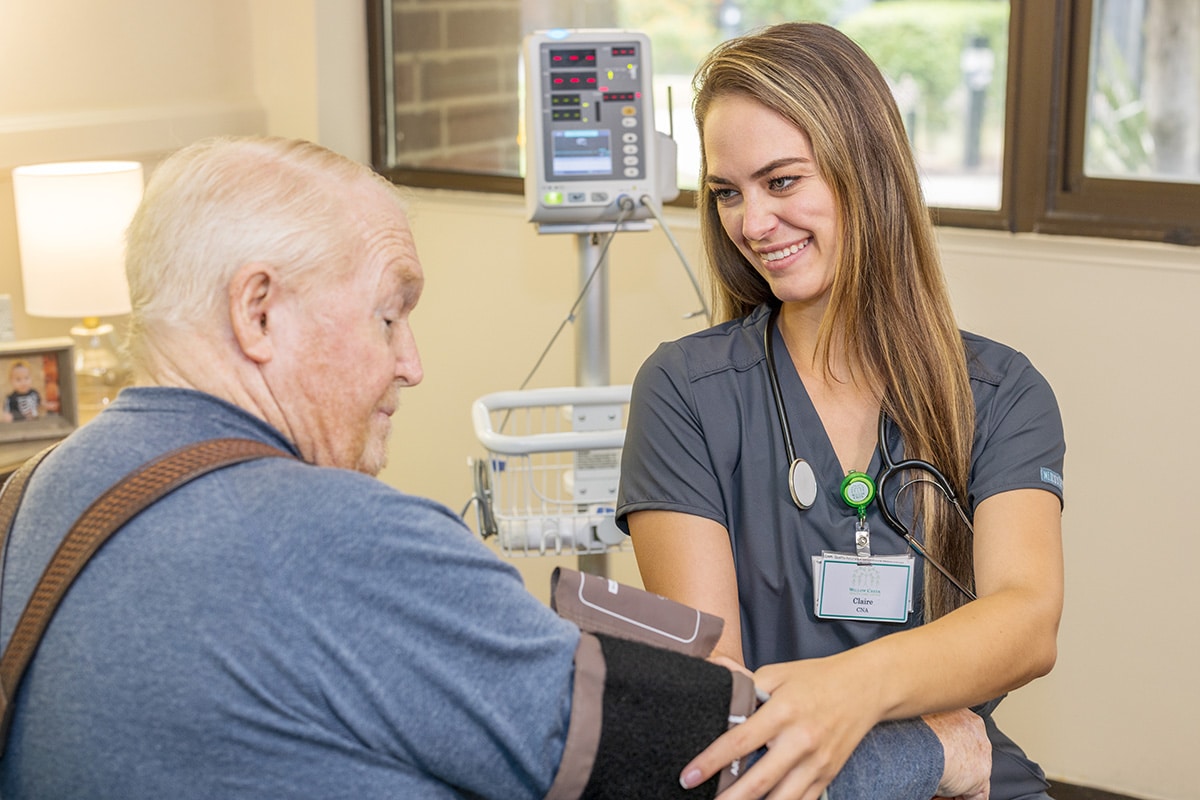
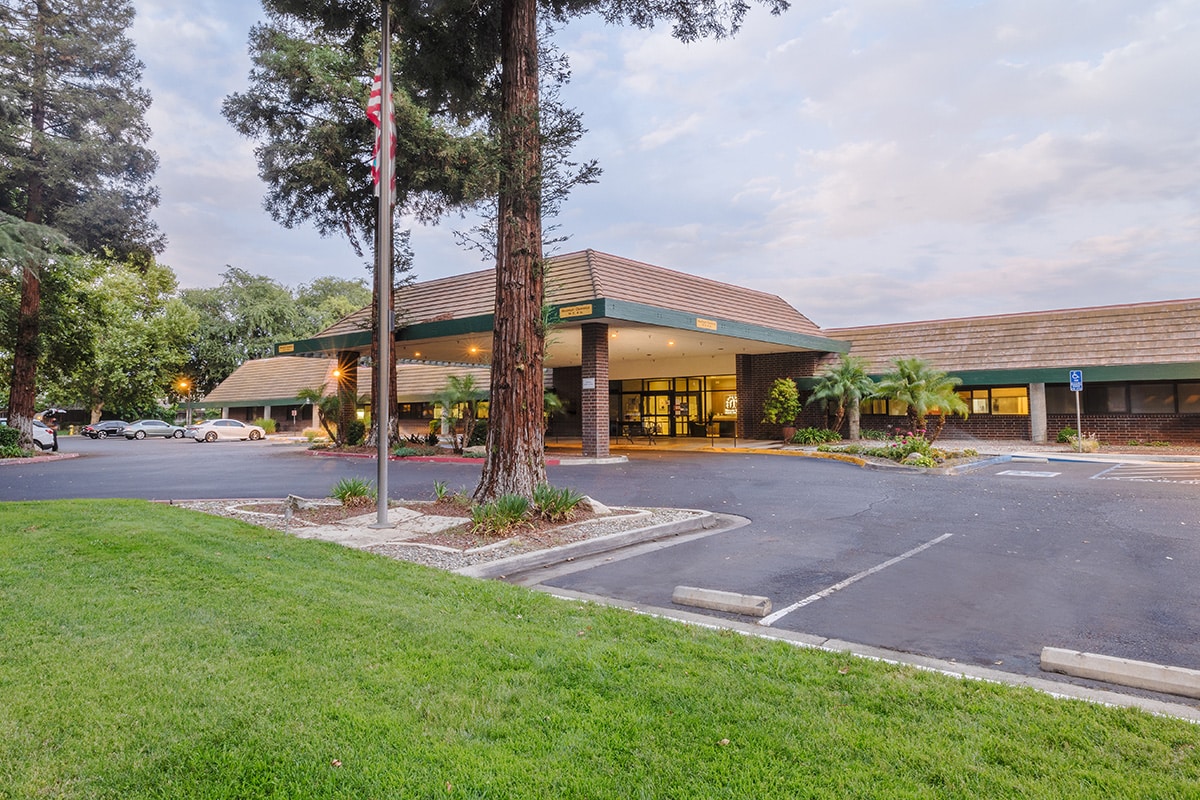
Nestled in Clovis, California, Willow Creek Healthcare Center provides a welcoming and secure environment, ensuring seniors receive top-notch skilled nursing home care. Strategically located off N. Willow Ave., the facility offers convenient accessibility, creating a hassle-free experience for residents and their families. Willow Creek stands out with its state-of-the-art and spacious rehab gym, providing cutting-edge rehabilitation services to support residents on their journey to better health.

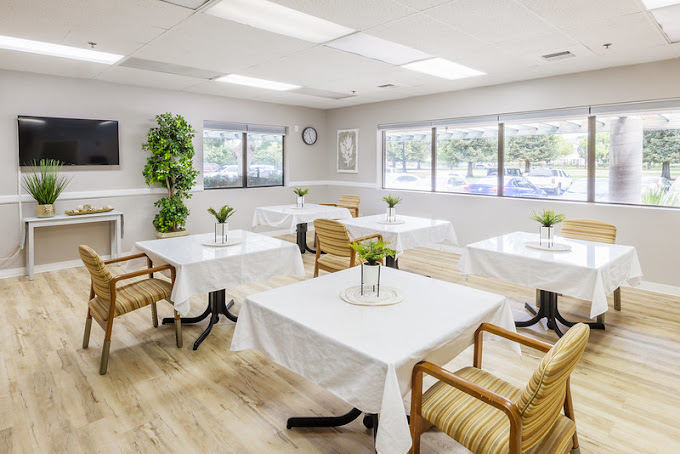
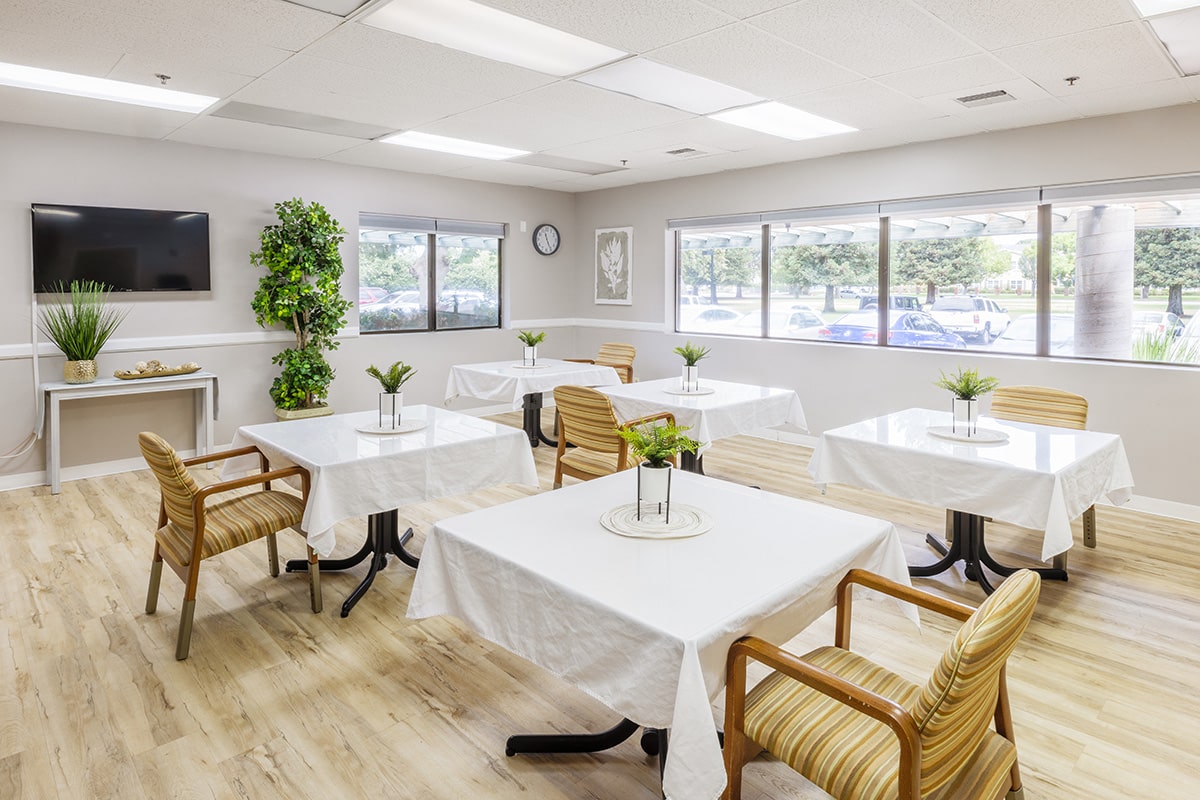
In addition to the skilled nursing services, the facility boasts inviting outdoor spaces, including courtyards and common areas, fostering a perfect setting for socialization and community engagement. Willow Creek Healthcare Center is not just a skilled nursing facility. It’s a well-designed space that meets senior living standards and nursing home requirements, offering seniors a thoughtful and comprehensive option for their healthcare needs.

(408) 848-9001

Quality ratings

Measured by Centers for Medicare & Medicaid Services (CMS)

Overall rating Info The Overall CMS Rating combines results from health inspections, staffing levels and quality measures. Health inspections carry the most weight. Staffing and quality scores can increase or decrease the final rating based on performance compared to state and national standards.
3/5
California average: 3.1/5
Health Inspection Info Based on the results of the facility's three most recent standard inspections and any complaint investigations. CMS reviews the number, scope, and severity of deficiencies, with more recent findings weighted more heavily.
2/5
California average: 2.8/5
Staffing Info Measures average nursing staff hours per resident per day, including Registered Nurses (RNs) and total nursing staff. Ratings are adjusted based on the level of care residents require and are compared to state and national benchmarks.
2/5
California average: 3.1/5
Quality Measures Info Based on clinical and physical health indicators reported to CMS, such as hospital readmissions, falls, pressure ulcers, and improvements in mobility. These measures reflect how well residents' health needs are being managed.
5/5
California average: 4.1/5

Nursing care per resident

Info This shows how many total hours of nursing staff time are available per resident each day. Higher numbers usually mean more staff support.
3h 38m per day

This home provides 14% less nursing time per resident than the California average.

California average: 4h 13m per day

Staffing hours breakdown

Info Hours of care per resident per day, broken down by staff type. Data from CMS Medicare.
Staff type Facility State avg National avg
Registered Nurse (RN) Info Registered nurse hours per resident per day. 29m per day 39m per day 41m per day
Nurse Aide Info Nurse aide hours per resident per day. 2h 36m per day 2h 39m per day 2h 21m per day
Total Nursing (Weekend) Info Total number of nurse staff hours per resident per day on weekends. 3h 43m per day 4h 5m per day 3h 26m per day
Physical Therapist Info Physical therapist staff hours per resident per day. 6m per day 5m per day 4m per day
RN (Weekend) Info Registered nurse hours per resident per day on weekends. 22m per day 30m per day 29m per day

Capacity and availability

Medium-capacity home

Offers a balance of services and community atmosphere.

Total beds 159

This home usually has limited availability

Occupancy is moderate, suggesting balanced demand.

Similar demand to the California average
Occupancy rate 94.4%
Residents per day (avg) 152
Occupancy rate
94.4%
Residents per day (avg)
152

Who this home usually serves

TYPE OF STAY

Primarily short stays

Residents typically stay for brief periods, with frequent admissions and discharges throughout the year.

Might be optimal for
Post-acute recovery Temporary care Transitional stays

Breakdown by payment type

Medicare

35% of new residents, usually for short-term rehab.

Typical stay 1 - 2 months

Private pay

62% of new residents, often for short stays.

Typical stay 2 - 3 months

Medicaid

3% of new residents, often for long-term daily care.

Typical stay 7 - 8 months

Finances and operations

Privately-owned community
Home revenue
$33.6M
Profit
$3.4M
Privately-owned community
Home revenue
$33,578,217.00
Profit
$3,444,836.00
Payroll costs Info The portion of the home's budget spent on staff, including nurses, caregivers, and other employees who support care and operations.
$8.9M
26.6% of revenue
Other operating costs Info All remaining costs needed to run the home, such as food, utilities, building maintenance, supplies and administrative expenses.
$21.2M
Total costs $30.1M
Walk Score
Walk Score: 59 / 100
Moderately walkable. Some errands can be accomplished on foot, with a mix of nearby amenities.

About this community

Additional licensing details

Awards: 5-Star Quality Measures Medicare Rating

Care Services

Nursing Services
Rehabilitation Services
Skilled Nursing
Licensed Nurses/CNAs
24-Hour Staffing
Short-Term Rehab

All Levels of Care

Skilled Nursing
Short-Term Rehabilitation
Long-Term Care

Amenities & Lifestyle

Expansive Rehab Gym
Spacious Courtyards & Common Areas
24/7 Nursing Care

Programs & Activities

Specific Programs
Short-Term Rehabilitation, Long-Term Care, Pulmonary Therapy, Complex Wound Care, Hospice Services
Operating Hours
Monday – Friday: 9 am – 5:30 pm, Weekends: 9 am – 5:30 pm

Types of Care at Willow Creek Healthcare Center

Skilled Nursing
Contact Willow Creek Healthcare Center

Health Inspection History

Inspections
Total health inspections 17

California average 12.5


Last Health inspection on Sep 2025

Total health citations 61

California average 50.2

Citations per inspection
3.59

California average 4.65


Health citations are formal notices following inspections when they fail to comply with safety and care standards.

43 of 61 citations resulted from standard inspections; and 18 of 61 resulted from complaint investigations.

Breakdown of citation severity (last 3 years)
Critical Health citations More info 0
100% better than California average

California average: 0.4


Serious Health citations More info 6
500% worse than California average

California average: 1

0 critical citations More info California average: 0.4

6 serious citations More info California average: 1

55 moderate citations More info California average: 47.2

0 minor citations More info California average: 1.5
Citations history (last 3 years)
Quality of Care serious citation Info Issues related to how well residents receive appropriate treatment and support for their medical and daily care needs. Sep 24, 2025
Corrected

Pharmacy moderate citation Info Issues related to medication management, including how drugs are stored, administered, and monitored. Jun 02, 2025
Corrected

Resident Rights serious citation Info Issues related to resident's rights, including dignity, privacy, and the ability to make decisions about their care. May 07, 2025
Corrected

Abuse/Neglect moderate citation Info Issues related to protecting resident's from harm, including abuse, neglect, or mistreatment. Apr 04, 2025
Corrected

Compare Nursing Homes around Clovis The information below is reported by the California Department of Social Services and Department of Public Health.

4 facilities compared · CMS & CA Dept. of Health data · Updated Mar 2026

Willow Creek Healthcare Center
NH

Nursing Home Licensed facility providing 24/7 skilled nursing care for residents with complex, ongoing medical needs. Staffed by RNs, LPNs, and CNAs. Inspected and star-rated annually by CMS. Accepts Medicare (short-term rehab) and Medicaid (long-term care).

Clovis
159
94.4%
+11%
3.63
-23%
-14%
1
61
6
152
-
59
Cantwell, Kalan
$33,6M
$8,9M
26.6%
555652
Morning Star Post Acute
NH

Nursing Home Licensed facility providing 24/7 skilled nursing care for residents with complex, ongoing medical needs. Staffed by RNs, LPNs, and CNAs. Inspected and star-rated annually by CMS. Accepts Medicare (short-term rehab) and Medicaid (long-term care).

Clovis
57
87.2%
+3%
3.24
-31%
-23%
1
45
2
54
A+
76
-
$9,6M
$4,0M
41.5%
56338
Bella Care Home – Pierce Ave
-
NH

Nursing Home Licensed facility providing 24/7 skilled nursing care for residents with complex, ongoing medical needs. Staffed by RNs, LPNs, and CNAs. Inspected and star-rated annually by CMS. Accepts Medicare (short-term rehab) and Medicaid (long-term care).

Clovis
6
100.0%
+18%
-
-
-
-
-
-
0
0
0
-
-
14
Bella Care Home Llc
-
-
-
-
Sierra Care Clovis
-
NH

Nursing Home Licensed facility providing 24/7 skilled nursing care for residents with complex, ongoing medical needs. Staffed by RNs, LPNs, and CNAs. Inspected and star-rated annually by CMS. Accepts Medicare (short-term rehab) and Medicaid (long-term care).

Clovis
-
-
-
-
-
-
-
-
-
0
0
0
-
-
12
-
-
-
-
-

Places of interest near Willow Creek Healthcare Center

Address 2.6 miles from the above — 0.78 miles to nearest hospital (Inspire Health Medical Group - Endocrinology)

Address 650 W Alluvial Ave, Clovis, CA 93611

Calculate Travel Distance to Willow Creek Healthcare Center

Add your location

Address

Staffing Data (Q2 2025)

This data corresponds to Q2 2025 and is based on CMS Payroll-Based Journal.

Total staff 288
Employees 200
Contractors 88
Staff to resident ratio 1.81:1
1811221% better than California average

California average ratio: 0.00:1

Avg staff/day 90
Average shift 8 hours
0% compared with California average

California average: 7.7 hours

Total staff hours (quarter) 65,719
Nursing staff breakdown
Registered Nurse

Manages medical care and health needs.

Total count 19
Average shift length Info Average shift length. Calculated as total hours divided by days worked and average staff per day. 7.9 hours

No contractors work on this role.

Licensed Practical Nurse

Assists with medical care and medications.

Total count 57
Average shift length Info Average shift length. Calculated as total hours divided by days worked and average staff per day. 8 hours

This role is partially covered by contractors.

Certified Nursing Assistant

Helps with daily care and mobility.

Total count 170
Average shift length Info Average shift length. Calculated as total hours divided by days worked and average staff per day. 8.2 hours

This role is partially covered by contractors.

Contractor staffing

Total hours from contractors

9.5%

6,267 contractor hours this quarter

Certified Nursing Assistant: 61 Licensed Practical Nurse: 27
Staff by category
Certified Nursing Assistant1096117034,87891100%8.2
Licensed Practical Nurse30275711,68491100%8
Registered Nurse190195,33091100%7.9
Physical Therapy Assistant5051,6637178%7.3
Speech Language Pathologist5051,6446875%6.8
Respiratory Therapy Technician7071,5797481%7.4
Other Dietary Services Staff4041,3839099%8
Qualified Activities Professional3031,32791100%8.9
Physical Therapy Aide5051,1937886%7.2
RN Director of Nursing3031,0746470%7.8
Qualified Social Worker2028537886%6.6
Administrator1015126470%8
Nurse Practitioner1015126470%8
Occupational Therapy Aide1015126470%8
Dental Services Staff1015126470%8
Dietitian2024735459%8.8
Mental Health Service Worker1014465662%8
Clinical Nurse Specialist1011441820%8
170 Certified Nursing Assistant
% of Days 100%
57 Licensed Practical Nurse
% of Days 100%
19 Registered Nurse
% of Days 100%
5 Physical Therapy Assistant
% of Days 78%
5 Speech Language Pathologist
% of Days 75%
7 Respiratory Therapy Technician
% of Days 81%
4 Other Dietary Services Staff
% of Days 99%
3 Qualified Activities Professional
% of Days 100%
5 Physical Therapy Aide
% of Days 86%
3 RN Director of Nursing
% of Days 70%
2 Qualified Social Worker
% of Days 86%
1 Administrator
% of Days 70%
1 Nurse Practitioner
% of Days 70%
1 Occupational Therapy Aide
% of Days 70%
1 Dental Services Staff
% of Days 70%
2 Dietitian
% of Days 59%
1 Mental Health Service Worker
% of Days 62%
1 Clinical Nurse Specialist
% of Days 20%

Facility Characteristics

Source: CMS Long-Term Care Facility Characteristics (Data as of Jan 2026)

Total census
159 residents
Residents by payment source
Medicare
60 residents (37.7%)
Medicaid
97 residents (61%)
Private pay or other
2 residents (1.3%)
Programs & Services
Residents' Group

Residents meet regularly to discuss policies, care quality, and activities

Active Resident Council

Organized group of residents that meets regularly to discuss facility policies, quality of life, and activities.

Quality of care over time

These measures show how residents usually do over time at this home, based on health outcomes and preventive care.

High-risk clinical events score Info A composite score based on pressure ulcers, falls with injury, weight loss, walking ability decline, and activities of daily living decline. 4.0
39% better than California average

California average: 6.6

Functional decline score Info A composite score based on activities of daily living decline, walking ability decline, and incontinence. 9.8
14% better than California average

California average: 11.3

Long-stay resident measures
Significantly above average California avg: 4.3 Info CMS star rating based on long-stay quality measure performance. 5 stars = significantly above average, 1 star = significantly below average.
Need for Help with Daily Activities Increased Info Percent of long-stay residents whose need for help with daily activities has increased 9.8%
12% better than California average

California average: 11.1%

Walking Ability Worsened Info Percent of long-stay residents whose ability to move independently worsened 5.4%
55% better than California average

California average: 12.0%

Low Risk Residents with Bowel/Bladder Incontinence Info Percent of low risk long-stay residents who lose control of their bowels or bladder 14.2%
25% worse than California average

California average: 11.3%

Falls with Major Injury Info Percent of long-stay residents experiencing one or more falls with major injury 2.1%
29% worse than California average

California average: 1.7%

High Risk Residents with Pressure Ulcers Info Percent of long-stay high risk residents with pressure ulcers 0.7%
86% better than California average

California average: 5.0%

Urinary Tract Infection Info Percent of long-stay residents with a urinary tract infection 1.4%
12% worse than California average

California average: 1.2%

Lost Too Much Weight Info Percent of long-stay residents who lose too much weight 2.3%
47% better than California average

California average: 4.2%

Depressive Symptoms Info Percent of long-stay residents who have depressive symptoms 6.3%
6% better than California average

California average: 6.7%

Antipsychotic Use Info Percent of long-stay residents who received an antipsychotic medication 5.1%
49% better than California average

California average: 10.1%

Pneumococcal Vaccine Info Percent of long-stay residents assessed and appropriately given the pneumococcal vaccine 100.0%
In line with California average

California average: 98.5%

Influenza Vaccine Info Percent of long-stay residents assessed and appropriately given the seasonal influenza vaccine 100.0%
In line with California average

California average: 98.2%

Hospitalizations per 1,000 days Info Number of hospitalizations per 1,000 long-stay resident days. 1.41
37% better than California average

California average: 2.25

ED visits per 1,000 days Info Number of outpatient emergency department visits per 1,000 long-stay resident days. 0.74
53% better than California average

California average: 1.59

Short-stay resident measures
Significantly above average California avg: 3.5 Info CMS star rating based on short-stay quality measure performance. 5 stars = much above average, 1 star = much below average.
Pneumococcal Vaccine Info Percent of short-stay residents assessed and appropriately given the pneumococcal vaccine 100.0%
6% better than California average

California average: 94.0%

Antipsychotic medication increase Info Percent of short-stay residents who newly received an antipsychotic medication 0.6%
56% better than California average

California average: 1.5%

Influenza Vaccine Info Percent of short-stay residents assessed and appropriately given the seasonal influenza vaccine 99.0%
6% better than California average

California average: 93.2%

Re-hospitalized after SNF stay Info Percentage of short-stay residents who were re-hospitalized after their nursing home admission. 22.2%
In line with California average

California average: 23.2%

Emergency department visits Info Percentage of short-stay residents who had an outpatient emergency department visit. 12.2%
9% worse than California average

California average: 11.2%

Falls with major injury Info Percentage of SNF residents who experience falls with major injury during their stay. 0.0%
100% better than California average

California average: 0.8%

Ability to care for self at discharge Info Percentage of residents at or above expected ability to care for themselves at discharge. 60.5%
13% better than California average

California average: 53.7%

Successful return to home or community Info Rate of successful return to home or community from a skilled nursing facility. 58.0%
15% better than California average

California average: 50.6%

Penalties and fines

Federal penalties imposed by CMS for regulatory violations, including civil money penalties (fines) and denials of payment for new Medicare/Medicaid admissions.

Source: CMS Penalties Database (Data as of Jan 2026)

Total fines amount $14K
74% lower than California average

California average: $55K

Number of fines 1
58% fewer fines than California average

California average: 2.4

Payment Denials Info Serious action where Medicare and/or Medicaid temporarily stops payments for new residents until issues are fixed. 1
102% more payment denials than California average

California average: 0.5

Fines amount comparison
This facility $14K
California average $55K
Penalty History

Penalties are imposed by CMS for violations of federal nursing home regulations.

Civil Money Penalty Info Fines imposed for noncompliance, which can be assessed per day or per instance of violation. Sep 24, 2025
$14K
Payment Denial Info Serious action where Medicare and/or Medicaid temporarily stops payments for new residents until issues are fixed. May 7, 2025
6 days

Last updated: Jan 2026

Guides for Better Senior Living

Care Cost Calculator: See Prices in Your Area

Nursing Home Data Explorer

Don’t Wait Too Long: 7 Red Flag Signs Your Parent Needs Assisted Living Now

The True Cost of Assisted Living in 2025 – And How Families Are Paying For It

Understanding Senior Living Costs: Pricing Models, Discounts & Financial Assistance

Financial Aid for California Seniors

Get financial aid guidance

Multipurpose Senior Services Program

MSSP (Medi-Cal Waiver)

Age 65+, California resident, Medi-Cal eligible, nursing home risk.

~$2,829/month (300% FBR, individual).

$2,000 (individual), $3,000 (couple).

County-managed; waitlists possible.

In-Home Supportive Services (IHSS)

California IHSS

Age 65+, California resident, Medicaid-eligible or low-income.

~$1,732/month (individual, Medi-Cal threshold).

$2,000 (individual).

Can hire family as caregivers.

Multipurpose Senior Services Program (MSSP)

CA MSSP

Age 65+, California resident, Medi-Cal-eligible, nursing home-eligible but community-capable.

~$2,829/month (300% FBR, individual).

$2,000 (individual).

Available in 38 counties; waitlists common.

Property Tax Postponement Program (PTP)

CA PTP

Age 62+, California resident, own and live in home, 40% equity.

~$51,500/year (household, adjusted annually).

Equity-based; no strict asset cap.

Deferred taxes accrue interest (5% as of 2024); repaid upon sale/death.

Assisted Living Waiver (ALW)

CA ALW

Age 65+ or disabled, California resident, Medi-Cal-eligible, nursing home-eligible.

~$2,829/month (300% FBR, individual).

$2,000 (individual).

Available in 15 counties (e.g., LA, Sacramento); waitlists common.

California CARES Program

CA CARES

Caregivers of California residents 60+ needing help with 3+ daily activities; no caregiver age limit.

No strict limit; cost-sharing above ~$2,500/month threshold.

Not applicable; need-based.

High demand in urban areas; complements IHSS respite.

Low-Income Home Energy Assistance Program (LIHEAP)

CA LIHEAP

Age 60+ priority, California resident, low-income, utility/heating need.

~$2,510/month (200% of poverty level, individual).

Not applicable; income-focused.

High demand in inland/coastal extremes; weatherization capped at $5,000/home.