Life Care Center of Nashoba Valley

Nursing Home in Middlesex County

CMS overall rating Info The Overall CMS Rating is scored from 1 to 5 stars and combines results from health inspections, staffing levels, and quality measures. Health inspections carry the most weight. Staffing and quality scores can increase or decrease the final rating based on performance compared to state and national standards.
Calculator: See prices in your area
Life Care Center of Nashoba Valley accepts Medicare, Medicaid, and private pay.

Overview of Life Care Center of Nashoba Valley

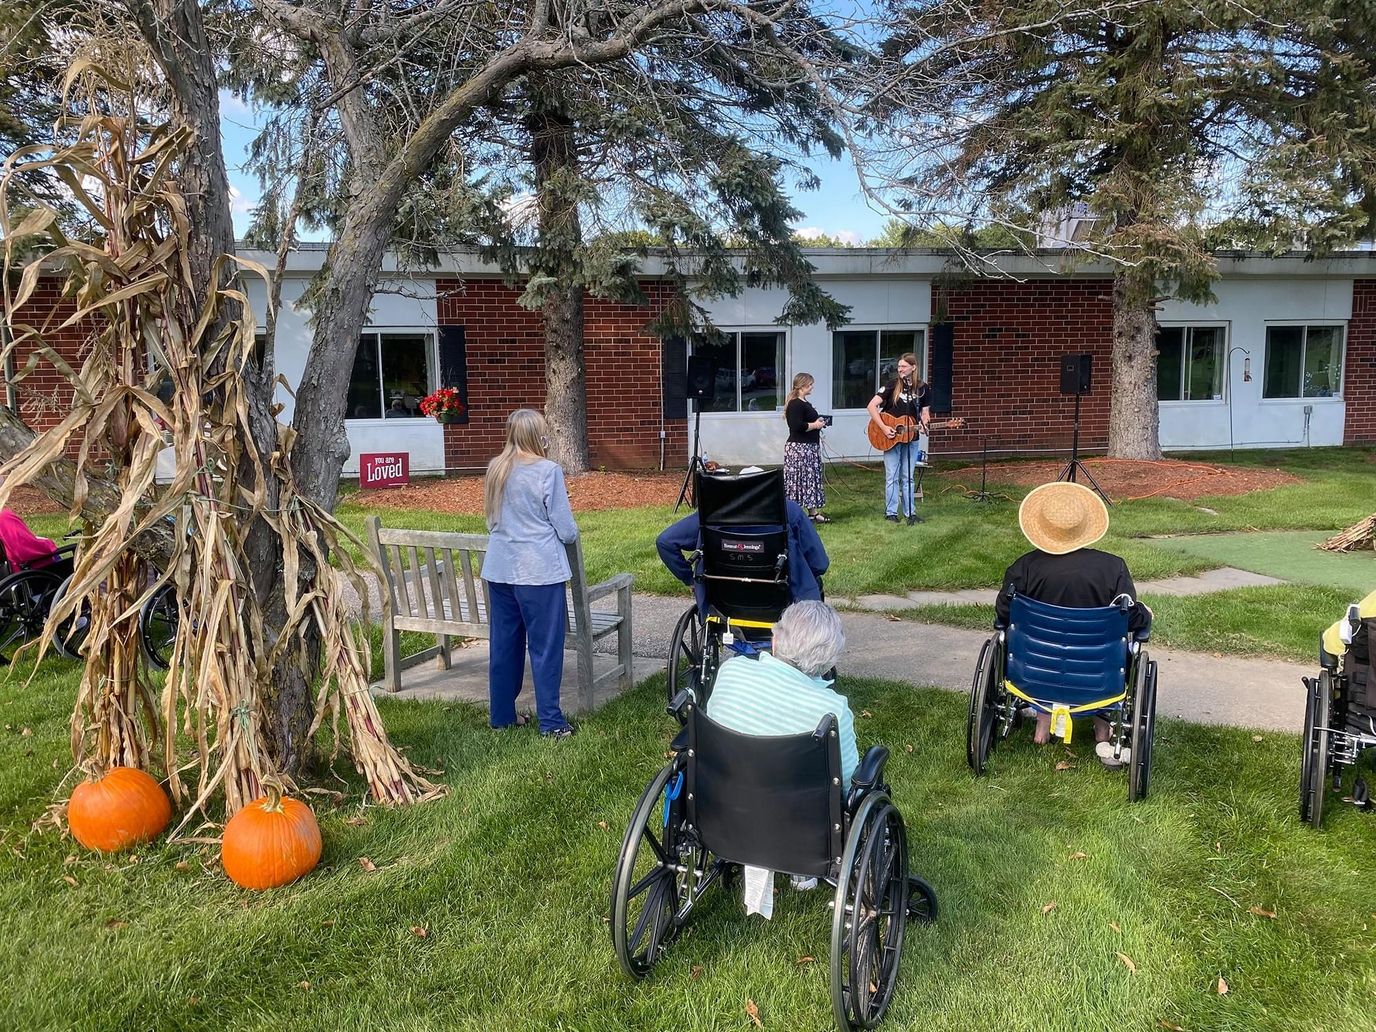
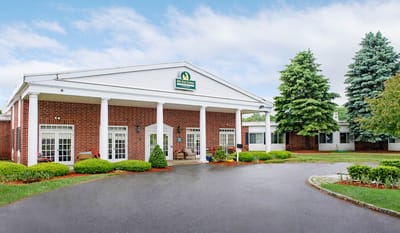
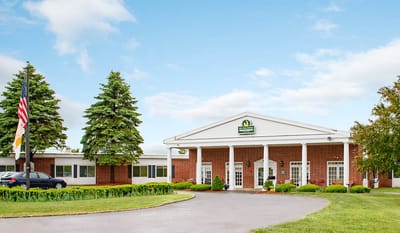
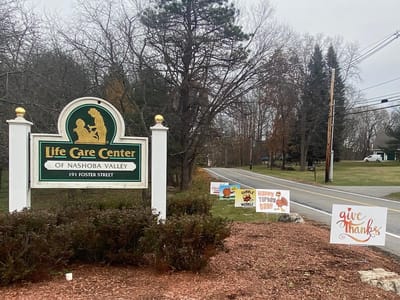
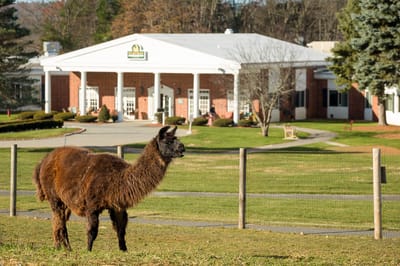
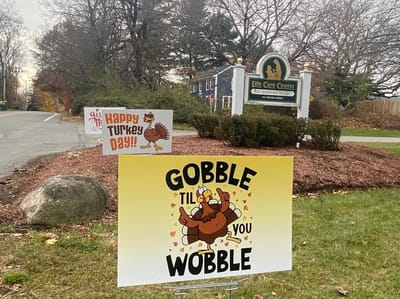
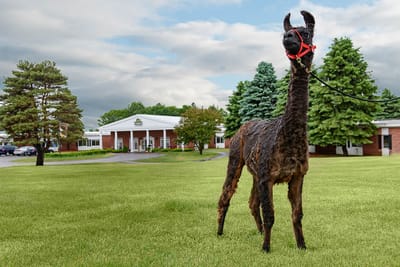
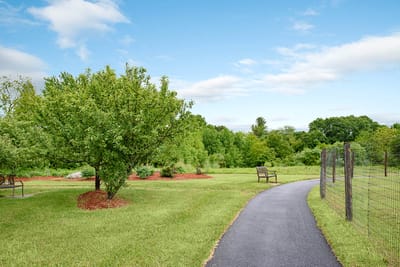
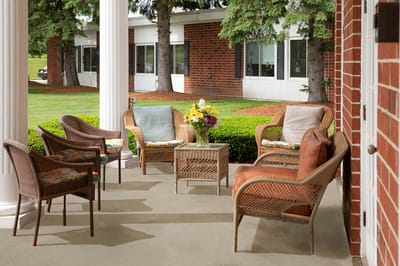
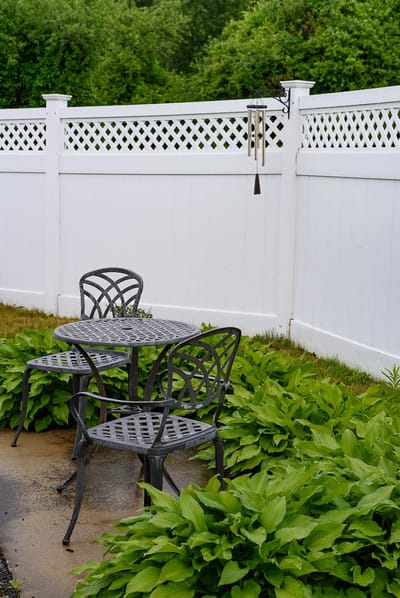
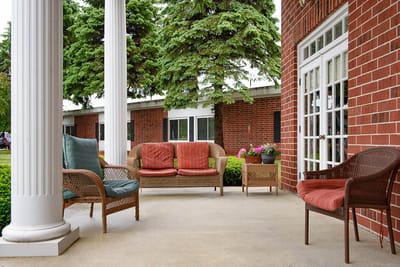
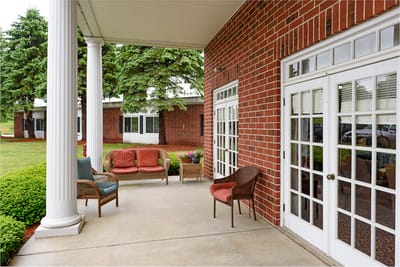
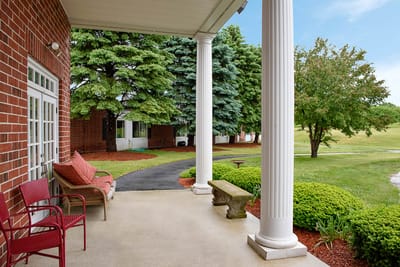
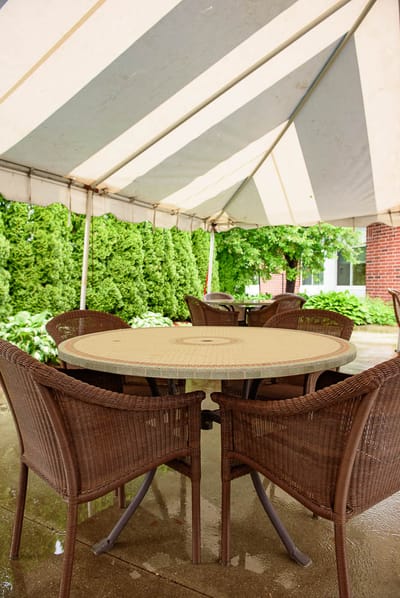
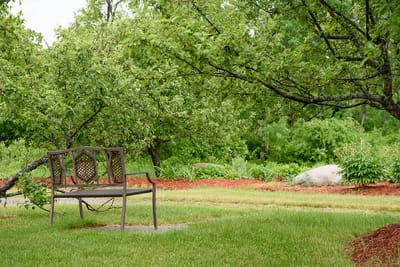
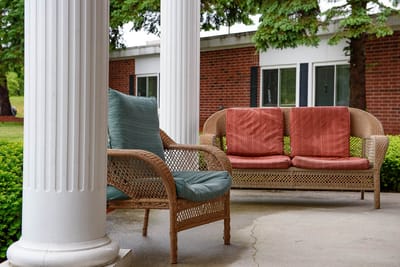
Life Care Center of Nashoba Valley is an idyllic retreat nestled in the serene Foster Street, Littleton, MA, that offers nursing care and rehabilitation. Here, residents enjoy the highest quality of care and assistance around the clock, ensuring comfort and convenience. The community also features secured memory care units, ideal for residents with memory-related needs.

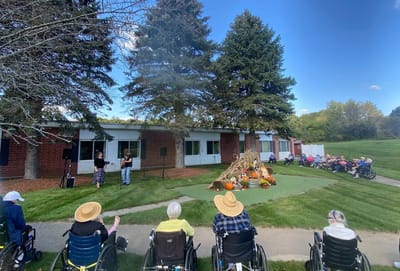
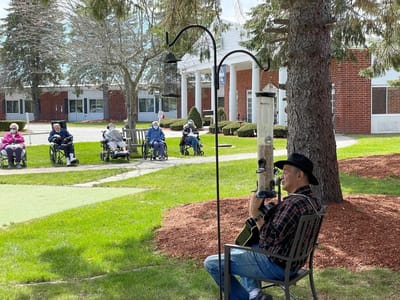
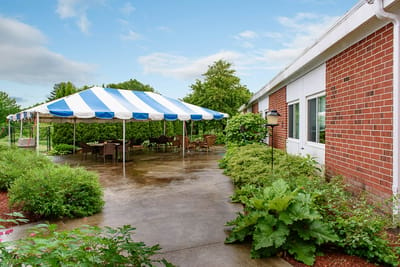
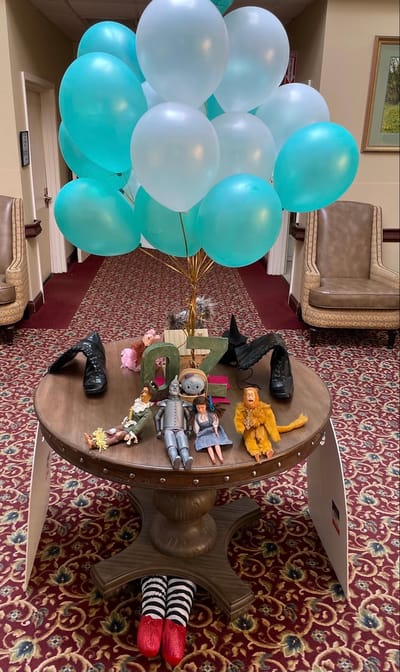
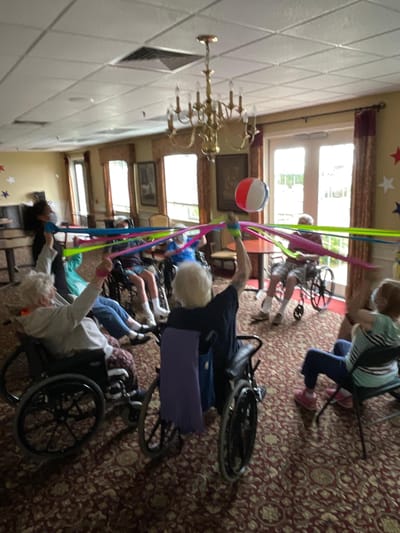
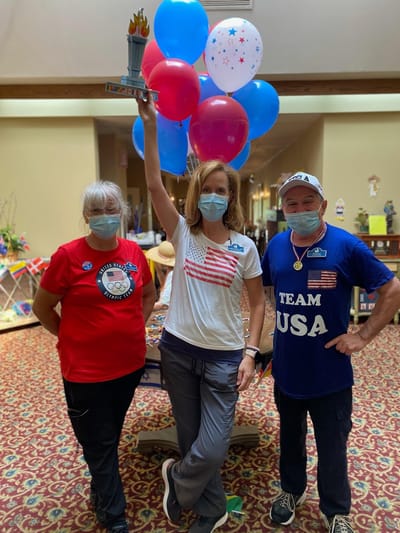
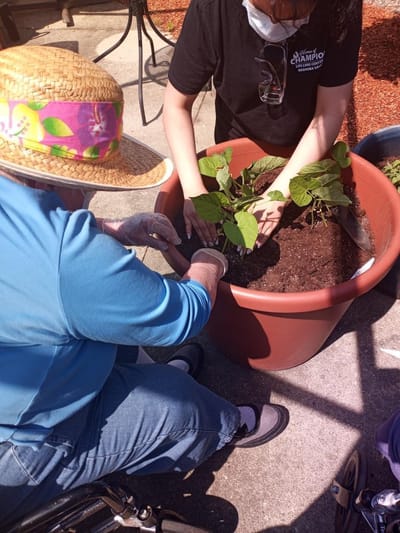
Ensuring residents’ well-being, the community conducts a jam-packed calendar of fun activities and engaging programs tailored to their leisure and wellness. Prioritizing residents’ health, diverse dining options are served based on their dietary needs and preferences. The community also hosts a Parkinson’s Support group, ensuring those with the same condition find solace in a supportive environment. Residents also enjoy the community’s beautifully maintained grounds, library, and serene courtyards, creating the perfect setting for a wondrous retirement.

(978) 486-3512

Quality ratings

Measured by Centers for Medicare & Medicaid Services (CMS)

Overall rating Info The Overall CMS Rating combines results from health inspections, staffing levels and quality measures. Health inspections carry the most weight. Staffing and quality scores can increase or decrease the final rating based on performance compared to state and national standards.
5/5 ▲ 1.8 Massachusetts average: 3.2/5
Health Inspection Info Based on the results of the facility's three most recent standard inspections and any complaint investigations. CMS reviews the number, scope, and severity of deficiencies, with more recent findings weighted more heavily.
4/5 ▲ 1.0 Massachusetts average: 3.0/5
Staffing Info Measures average nursing staff hours per resident per day, including Registered Nurses (RNs) and total nursing staff. Ratings are adjusted based on the level of care residents require and are compared to state and national benchmarks.
4/5 ▲ 0.6 Massachusetts average: 3.4/5
Quality Measures Info Based on clinical and physical health indicators reported to CMS, such as hospital readmissions, falls, pressure ulcers, and improvements in mobility. These measures reflect how well residents' health needs are being managed.
5/5 ▲ 1.7 Massachusetts average: 3.3/5

Staffing hours breakdown

Info Daily nursing hours per resident by staff type, reported to CMS. Higher is generally better — compare this facility to state and national averages to see where staffing stands.

Hours per resident per day — compared to Massachusetts state averages

Total nursing care / resident Info This home is ranked 18th out of 58 homes in Massachusetts.

Total adjusted nursing hours per resident per day, combining RN, LPN, and aide time. CMS adjusts this for case-mix so facilities can be fairly compared.
4h 9m per day
Rank #18 / 58Nurse hours — state benchmarkedThis home is ranked 18th out of 58 homes in Massachusetts.Shows adjusted nurse hours per resident per day benchmarked to the Massachusetts average, with a ranking across 58 Massachusetts SNFs. More hours mean more direct care. The national average is about 3.5 hrs; below 3.0 is a red flag.
This facility Massachusetts avg (4h 18m per day)
vs Massachusetts avg
-3%

0 of 6 metrics below state avg

Standout metric Physical Therapist is +50% above state avg
Staff typeHours / dayvs state avg
Registered Nurse (RN) Info RNs hold the highest nursing license and can assess residents, interpret test results, and direct care plans. More RN hours per day often signals stronger clinical oversight and faster response to health changes. 44m per day ▲ 13% State avg: 39m per day · National avg: 41m per day
LPN / LVN Info Licensed Practical Nurses (LPNs) or Licensed Vocational Nurses (LVNs) deliver routine hands-on care — medication administration, wound dressing, and monitoring vital signs. They work under RN supervision and make up a large share of daily bedside care. 1h 10m per day ▲ 21% State avg: 58m per day · National avg: 52m per day
Nurse Aide Info Certified Nurse Aides (CNAs) provide the most direct day-to-day assistance: bathing, dressing, feeding, and mobility. Nurse aide hours are typically the largest staffing category and directly affect residents' quality of life. 2h 23m per day ▲ 5% State avg: 2h 16m per day · National avg: 2h 21m per day
Total Nursing (Weekend) Info Combined nursing hours (RN + LPN + Nurse Aide) per resident per day on weekends. Staffing often drops on weekends — this figure reveals whether the facility maintains adequate coverage outside of weekday hours. 3h 50m per day ▲ 11% State avg: 3h 27m per day · National avg: 3h 26m per day
Physical Therapist Info Hours per resident per day provided by licensed Physical Therapists (PTs) or PT Assistants. PT services help residents recover mobility after injury or illness and are especially important for post-acute (short-stay) rehabilitation. 6m per day ▲ 50% State avg: 4m per day · National avg: 4m per day
RN (Weekend) Info Registered nurse hours specifically on weekends. Facilities sometimes reduce RN presence on Saturdays and Sundays — a low weekend RN figure compared to weekday hours can indicate reduced clinical oversight when most administrative staff are absent. 31m per day ▲ 11% State avg: 28m per day · National avg: 29m per day

Capacity and availability

This home usually has limited availability

Occupancy between 85% and 95% suggests balanced demand.

Higher occupancy than the Massachusetts average: 82%
Occupancy rate 85.4% Rank #29 / 59Occupancy rate — state benchmarkedThis home is ranked 29th out of 59 homes in Massachusetts.Shows this facility's occupancy rate versus the Massachusetts average, with its statewide rank out of 59. Higher occupancy signals strong local demand and financial stability.
Avg. Length of Stay 75 days
Occupancy rate
85.4% Rank #29 / 59Occupancy rate — state benchmarkedThis home is ranked 29th out of 59 homes in Massachusetts.Shows this facility's occupancy rate versus the Massachusetts average, with its statewide rank out of 59. Higher occupancy signals strong local demand and financial stability.
Avg. Length of Stay
75 days

Who this home usually serves

TYPE OF STAY

Mostly short-term rehab stays

Most residents typically stay for a few weeks or months before returning home or moving on.

Breakdown by payment type

Medicare

49% of new residents, usually for short-term rehab.

Typical stay 23 days

Private pay

26% of new residents, often for short stays.

Typical stay 2 - 3 months

Medicaid

25% of new residents, often for long-term daily care.

Typical stay 6 months

Finances and operations

Privately-owned community
Operated by a partnership between two or more business owners.
Home revenue
$25.7M
Operating loss
-$1.7M
Privately-owned community Operated by a partnership between two or more business owners.
Home revenue
$25.7M Rank #17 / 60Revenue — state benchmarkedThis home is ranked 17th out of 60 homes in Massachusetts.Shows this facility's annual revenue compared to the Massachusetts SNF average. Higher revenue generally means more resources for staffing and capital — read alongside Payroll %.
Operating loss
-$1.7M
Payroll costs Info The portion of the home's budget spent on staff, including nurses, caregivers, and other employees who support care and operations. Rank #27 / 60Payroll — state benchmarkedThis home is ranked 27th out of 60 homes in Massachusetts.Shows total annual staff payroll benchmarked to the Massachusetts average. Higher payroll investment relative to peers often signals better staffing and less reliance on cheaper contract labor.
$8.8M
34.1% of revenue Rank #52 / 60Payroll % — state benchmarkedThis home is ranked 52nd out of 60 homes in Massachusetts.Shows payroll as a percentage of revenue versus the Massachusetts average. Well-run SNFs often land around 55–65%. Below 25% may signal understaffing or heavy agency use — read with Staffing ratings.
Other operating costs Info All remaining costs needed to run the home, such as food, utilities, building maintenance, supplies and administrative expenses.
$18.6M
Total costs $27.4M
Years in operation
47 years in operation
A longer operating history, which may indicate experience navigating regulations and delivering ongoing care.
Walk Score
Walk Score: 5 / 100 Rank #53 / 55Walk Score — state benchmarkedThis home is ranked 53rd out of 55 homes in Massachusetts.Shows how walkable this facility's neighborhood is compared to the average Walk Score across Massachusetts SNFs. Higher scores benefit residents, families, and staff.
Car-dependent. Most errands require a car, with limited nearby walkable options.

About this community

Awards

AwardsBest nursing home in 2021-2022 by U.S. News & World Report

License Details

CMS Certification Number225569

Staffing

Key information about the people who lead and staff this community.

Leadership

ContactMs. Ellen Levinson, Executive Manager

Therapy & Rehabilitation

1 service
Rehabilitation Services

Staffing & Medical

1 service
24-Hour Staffing

Additional Services

1 service
Alzheimer's And Dementia Care

Amenities & Lifestyle

24-Hour Security And Fire Safety Systems
Beauty Salon And Barber Shop
Bedside And Bathroom Call Lights
Certified Dietitian
Community Re-Entry Program
Complimentary Wireless Internet
Daily Activity Schedule
Family/Resident Councils
Fine Dining Program
Flat-Screen Tvs
Flexible Visiting Hours
Full-Time
Certified Activity Director
Homelike Setting
Housekeeping And Laundry Services
Landscaped Grounds And Courtyards
Library
Non-Smoking Facility
Pet Visitors Allowed
Private And Semiprivate Rooms
Private Bathrooms
Religious Services
Patient/Family Education Program
Telephone And Cable Television Hookups
Transportation Services
Specific ProgramsParkinson's Support
Religious ServicesYes

What does this home offer?

Accepts Medicaid icon

Accept Medicaid: Yes

Pets allowed icon
Pets allowed icon

Pets Allowed: Yes, Pets Allowed

Housing options icon

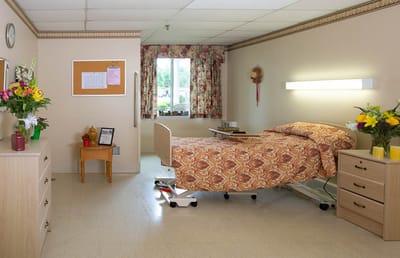
Housing Options: Private / Semi-Private Rooms

Building type icon
Building type icon

Building Type: Single-story

Dining services icon

Dining Services

Beauty services icon

Beauty Services

Transportation services icon

Transportation Services

Housekeeping icon
Housekeeping icon

Housekeeping Services

Recreational activities icon

Recreational Activities

Exercise program icon

Exercise Programs

Types of Care at Life Care Center of Nashoba Valley

Nursing Home

Contact Life Care Center of Nashoba Valley

Inspection History

In Massachusetts, the Executive Office of Elder Affairs (for assisted living facilities) and the Department of Public Health (for nursing homes) are the agencies authorized to inspect and report on facility safety.

3 visits/inspections Info Inspections are mandatory, regular evaluations conducted by state health departments or regulatory agencies. They ensure the community provides safe, compliant care, covering areas like resident health, staff and management.

Massachusetts average: 21 visits/inspections

Massachusetts average: 22 complaint visits

Massachusetts average: 4 inspections

Latest inspection

Date August 14, 2025
Routine

15 deficiencies

Deficiencies indicate regulatory issues. A higher number implies the facility had several areas requiring improvement.

Massachusetts average: 28 deficiencies

Inspection Report Summary for Life Care Center of Nashoba Valley

The most recent inspection on August 14, 2025, found deficiencies related to care planning, medication management, and medication storage. Earlier inspections also identified issues with care plans, medication regimen reviews, resident dignity, supervision during meals, fall prevention, and sanitary food handling. The main themes across reports involved incomplete or untimely care plan updates and medication-related practices, including failure to act on pharmacist recommendations and proper medication storage. No fines, immediate jeopardy findings, or enforcement actions were listed in the available reports, and no complaint investigations were noted. The pattern of deficiencies has been consistent over time, with similar issues appearing in multiple inspections.

Health Inspection History

Inspections
Total health inspections 3

Massachusetts average 4.5


Last Health inspection on Aug 2025

Total health citations
15 Rank #14 / 57Health citations — state benchmarkedThis home is ranked 14th out of 57 homes in Massachusetts.Shows this facility's total health deficiency citations benchmarked to the Massachusetts state average, with a ranking across all 57 MA SNFs. Lower citation counts earn a better rank.

Massachusetts average 32.7

Citations per inspection
5 Rank #18 / 57Citations per inspection — state benchmarkedThis home is ranked 18th out of 57 homes in Massachusetts.Shows average deficiency citations per CMS inspection for this facility versus the Massachusetts mean across 57 SNFs with citation data. Lower is better.

Massachusetts average 7.24


Health citations are formal notices following inspections when they fail to comply with safety and care standards.

All 15 citations resulted from standard inspections.

Breakdown of citation severity (last 3 years)
Critical Health citations More info
0
100% better than Massachusetts average

Massachusetts average: 0.3


Serious Health citations More info 0
100% better than Massachusetts average

Massachusetts average: 1.5

0 critical citations More info Massachusetts average: 0.3

0 serious citations More info Massachusetts average: 1.5

15 moderate citations More info Massachusetts average: 29.7

0 minor citations More info Massachusetts average: 1.3
Citations history (last 3 years)
Pharmacy moderate citation Info Issues related to medication management, including how drugs are stored, administered, and monitored. Aug 14, 2025
Corrected

Pharmacy moderate citation Info Issues related to medication management, including how drugs are stored, administered, and monitored. Aug 14, 2025
Corrected

Care Planning moderate citation Info Issues related to creating and updating personalized care plans for residents based on their needs and conditions. Aug 14, 2025
Corrected

Care Planning moderate citation Info Issues related to creating and updating personalized care plans for residents based on their needs and conditions. Aug 14, 2025
Corrected

Financial Assistance for
Nursing Home in Massachusetts

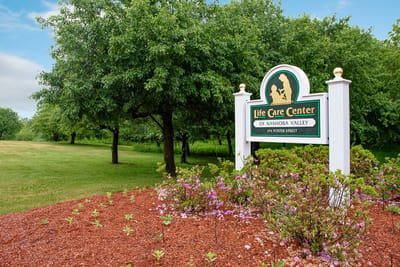
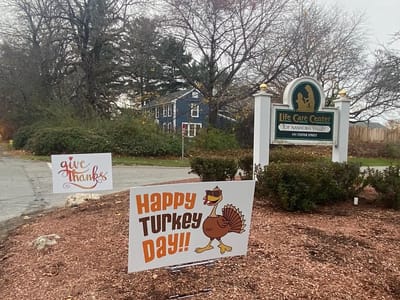
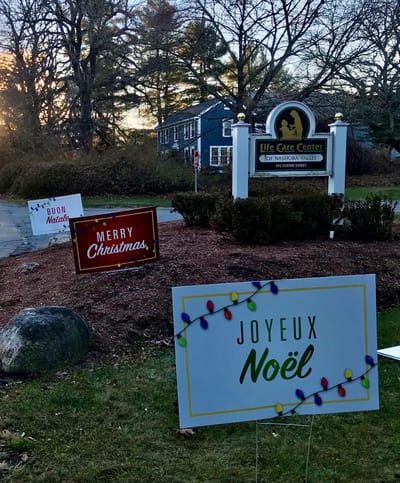
Life Care Center of Nashoba Valley is located in Littleton, Massachusetts.
Here are the financial assistance programs available to residents in Massachusetts.

Get Financial aid guidance

Home Care Program

MassHealth Home Care

Age 60+
General Massachusetts resident, at risk of nursing home placement.
Income Limits (2025) ~$1,500/month individual, varies by region
Asset Limits $2,000 individual, excludes home, car
MA

Coordinated through Aging Services Access Points (ASAPs); high demand in urban areas.

Benefits
In-home care (3-5 hours/day) Homemaker services Respite care (up to 14 days/year) Adult day care (~$75/day)

Frail Elder Waiver

Massachusetts Medicaid FE Waiver

Age 65+
General Massachusetts resident, Medicaid-eligible, nursing home-level care need.
Income Limits (2025) ~$2,829/month 300% FBR, individual
Asset Limits $2,000 (individual), $3,000 (couple).
MA

Requires clinical eligibility determination.

Benefits
Personal care (5-7 hours/day) Respite care (240 hours/year) Adult day care (~$75/day) Home health services

Senior Care Options (SCO)

Massachusetts Senior Care Options

Age 65+
General Massachusetts resident, eligible for MassHealth (Medicare optional), nursing home-level care need.
Income Limits (2025) ~$2,829/month (300% FBR, individual); QIT allowed.
Asset Limits $2,000 (individual), $3,000 (couple) (excludes home up to $713,000, car).
MA

Not available in Dukes/Nantucket Counties; multiple SCO providers (e.g., CCA, Tufts).

Benefits
Personal care (5-7 hours/day) Medical care Respite (240 hours/year) Adult

Medicare Savings Program (MSP)

Massachusetts Medicare Savings Program (MassHealth Buy-In)

Age 65+ or disabled
General Massachusetts resident, Medicare Part A/B.
Income Limits (2025) ~$2,510/month (QMB), ~$3,380/month (SLMB), ~$3,598/month (QI)—individual.
Asset Limits $9,430 (individual), $14,130 (couple).
MA

Three tiers; no waitlist; includes Extra Help for Part D.

Benefits
Covers Part B premiums ($174.70/month) Deductibles ($240/year) Copays (~20%)

National Family Caregiver Support Program (NFCSP) Respite

Massachusetts NFCSP Respite Care

Age
General Caregivers of 60+ needing care or 55+ caregivers of others; Massachusetts resident; functional needs (2+ ADLs).
Income Limits (2025) Prioritizes ~$24,980/year (individual); no strict cap.
Asset Limits Not assessed; need-based.
MA

27 ASAPs; prioritizes low-income, rural caregivers.

Benefits
Respite (4-6 hours/week or 5 days/year) Adult day care ($60/day) Caregiver training Supplies (~$500/year)

Prescription Advantage

Massachusetts Prescription Advantage

Age 65+ or disabled
General Massachusetts resident, enrolled in Medicare Part D (or ineligible for Medicare).
Income Limits (2025) No strict limit; copays vary by income ~$24,980-$75,000/year individual
Asset Limits Not assessed.
MA

Supplements Medicare Part D; no enrollment fee for low-income.

Benefits
Covers prescription copays ($5-$40/drug) Fills coverage gaps Catastrophic cost protection ($4,000+ covered)

Senior Community Service Employment Program (SCSEP)

Massachusetts SCSEP

Age 55+
General unemployed, low-income, Massachusetts resident.
Income Limits (2025) ~$1,983/month 125% FPL
Asset Limits Not specified; income-focused.
MA

Priority for veterans, rural residents; AARP partnership.

Benefits
Paid training (~20 hours/week at ~$15/hour) Job placement

VA Aid and Attendance (A&A) and Housebound Benefits

Massachusetts VA Aid and Attendance/Housebound

Age 65+ or disabled veteran/spouse
General Massachusetts resident, wartime service, need for ADL help (A&A) or homebound.
Income Limits (2025) Net income < ~$1,984/month (veteran with dependent, A&A); pension offsets income.
Asset Limits ~$155,356 net worth limit
MA

High veteran demand statewide.

Benefits
Cash (~$1,433-$2,642/month veteran, ~$951-$1,318 spouse) for care costs (e.g., in-home, assisted living)

Places of interest near Life Care Center of Nashoba Valley

Address 1.7 miles from city center Info Estimated distance in miles from Littleton's city center to Life Care Center of Nashoba Valley's address, calculated via Google Maps.

Calculate Travel Distance to Life Care Center of Nashoba Valley

Add your location

Address

Staffing Data (Q2 2025)

This data corresponds to Q2 2025 and is based on CMS Payroll-Based Journal.

Total staff 231
Employees 146
Contractors 85
Staff to resident ratio 2.06:1
21% better than Massachusetts average

Massachusetts average ratio: 1.70:1

Avg staff/day 71
Average shift 8.3 hours
5% better than Massachusetts average

Massachusetts average: 7.9 hours

Total staff hours (quarter) 53,418
Nursing staff breakdown
Registered Nurse

Manages medical care and health needs.

Total count 71
Average shift length Info Average shift length. Calculated as total hours divided by days worked and average staff per day. 9.3 hours

This role is partially covered by contractors.

Licensed Practical Nurse

Assists with medical care and medications.

Total count 43
Average shift length Info Average shift length. Calculated as total hours divided by days worked and average staff per day. 8.4 hours

This role is partially covered by contractors.

Certified Nursing Assistant

Helps with daily care and mobility.

Total count 58
Average shift length Info Average shift length. Calculated as total hours divided by days worked and average staff per day. 8.5 hours

No contractors work on this role.

Contractor staffing

Total hours from contractors

6.7%

3,581 contractor hours this quarter

Registered Nurse: 58 Licensed Practical Nurse: 21 Occupational Therapy Assistant: 5 Medical Director: 1
Staff by category
Certified Nursing Assistant5805824,94891100%8.5
Licensed Practical Nurse2221438,27591100%8.4
Registered Nurse1358716,67091100%9.3
Other Dietary Services Staff8082,43691100%7
Clinical Nurse Specialist5051,4496470%8.7
Physical Therapy Aide6061,3058897%6.3
Physical Therapy Assistant6061,2778998%6.8
Speech Language Pathologist7071,0838796%6.4
Respiratory Therapy Technician3031,0687785%7.4
RN Director of Nursing5051,0666673%8.2
Dietitian3035725560%8.2
Nurse Practitioner2025606066%8
Administrator1015206571%8
Qualified Social Worker2024906369%7.4
Occupational Therapy Aide1014745156%9.3
Mental Health Service Worker1014565763%8
Dental Services Staff1014205662%7.5
Nurse Aide in Training1012533134%8.2
Occupational Therapy Assistant05553910%4.8
Medical Director0113233%10.5
Other Physician1011233%4
58 Certified Nursing Assistant
% of Days 100%
43 Licensed Practical Nurse
% of Days 100%
71 Registered Nurse
% of Days 100%
8 Other Dietary Services Staff
% of Days 100%
5 Clinical Nurse Specialist
% of Days 70%
6 Physical Therapy Aide
% of Days 97%
6 Physical Therapy Assistant
% of Days 98%
7 Speech Language Pathologist
% of Days 96%
3 Respiratory Therapy Technician
% of Days 85%
5 RN Director of Nursing
% of Days 73%
3 Dietitian
% of Days 60%
2 Nurse Practitioner
% of Days 66%
1 Administrator
% of Days 71%
2 Qualified Social Worker
% of Days 69%
1 Occupational Therapy Aide
% of Days 56%
1 Mental Health Service Worker
% of Days 63%
1 Dental Services Staff
% of Days 62%
1 Nurse Aide in Training
% of Days 34%
5 Occupational Therapy Assistant
% of Days 10%
1 Medical Director
% of Days 3%
1 Other Physician
% of Days 3%

Facility Characteristics

Source: CMS Long-Term Care Facility Characteristics (Data as of Jan 2026)

Total residents 112
Medicare
19
17% of residents
Medicaid
56
50% of residents
Private pay or other
37
33% of residents
Programs & Services
Residents Group

Residents meet regularly to discuss policies, care quality, and activities

Active Resident Council

Organized group of residents that meets regularly to discuss facility policies, quality of life, and activities.

Quality of care over time

These measures show how residents usually do over time at this home, based on health outcomes and preventive care.

High-risk clinical events score Info A composite score based on pressure ulcers, falls with injury, weight loss, walking ability decline, and activities of daily living decline. 6.2
39% better than Massachusetts average

Massachusetts average: 10.2

Functional decline score Info A composite score based on activities of daily living decline, walking ability decline, and incontinence. 12.9
35% better than Massachusetts average

Massachusetts average: 20.0

Long-stay resident measures
Above average Massachusetts avg: 3.6 Info CMS star rating based on long-stay quality measure performance. 5 stars = significantly above average, 1 star = significantly below average.
Need for Help with Daily Activities Increased Info Percent of long-stay residents whose need for help with daily activities has increased 7.1%
62% better than Massachusetts average

Massachusetts average: 18.7%

Walking Ability Worsened Info Percent of long-stay residents whose ability to move independently worsened 5.6%
71% better than Massachusetts average

Massachusetts average: 19.3%

Low Risk Residents with Bowel/Bladder Incontinence Info Percent of low risk long-stay residents who lose control of their bowels or bladder 26.1%
18% worse than Massachusetts average

Massachusetts average: 22.1%

Falls with Major Injury Info Percent of long-stay residents experiencing one or more falls with major injury 4.6%
27% worse than Massachusetts average

Massachusetts average: 3.6%

High Risk Residents with Pressure Ulcers Info Percent of long-stay high risk residents with pressure ulcers 7.4%
58% worse than Massachusetts average

Massachusetts average: 4.7%

Urinary Tract Infection Info Percent of long-stay residents with a urinary tract infection 1.2%
44% better than Massachusetts average

Massachusetts average: 2.1%

Lost Too Much Weight Info Percent of long-stay residents who lose too much weight 6.6%
27% worse than Massachusetts average

Massachusetts average: 5.2%

Depressive Symptoms Info Percent of long-stay residents who have depressive symptoms 9.1%
15% better than Massachusetts average

Massachusetts average: 10.7%

Antipsychotic Use Info Percent of long-stay residents who received an antipsychotic medication 24.3%
20% worse than Massachusetts average

Massachusetts average: 20.3%

Pneumococcal Vaccine Info Percent of long-stay residents assessed and appropriately given the pneumococcal vaccine 95.7%
In line with Massachusetts average

Massachusetts average: 91.9%

Influenza Vaccine Info Percent of long-stay residents assessed and appropriately given the seasonal influenza vaccine 92.4%
In line with Massachusetts average

Massachusetts average: 94.8%

Hospitalizations per 1,000 days Info Number of hospitalizations per 1,000 long-stay resident days. 1.15
38% better than Massachusetts average

Massachusetts average: 1.86

ED visits per 1,000 days Info Number of outpatient emergency department visits per 1,000 long-stay resident days. 1.75
14% worse than Massachusetts average

Massachusetts average: 1.54

Short-stay resident measures
Significantly above average Massachusetts avg: 3.2 Info CMS star rating based on short-stay quality measure performance. 5 stars = much above average, 1 star = much below average.
Pneumococcal Vaccine Info Percent of short-stay residents assessed and appropriately given the pneumococcal vaccine 94.2%
23% better than Massachusetts average

Massachusetts average: 76.7%

Antipsychotic medication increase Info Percent of short-stay residents who newly received an antipsychotic medication 0.2%
83% better than Massachusetts average

Massachusetts average: 1.3%

Influenza Vaccine Info Percent of short-stay residents assessed and appropriately given the seasonal influenza vaccine 89.3%
15% better than Massachusetts average

Massachusetts average: 77.7%

Re-hospitalized after SNF stay Info Percentage of short-stay residents who were re-hospitalized after their nursing home admission. 19.5%
24% better than Massachusetts average

Massachusetts average: 25.8%

Emergency department visits Info Percentage of short-stay residents who had an outpatient emergency department visit. 13.0%
10% worse than Massachusetts average

Massachusetts average: 11.8%

Falls with major injury Info Percentage of SNF residents who experience falls with major injury during their stay. 1.7%
123% worse than Massachusetts average

Massachusetts average: 0.8%

Ability to care for self at discharge Info Percentage of residents at or above expected ability to care for themselves at discharge. 80.1%
49% better than Massachusetts average

Massachusetts average: 53.7%

Successful return to home or community Info Rate of successful return to home or community from a skilled nursing facility. 66.8%
32% better than Massachusetts average

Massachusetts average: 50.6%

Penalties and fines

Federal penalties imposed by CMS for regulatory violations, including civil money penalties (fines) and denials of payment for new Medicare/Medicaid admissions.

Source: CMS Penalties Database

Penalty History

Penalties are imposed by CMS for violations of federal nursing home regulations.

No penalties in the past 3 years

No civil money penalties or payment denials were reported in the last 3 years.

Compare Nursing Homes around Middlesex County The information below is reported by the Massachusetts Executive Office of Elder Affairs and Department of Public Health.

5 facilities compared · CMS & MA Dept. of Health data · Updated Apr 2026

Filter by care type
Lasell Village
NH

Nursing Home Licensed facility providing 24/7 skilled nursing care for residents with complex, ongoing medical needs. Staffed by RNs, LPNs, and CNAs. Inspected and star-rated annually by CMS. Accepts Medicare (short-term rehab) and Medicaid (long-term care).

Newton (Auburndale)38 63.3% -23%6.86 +65%+74%063.0022- 52 Vianello, Alessandro$30.1M$8.7M28.9%225755
Life Care Center of Nashoba Valley
NH

Nursing Home Licensed facility providing 24/7 skilled nursing care for residents with complex, ongoing medical needs. Staffed by RNs, LPNs, and CNAs. Inspected and star-rated annually by CMS. Accepts Medicare (short-term rehab) and Medicaid (long-term care).

Littleton120 85.4% +4%4.16 +137%+6%0155.00111- 5 Laroche, Shari$25.7M$8.8M34.1%225569
Life Care Center of Acton
NH

Nursing Home Licensed facility providing 24/7 skilled nursing care for residents with complex, ongoing medical needs. Staffed by RNs, LPNs, and CNAs. Inspected and star-rated annually by CMS. Accepts Medicare (short-term rehab) and Medicaid (long-term care).

Acton (East Acton)143 74.2% -9%3.73 -28%-5%1165.31119- 39 Foye, Christopher$21.6M$7.8M36%225191
Belmont Manor Nursing & Rehabilitation Center
MC

Memory Care Secured, specialized care for people living with Alzheimer's or dementia. Staff trained in cognitive impairment, with higher staff-to-resident ratios and an environment designed to reduce confusion and wandering risk.

NH

Nursing Home Licensed facility providing 24/7 skilled nursing care for residents with complex, ongoing medical needs. Staffed by RNs, LPNs, and CNAs. Inspected and star-rated annually by CMS. Accepts Medicare (short-term rehab) and Medicaid (long-term care).

Belmont (Waverley Square)135 95.3% +16%4.72 +43%+20%2287.01124A+ 79 Karger, Stewart$21.7M$12.6M58.2%225419
Life Care Center of Merrimack Valley
NH

Nursing Home Licensed facility providing 24/7 skilled nursing care for residents with complex, ongoing medical needs. Staffed by RNs, LPNs, and CNAs. Inspected and star-rated annually by CMS. Accepts Medicare (short-term rehab) and Medicaid (long-term care).

Billerica (North Billerica)124 85.8% +5%4.24 +13%+8%1317.80103- 40 Babb, Karen$22.5M$8.1M36%225546

Guides for Better Senior Living

Care Cost Calculator: See Prices in Your Area

Nursing Home Data Explorer

Don’t Wait Too Long: 7 Red Flag Signs Your Parent Needs Assisted Living Now

The True Cost of Assisted Living in 2025 – And How Families Are Paying For It

Understanding Senior Living Costs: Pricing Models, Discounts & Financial Assistance

Explore Open Rooms
1 Contact details
2 What type of senior care service are you looking for?
3 What budget do you have in mind for senior care?
4 How soon do you need to find care?
5 Additional details

Thank you for your interest!

Our team will be in touch shortly to help with next steps.