Belmont Manor Nursing & Rehabilitation Center
Nursing Home & Memory Care · Middlesex County, MA
CMS overall rating Info The Overall CMS Rating is scored from 1 to 5 stars and combines results from health inspections, staffing levels, and quality measures. Health inspections carry the most weight. Staffing and quality scores can increase or decrease the final rating based on performance compared to state and national standards.

Belmont Manor Nursing & Rehabilitation Center

Nursing Home & Memory Care · Middlesex County, MA
CMS overall rating Info The Overall CMS Rating is scored from 1 to 5 stars and combines results from health inspections, staffing levels, and quality measures. Health inspections carry the most weight. Staffing and quality scores can increase or decrease the final rating based on performance compared to state and national standards.
Calculator: See prices in your area
Belmont Manor Nursing & Rehabilitation Center accepts Medicaid, Medicare, and private pay.

Overview of Belmont Manor Nursing & Rehabilitation Center

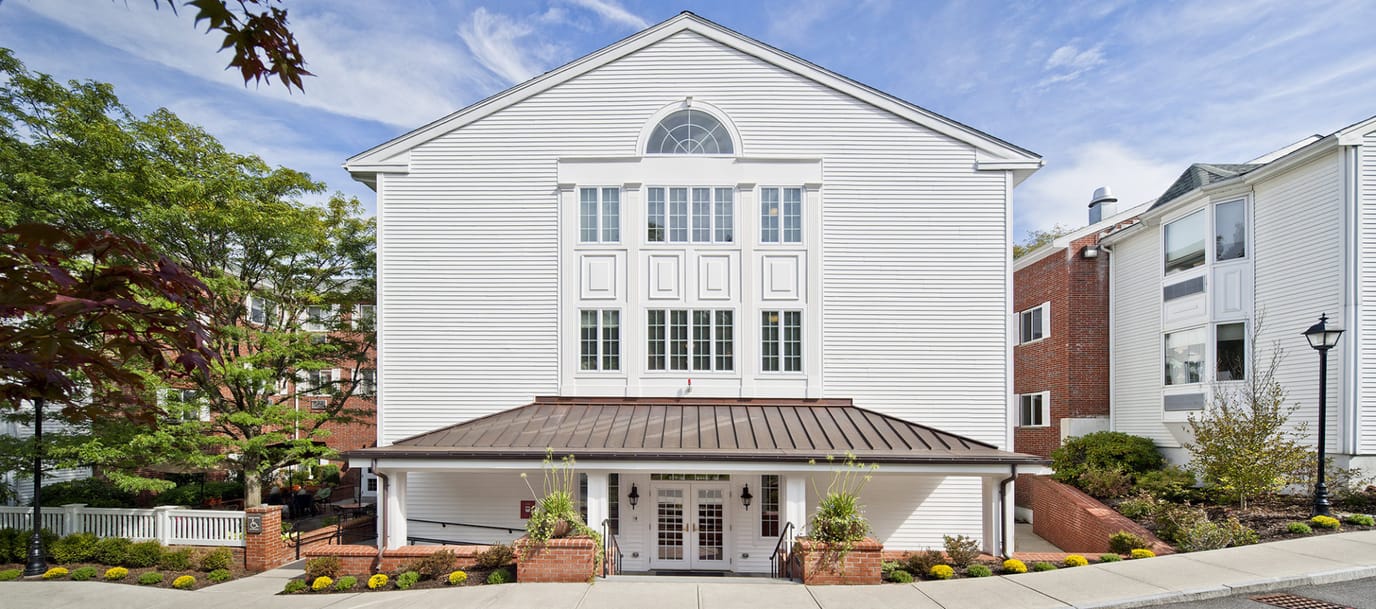
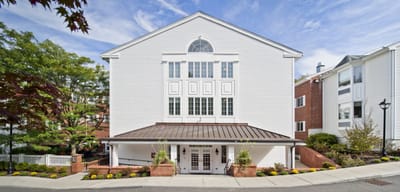
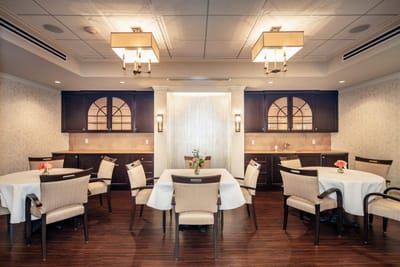
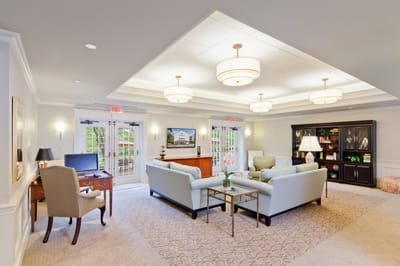
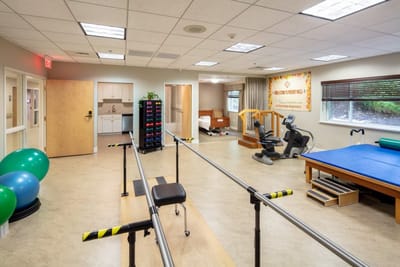
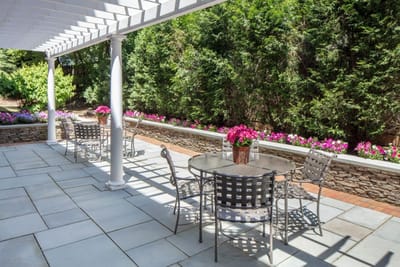
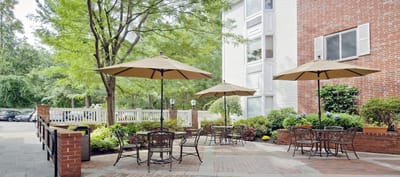
Belmont Manor is an idyllic community located near recreation sites and convenient local amenities on Agassiz Avenue, Belmont, MA, that offers skilled nursing. The community features a wide range of care options, including podiatry, respite care, short-term rehabilitation, and therapy services, alongside Alzheimer’s special care unit, ensuring residents can find the care they need. As a Medicaid- and Medicare-certified community, the community strives to ease residents’ financial challenges.

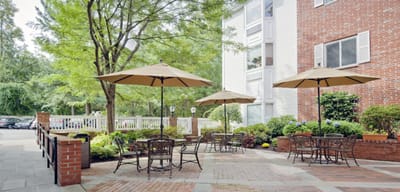
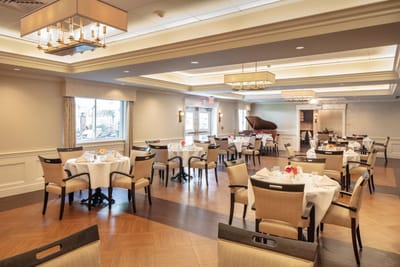
Aside from their healthcare needs, the community also conducts fun recreational activities and engaging social events to keep residents active and happy. Accommodating residents’ dietary needs, dietitian-approved meals are served for a delightful dining experience. The community is great for those who need supplementary care to live comfortably in their golden years.

Quality ratings

Measured by Centers for Medicare & Medicaid Services (CMS)

Overall rating Info The Overall CMS Rating combines results from health inspections, staffing levels and quality measures. Health inspections carry the most weight. Staffing and quality scores can increase or decrease the final rating based on performance compared to state and national standards.
▼ 6.5% Below MA avg. ▼ 6.5% Below MA avg.Click the badge to see the full State ranking.Click here to see the full State ranking.
Health Inspection Info Based on the results of the facility's three most recent standard inspections and any complaint investigations. CMS reviews the number, scope, and severity of deficiencies, with more recent findings weighted more heavily.
▼ 33.3% Below MA avg. ▼ 33.3% Below MA avg.Click the badge to see the full State ranking.Click here to see the full State ranking.
Staffing Info Measures average nursing staff hours per resident per day, including Registered Nurses (RNs) and total nursing staff. Ratings are adjusted based on the level of care residents require and are compared to state and national benchmarks.
▲ 45.8% Above MA avg. ▲ 45.8% Above MA avg.Click the badge to see the full State ranking.Click here to see the full State ranking.
Quality Measures Info Based on clinical and physical health indicators reported to CMS, such as hospital readmissions, falls, pressure ulcers, and improvements in mobility. These measures reflect how well residents' health needs are being managed.
▼ 39.2% Below MA avg. ▼ 39.2% Below MA avg.Click the badge to see the full State ranking.Click here to see the full State ranking.

Staffing hours breakdown

Info Daily nursing hours per resident by staff type, reported to CMS. Higher is generally better — compare this facility to state and national averages to see where staffing stands.

Hours per resident per day — compared to Massachusetts state averages

Total nursing care / resident Info This home is ranked 11th out of 89 homes in Massachusetts. Total adjusted nursing hours per resident per day, combining RN, LPN, and aide time. CMS adjusts this for case-mix so facilities can be fairly compared.
4h 43m per day
Rank #11 / 89Nurse hours — State benchmarkedThis home is ranked 11th out of 89 homes in Massachusetts. Shows adjusted nurse hours per resident per day benchmarked to the Massachusetts average, with a ranking across 89 Massachusetts SNFs. More hours mean more direct care. The national average is about 3.5 hrs; below 3.0 is a red flag.Click the rank badge to see the full State ranking.Click here to see the full State ranking.
This facility Massachusetts avg (4h 18m per day)
vs Massachusetts avg
+10%

0 of 1 metrics below state avg

Standout metric Total Nursing (Weekend) is +14% above state avg
Staff typeHours / Day / Residentvs state avg
Total Nursing (Weekend) Info Combined nursing hours (RN + LPN + Nurse Aide) per resident per day on weekends. Staffing often drops on weekends — this figure reveals whether the facility maintains adequate coverage outside of weekday hours. 3h 56m per day ▲ 14% State avg: 3h 27m per day · National avg: 3h 26m per day

Types of Care at Belmont Manor Nursing & Rehabilitation Center

Nursing Home Memory Care

Capacity and availability

This home usually has availability

Occupancy lower than 85% suggests more openings may be available.

Lower occupancy than the Massachusetts average: 82%
Occupancy rate 14.1% Rank #91 / 91Occupancy rate — State benchmarkedThis home is ranked 91st out of 91 homes in Massachusetts. Shows this facility's occupancy rate versus the Massachusetts average, with its Statewide rank out of 91. Higher occupancy signals strong local demand and financial stability.Click the rank badge to see the full State ranking.Click here to see the full State ranking.
Avg. Length of Stay 151 days
Occupancy rate
14.1% Rank #91 / 91Occupancy rate — State benchmarkedThis home is ranked 91st out of 91 homes in Massachusetts. Shows this facility's occupancy rate versus the Massachusetts average, with its Statewide rank out of 91. Higher occupancy signals strong local demand and financial stability.Click the rank badge to see the full State ranking.Click here to see the full State ranking.
Avg. Length of Stay
151 days
Walk Score
Walk Score: 79 / 100 Rank #13 / 93Walk Score — State benchmarkedThis home is ranked 13th out of 93 homes in Massachusetts. Shows how walkable this facility's neighborhood is compared to the average Walk Score across Massachusetts SNFs. Higher scores benefit residents, families, and staff.Click the rank badge to see the full State ranking.Click here to see the full State ranking.
Very walkable. Most errands can be accomplished on foot, and many essentials are within a short walk.
BBB Rating
BBB Rating: A+ (Not Accredited)
An independent rating from the Better Business Bureau based on factors such as complaint history, transparency, and business practices.
How BBB ratings work

About this community

Staffing

Key information about the people who lead and staff this community.

Leadership

ContactMr. Stewart Karger, Vice President

Payment & Insurance

1 service
Accept Medicaid

Therapy & Rehabilitation

3 services
Rehabilitation Services
Respite Care
Short-Term Rehab

Amenities & Lifestyle

Skilled And Intermediate Levels Of Nursing Care
Short Term Rehabilitation
Licensed Social Worker
Physical Therapy
Occupational Therapy
Speech Therapy
Audiology
Podiatry
Ophthalmology
Comprehensive Dental Services
Alzheimer’s Special Care Unit
Medicaid-Certified
Medicare-Certified
Dieticians
Special Diets
Full Activity Program Including External Activities
Barber And Beautician Services
Full Laundry Services
Weekly Religious Services
Telephone
Wi-Fi (First Floor)
Specific ProgramsEnvironmental Services, Special Care Unit
Religious ServicesYes

Contact Belmont Manor Nursing & Rehabilitation Center

Inspection History

In Massachusetts, the Executive Office of Elder Affairs (for assisted living facilities) and the Department of Public Health (for nursing homes) are the agencies authorized to inspect and report on facility safety.

Since 2022 · 4 years of data 27 citations

Inspection Scorecard Info This scorecard compares key inspection, citation, and complaint metrics at this facility against the Massachusetts state average. Metrics rated ≥15% worse than average are highlighted in red; those ≥15% better are highlighted in green.

Since 2022 vs. Massachusetts state average
Overall vs. MA average 2 Worse Metrics worse than Massachusetts average:
• Total citations (93% above)
• Citations per year (94% above)
0 Better No metrics in this bucket.
Latest Inspection December 5, 2024 Routine

Citations Info Citations are formal regulatory issues recorded during state inspections.

This FacilityMA Averagevs. MA Avg
Total citations Info Formal regulatory issues recorded by inspectors across all inspection types. 2714 This facility has 93% more total citations than a typical Massachusetts nursing home (27 vs. MA avg 14).↑ 93% worse
Citations per year Info Average citations per year since 2022. 6.83.5 This facility has 94% more citations per year than a typical Massachusetts nursing home (6.8 vs. MA avg 3.5).↑ 94% worse

Inspection Reports Summary Info An editor-reviewed summary of the themes and findings across this facility's recent inspection reports.

The most recent inspection on December 5, 2024, identified multiple deficiencies related to resident care, medication management, respiratory care, nutrition, documentation, and infection control. Earlier inspections showed similar issues, including medication self-administration without authorization, inadequate meal assistance, infection control lapses, and care planning deficiencies. A substantiated complaint investigation in July 2023 found the facility failed to properly assess and document after a resident’s unwitnessed fall, resulting in actual harm. Enforcement actions such as fines or license suspensions were not listed in the available reports. The pattern of findings suggests ongoing challenges with care planning and resident safety, with no clear improvement trend over time.

Read the full inspection reports for this facility, including detailed findings and corrective actions.

Show Inspection Reports

Health Inspection History

Inspections Since 2022
Total health inspections 4

Massachusetts average 4.5


Last Health inspection on Dec 2024

Total health citations
28 Rank #48 / 89Health citations — State benchmarkedThis home is ranked 48th out of 89 homes in Massachusetts. Shows this facility's total health deficiency citations benchmarked to the Massachusetts State average, with a ranking across all 89 MA SNFs. Lower citation counts earn a better rank.Click the rank badge to see the full State ranking.Click here to see the full State ranking.

Massachusetts average 32.7

Citations per inspection
7 Rank #56 / 89Citations per inspection — State benchmarkedThis home is ranked 56th out of 89 homes in Massachusetts. Shows average deficiency citations per CMS inspection for this facility versus the Massachusetts mean across 89 SNFs with citation data. Lower is better.Click the rank badge to see the full State ranking.Click here to see the full State ranking.

Massachusetts average 7.24


Health citations are formal notices following inspections when they fail to comply with safety and care standards.

27 of 28 citations resulted from standard inspections; and 1 of 28 resulted from complaint investigations.

Breakdown of citation severity (last 4 years)
Critical Health citations
0
100% better than Massachusetts average

Massachusetts average: 0.3


Serious Health citations
1 Rank #1 / 54Serious citations (G–I) — State benchmarkedThis home is ranked 1st out of 54 homes in Massachusetts. Shows G–I scope serious health citations for this facility versus other Massachusetts SNFs. Lower counts rank better.Click the rank badge to see the full State ranking.Click here to see the full State ranking.
33% better than Massachusetts average

Massachusetts average: 1.5

0 critical citations Massachusetts average: 0.3

1 serious citation Massachusetts average: 1.5

27 moderate citations Massachusetts average: 29.7

0 minor citations Massachusetts average: 1.3
Citations history (last 4 years)
Abuse/Neglect moderate citation Dec 05, 2024
Corrected

Abuse/Neglect moderate citation Dec 05, 2024
Corrected

Infection Control moderate citation Dec 05, 2024
Corrected

Quality of Care moderate citation Dec 05, 2024
Corrected

Staffing Data

Reporting period: October 1 – December 31, 2025 (Q4 2025). Source: CMS Payroll-Based Journal report.

Total staff 160
Employees 138
Contractors 22
Staff to resident ratio 1.29:1
24% worse than Massachusetts average
Massachusetts average ratio: 1.70:1 Massachusetts average ratio: 1.70:1See full Massachusetts ranking
Avg staff/day 77
Average shift 8.1 hours
0% compared with Massachusetts average
Massachusetts average: 7.9 hours Massachusetts average shift: 7.9 hoursSee full Massachusetts ranking
Total staff hours (quarter) 57,243

Nursing staff breakdown

Q4 2025 · Oct 1 – Dec 31 More info This data comes from the CMS Payroll-Based Journal report covering October 1 – December 31, 2025.
Registered Nurse

Manages medical care and health needs.

Total count 22
Average shift length Info Average shift length. Calculated as total hours divided by days worked and average staff per day. 8.8 hours

This role is partially covered by contractors.

Licensed Practical Nurse

Assists with medical care and medications.

Total count 26
Average shift length Info Average shift length. Calculated as total hours divided by days worked and average staff per day. 8.7 hours

This role is partially covered by contractors.

Certified Nursing Assistant

Helps with daily care and mobility.

Total count 75
Average shift length Info Average shift length. Calculated as total hours divided by days worked and average staff per day. 8.2 hours

No contractors work on this role.

Contractor staffing

Q4 2025 · Oct 1 – Dec 31 More info This data comes from the CMS Payroll-Based Journal report covering October 1 – December 31, 2025.

Total hours from contractors

1.8%

1,018 contractor hours this quarter

Registered Nurse: 13 Licensed Practical Nurse: 5 Medical Director: 2 Occupational Therapy Aide: 1 Qualified Social Worker: 1

Staff by category

Q4 2025 · Oct 1 – Dec 31 More info This data comes from the CMS Payroll-Based Journal report covering October 1 – December 31, 2025.
Certified Nursing Assistant7507533,99792100%8.2
Licensed Practical Nurse215268,12392100%8.7
Registered Nurse913224,38592100%8.8
Clinical Nurse Specialist7072,5888592%8.2
Other Dietary Services Staff6061,99392100%7
Physical Therapy Assistant5058998087%5.8
Respiratory Therapy Technician5058498491%6.1
RN Director of Nursing2027506166%8.1
Dental Services Staff2026485863%7.4
Dietitian1014776267%7.7
Nurse Practitioner1014756267%7.7
Administrator1014556065%7.6
Qualified Social Worker0114435459%8.2
Physical Therapy Aide1013645964%6.2
Occupational Therapy Aide0113355762%5.9
Speech Language Pathologist1013274145%8
Mental Health Service Worker101821314%6.3
Medical Director0225467%9
75 Certified Nursing Assistant
% of Days 100%
26 Licensed Practical Nurse
% of Days 100%
22 Registered Nurse
% of Days 100%
7 Clinical Nurse Specialist
% of Days 92%
6 Other Dietary Services Staff
% of Days 100%
5 Physical Therapy Assistant
% of Days 87%
5 Respiratory Therapy Technician
% of Days 91%
2 RN Director of Nursing
% of Days 66%
2 Dental Services Staff
% of Days 63%
1 Dietitian
% of Days 67%
1 Nurse Practitioner
% of Days 67%
1 Administrator
% of Days 65%
1 Qualified Social Worker
% of Days 59%
1 Physical Therapy Aide
% of Days 64%
1 Occupational Therapy Aide
% of Days 62%
1 Speech Language Pathologist
% of Days 45%
1 Mental Health Service Worker
% of Days 14%
2 Medical Director
% of Days 7%

Penalties and fines

Includes penalties issued in 2023

Federal penalties imposed by CMS for regulatory violations, including civil money penalties (fines) and denials of payment for new Medicare/Medicaid admissions.

Source: CMS Penalties Database (Data as of Jan 2026)

Total fines amount $19K Rank #55 / 90Federal fines — State benchmarkedThis home is ranked 55th out of 90 homes in Massachusetts. Shows this facility's cumulative CMS federal fine dollars versus the Massachusetts average among facilities with fines, and where it ranks among 90 skilled nursing facilities in the pool. Lower total dollars mean a better rank.Click the rank badge to see the full State ranking.Click here to see the full State ranking.
74% lower than Massachusetts average

Massachusetts average: $72K

Number of fines 2
17% more fines than Massachusetts average

Massachusetts average: 1.7

Payment Denials Info Serious action where Medicare and/or Medicaid temporarily stops payments for new residents until issues are fixed. 0
100% fewer payment denials than Massachusetts average

Massachusetts average: 0.1

Fines amount comparison
This facility $19K
Massachusetts average $72K
Penalty History

Penalties are imposed by CMS for violations of federal nursing home regulations.

2 penalties in the past 3 years

Multiple penalties were reported in the last 3 years.

Civil Money Penalty Info Fines imposed for noncompliance, which can be assessed per day or per instance of violation. Jul 20, 2023
$13K
Civil Money Penalty Info Fines imposed for noncompliance, which can be assessed per day or per instance of violation. May 23, 2023
$5K

Last updated: Jan 2026

Quality of care over time

These measures show how residents usually do over time at this home, based on health outcomes and preventive care.

High-risk clinical events score Info A composite score based on pressure ulcers, falls with injury, weight loss, walking ability decline, and activities of daily living decline. 7.8
24% better than Massachusetts average

Massachusetts average: 10.2

Functional decline score Info A composite score based on activities of daily living decline, walking ability decline, and incontinence. 14.3
29% better than Massachusetts average

Massachusetts average: 20.0

Long-stay resident measures
Below average Massachusetts avg: 3.6 Info CMS star rating based on long-stay quality measure performance. 5 stars = significantly above average, 1 star = significantly below average.
Need for Help with Daily Activities Increased Info Percent of long-stay residents whose need for help with daily activities has increased 15.9%
15% better than Massachusetts average

Massachusetts average: 18.7%

Walking Ability Worsened Info Percent of long-stay residents whose ability to move independently worsened 13.3%
31% better than Massachusetts average

Massachusetts average: 19.3%

Low Risk Residents with Bowel/Bladder Incontinence Info Percent of low risk long-stay residents who lose control of their bowels or bladder 13.6%
38% better than Massachusetts average

Massachusetts average: 22.1%

Falls with Major Injury Info Percent of long-stay residents experiencing one or more falls with major injury 2.3%
37% better than Massachusetts average

Massachusetts average: 3.6%

High Risk Residents with Pressure Ulcers Info Percent of long-stay high risk residents with pressure ulcers 4.1%
13% better than Massachusetts average

Massachusetts average: 4.7%

Urinary Tract Infection Info Percent of long-stay residents with a urinary tract infection 6.1%
195% worse than Massachusetts average

Massachusetts average: 2.1%

Lost Too Much Weight Info Percent of long-stay residents who lose too much weight 3.3%
37% better than Massachusetts average

Massachusetts average: 5.2%

Depressive Symptoms Info Percent of long-stay residents who have depressive symptoms 0.2%
98% better than Massachusetts average

Massachusetts average: 10.7%

Antipsychotic Use Info Percent of long-stay residents who received an antipsychotic medication 27.7%
37% worse than Massachusetts average

Massachusetts average: 20.3%

Pneumococcal Vaccine Info Percent of long-stay residents assessed and appropriately given the pneumococcal vaccine 82.4%
10% worse than Massachusetts average

Massachusetts average: 91.9%

Influenza Vaccine Info Percent of long-stay residents assessed and appropriately given the seasonal influenza vaccine 100.0%
5% better than Massachusetts average

Massachusetts average: 94.8%

Hospitalizations per 1,000 days Info Number of hospitalizations per 1,000 long-stay resident days. 2.96
59% worse than Massachusetts average

Massachusetts average: 1.86

ED visits per 1,000 days Info Number of outpatient emergency department visits per 1,000 long-stay resident days. 1.12
27% better than Massachusetts average

Massachusetts average: 1.54

Short-stay resident measures
Average Massachusetts avg: 3.2 Info CMS star rating based on short-stay quality measure performance. 5 stars = much above average, 1 star = much below average.
Pneumococcal Vaccine Info Percent of short-stay residents assessed and appropriately given the pneumococcal vaccine 70.7%
8% worse than Massachusetts average

Massachusetts average: 76.7%

Antipsychotic medication increase Info Percent of short-stay residents who newly received an antipsychotic medication 1.0%
26% better than Massachusetts average

Massachusetts average: 1.3%

Influenza Vaccine Info Percent of short-stay residents assessed and appropriately given the seasonal influenza vaccine 82.7%
6% better than Massachusetts average

Massachusetts average: 77.7%

Re-hospitalized after SNF stay Info Percentage of short-stay residents who were re-hospitalized after their nursing home admission. 22.8%
12% better than Massachusetts average

Massachusetts average: 25.8%

Emergency department visits Info Percentage of short-stay residents who had an outpatient emergency department visit. 10.2%
14% better than Massachusetts average

Massachusetts average: 11.8%

Falls with major injury Info Percentage of SNF residents who experience falls with major injury during their stay. 1.6%
112% worse than Massachusetts average

Massachusetts average: 0.8%

Ability to care for self at discharge Info Percentage of residents at or above expected ability to care for themselves at discharge. 26.2%
51% worse than Massachusetts average

Massachusetts average: 53.7%

Successful return to home or community Info Rate of successful return to home or community from a skilled nursing facility. 55.9%
11% better than Massachusetts average

Massachusetts average: 50.6%

Breakdown by payment type

Medicare

75% of new residents, usually for short-term rehab.

Typical stay 1 months

Private pay

24% of new residents, often for short stays.

Typical stay 11 - 12 months

Medicaid

1% of new residents, often for long-term daily care.

Typical stay 14 - 15 years

Facility Characteristics

Source: CMS Long-Term Care Facility Characteristics (Data as of Jan 2026)

Total residents 124
Medicare
12
9.7% of residents
Medicaid
48
38.7% of residents
Private pay or other
64
51.6% of residents
Programs & Services
Residents Group

Residents meet regularly to discuss policies, care quality, and activities

Family Member Group

Family members meet regularly to discuss policies, care quality, and activities

Nurse Aide Training

State-approved Nurse Aide Training and Competency Evaluation Program on-site

Active Family Council

Organized group of family members that meets regularly to discuss facility policies, resident care, and activities.

Active Resident Council

Organized group of residents that meets regularly to discuss facility policies, quality of life, and activities.

Finances and operations

Privately-owned community
Operated by a business corporation.
Home revenue
$21.7M
Profit
$348.0K
Privately-owned community Operated by a business corporation.
Home revenue
$21.7M Rank #41 / 92Revenue — State benchmarkedThis home is ranked 41st out of 92 homes in Massachusetts. Shows this facility's annual revenue compared to the Massachusetts SNF average. Higher revenue generally means more resources for staffing and capital — read alongside Payroll %.Click the rank badge to see the full State ranking.Click here to see the full State ranking.
Profit
$348.0K
Payroll costs Info The portion of the home's budget spent on staff, including nurses, caregivers, and other employees who support care and operations. Rank #12 / 92Payroll — State benchmarkedThis home is ranked 12th out of 92 homes in Massachusetts. Shows total annual staff payroll benchmarked to the Massachusetts average. Higher payroll investment relative to peers often signals better staffing and less reliance on cheaper contract labor.Click the rank badge to see the full State ranking.Click here to see the full State ranking.
$14.7M
67.6% of revenue Rank #7 / 92Payroll % — State benchmarkedThis home is ranked 7th out of 92 homes in Massachusetts. Shows payroll as a percentage of revenue versus the Massachusetts average. Well-run Massachusetts SNFs typically land around 54–65% — the top third Statewide. Below 25% may signal understaffing or heavy agency use — read with Staffing ratings.Click the rank badge to see the full State ranking.Click here to see the full State ranking.
Other operating costs Info All remaining costs needed to run the home, such as food, utilities, building maintenance, supplies and administrative expenses.
$6.7M
Total costs $21.4M

What does this home offer?

Housing options icon

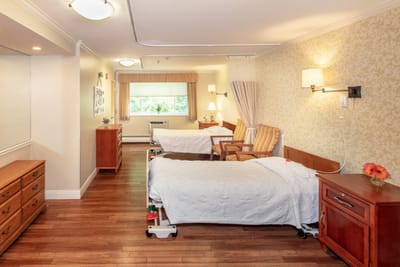
Housing Options: Private / 2 Bed Rooms

Building type icon
Building type icon

Building Type: 3-story
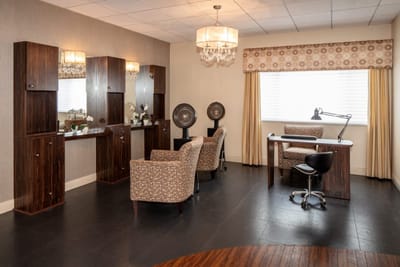
Dining services icon

Dining Services

Beauty services icon

Beauty Services

Housekeeping icon
Housekeeping icon

Housekeeping Services

Recreational activities icon

Recreational Activities

Exercise program icon

Exercise Programs

Who this home usually serves

TYPE OF STAY

Mostly short-term rehab stays

Most residents typically stay for a few weeks or months before returning home or moving on.

Managed by Stewart A. Karger

Administrator

Stewart A. Karger has been the Administrator of Belmont Manor Nursing & Rehabilitation Center since 1985, continuing a family legacy. He leads department heads to ensure residents receive the highest quality care and maintains an open-door policy for resident and staff concerns. Stewart has been part of the community since 1979, dedicated to fulfilling the mission of Belmont Manor.

Places of interest near Belmont Manor Nursing & Rehabilitation Center

Address 1.3 miles from city center Info Estimated distance in miles from Belmont's city center to Belmont Manor Nursing & Rehabilitation Center's address, calculated via Google Maps.

Calculate Travel Distance to Belmont Manor Nursing & Rehabilitation Center

Add your location

Address

Financial Assistance for
Nursing Home in Massachusetts

Belmont Manor Nursing & Rehabilitation Center is located in Belmont, Massachusetts.
Here are the financial assistance programs available to residents in Massachusetts.

Get Financial aid guidance

Home Care Program

MassHealth Home Care

Age 60+
General Massachusetts resident, at risk of nursing home placement.
Income Limits (2025) ~$1,500/month individual, varies by region
Asset Limits $2,000 individual, excludes home, car
MA

Coordinated through Aging Services Access Points (ASAPs); high demand in urban areas.

Benefits
In-home care (3-5 hours/day) Homemaker services Respite care (up to 14 days/year) Adult day care (~$75/day)

Frail Elder Waiver

Massachusetts Medicaid FE Waiver

Age 65+
General Massachusetts resident, Medicaid-eligible, nursing home-level care need.
Income Limits (2025) ~$2,829/month 300% FBR, individual
Asset Limits $2,000 (individual), $3,000 (couple).
MA

Requires clinical eligibility determination.

Benefits
Personal care (5-7 hours/day) Respite care (240 hours/year) Adult day care (~$75/day) Home health services

Senior Care Options (SCO)

Massachusetts Senior Care Options

Age 65+
General Massachusetts resident, eligible for MassHealth (Medicare optional), nursing home-level care need.
Income Limits (2025) ~$2,829/month (300% FBR, individual); QIT allowed.
Asset Limits $2,000 (individual), $3,000 (couple) (excludes home up to $713,000, car).
MA

Not available in Dukes/Nantucket Counties; multiple SCO providers (e.g., CCA, Tufts).

Benefits
Personal care (5-7 hours/day) Medical care Respite (240 hours/year) Adult

Medicare Savings Program (MSP)

Massachusetts Medicare Savings Program (MassHealth Buy-In)

Age 65+ or disabled
General Massachusetts resident, Medicare Part A/B.
Income Limits (2025) ~$2,510/month (QMB), ~$3,380/month (SLMB), ~$3,598/month (QI)—individual.
Asset Limits $9,430 (individual), $14,130 (couple).
MA

Three tiers; no waitlist; includes Extra Help for Part D.

Benefits
Covers Part B premiums ($174.70/month) Deductibles ($240/year) Copays (~20%)

National Family Caregiver Support Program (NFCSP) Respite

Massachusetts NFCSP Respite Care

Age
General Caregivers of 60+ needing care or 55+ caregivers of others; Massachusetts resident; functional needs (2+ ADLs).
Income Limits (2025) Prioritizes ~$24,980/year (individual); no strict cap.
Asset Limits Not assessed; need-based.
MA

27 ASAPs; prioritizes low-income, rural caregivers.

Benefits
Respite (4-6 hours/week or 5 days/year) Adult day care ($60/day) Caregiver training Supplies (~$500/year)

Prescription Advantage

Massachusetts Prescription Advantage

Age 65+ or disabled
General Massachusetts resident, enrolled in Medicare Part D (or ineligible for Medicare).
Income Limits (2025) No strict limit; copays vary by income ~$24,980-$75,000/year individual
Asset Limits Not assessed.
MA

Supplements Medicare Part D; no enrollment fee for low-income.

Benefits
Covers prescription copays ($5-$40/drug) Fills coverage gaps Catastrophic cost protection ($4,000+ covered)

VA Aid and Attendance (A&A) and Housebound Benefits

Massachusetts VA Aid and Attendance/Housebound

Age 65+ or disabled veteran/spouse
General Massachusetts resident, wartime service, need for ADL help (A&A) or homebound.
Income Limits (2025) Net income < ~$1,984/month (veteran with dependent, A&A); pension offsets income.
Asset Limits ~$155,356 net worth limit
MA

High veteran demand statewide.

Benefits
Cash (~$1,433-$2,642/month veteran, ~$951-$1,318 spouse) for care costs (e.g., in-home, assisted living)

Compare Nursing Home around Middlesex County

The information below is reported by the Massachusetts Executive Office of Elder Affairs and Department of Public Health.

5 facilities compared · CMS & MA Dept. of Health data

Filter by care type
Lasell Village
NH

Nursing Home Licensed facility providing 24/7 skilled nursing care for residents with complex, ongoing medical needs. Staffed by RNs, LPNs, and CNAs. Inspected and star-rated annually by CMS. Accepts Medicare (short-term rehab) and Medicaid (long-term care).

Newton (Auburndale)38 63.3% -23%6.86 +23%+74%$063.0-22- 52 Alessandro Vianello$30.1M$10.4M34.7%225755
CareOne at Concord
NH

Nursing Home Licensed facility providing 24/7 skilled nursing care for residents with complex, ongoing medical needs. Staffed by RNs, LPNs, and CNAs. Inspected and star-rated annually by CMS. Accepts Medicare (short-term rehab) and Medicaid (long-term care).

CH

Care Homes

MC

Memory Care Secured, specialized care for people living with Alzheimer's or dementia. Staff trained in cognitive impairment, with higher staff-to-resident ratios and an environment designed to reduce confusion and wandering risk.

Concord (Old Road To Nine Acre Corner)135 85.3% +4%3.85 -78%-2%$7.9k41.31119- 24 -$29.6M$10.8M36.6%225663
Life Care Center of Acton
NH

Nursing Home Licensed facility providing 24/7 skilled nursing care for residents with complex, ongoing medical needs. Staffed by RNs, LPNs, and CNAs. Inspected and star-rated annually by CMS. Accepts Medicare (short-term rehab) and Medicaid (long-term care).

Acton (East Acton)143 74.2% -9%3.73 -51%-5%$35.4k165.31119- 39 Christopher Foye$21.6M$10.3M47.6%225191
Belmont Manor Nursing & Rehabilitation Center
NH

Nursing Home Licensed facility providing 24/7 skilled nursing care for residents with complex, ongoing medical needs. Staffed by RNs, LPNs, and CNAs. Inspected and star-rated annually by CMS. Accepts Medicare (short-term rehab) and Medicaid (long-term care).

MC

Memory Care Secured, specialized care for people living with Alzheimer's or dementia. Staff trained in cognitive impairment, with higher staff-to-resident ratios and an environment designed to reduce confusion and wandering risk.

Belmont (Waverley Square)135 95.3% +16%4.72 +7%+20%$18.5k287.01124A+ 79 Stewart Karger$21.7M$14.7M67.6%225419
Life Care Center of Merrimack Valley
NH

Nursing Home Licensed facility providing 24/7 skilled nursing care for residents with complex, ongoing medical needs. Staffed by RNs, LPNs, and CNAs. Inspected and star-rated annually by CMS. Accepts Medicare (short-term rehab) and Medicaid (long-term care).

Billerica (North Billerica)124 85.8% +5%4.24 -39%+8%$272.3k317.8-103- 40 Karen Babb$22.5M$11.4M50.5%225546

Frequently Asked Questions about Belmont Manor Nursing & Rehabilitation Center

What neighborhood is Belmont Manor Nursing & Rehabilitation Center in?

Belmont Manor Nursing & Rehabilitation Center is in the Waverley Square neighborhood of Belmont.

Is Belmont Manor Nursing & Rehabilitation Center in a walkable area?

Belmont Manor Nursing & Rehabilitation Center has a walk score of 79. Very walkable. Most errands can be accomplished on foot, and many essentials are within a short walk.

Are there photos of Belmont Manor Nursing & Rehabilitation Center?

Yes — there are 12 photos of Belmont Manor Nursing & Rehabilitation Center in the photo gallery on this page.

What is the address of Belmont Manor Nursing & Rehabilitation Center?

Belmont Manor Nursing & Rehabilitation Center is located at 34 Agassiz Ave, Belmont, MA 02478.

What is the phone number of Belmont Manor Nursing & Rehabilitation Center?

(617) 489-1200 will put you in contact with the team at Belmont Manor Nursing & Rehabilitation Center.

Is Belmont Manor Nursing & Rehabilitation Center Medicare or Medicaid certified?

Yes — Belmont Manor Nursing & Rehabilitation Center is a CMS-certified provider of Medicare and Medicaid.

Guides for Better Senior Living

Care Cost Calculator: See Prices in Your Area

Nursing Home Data Explorer

Don’t Wait Too Long: 7 Red Flag Signs Your Parent Needs Assisted Living Now

The True Cost of Assisted Living in 2025 – And How Families Are Paying For It

Understanding Senior Living Costs: Pricing Models, Discounts & Financial Assistance

Explore Open Rooms
1 Contact details
2 What type of senior care service are you looking for?
3 What budget do you have in mind for senior care?
4 How soon do you need to find care?
5 Additional details

Thank you for your interest!

Our team will be in touch shortly to help with next steps.