Johnson County Health and Rehab, LLC
Nursing Home, Hospice Care & Respite Care · Clarksville, AR
CMS overall rating Info CMS (the Centers for Medicare & Medicaid Services) is the federal agency that rates nursing home quality. Its Overall Rating runs from 1 to 5 stars, combining health inspections, staffing, and quality measures, with inspections weighted most heavily.

Johnson County Health and Rehab, LLC

Nursing Home, Hospice Care & Respite Care · Clarksville, AR
CMS overall rating Info CMS (the Centers for Medicare & Medicaid Services) is the federal agency that rates nursing home quality. Its Overall Rating runs from 1 to 5 stars, combining health inspections, staffing, and quality measures, with inspections weighted most heavily.
Calculator: See prices in your area
Johnson County Health and Rehab, LLC accepts Medicare, Medicaid, and private pay.

Overview of Johnson County Health and Rehab, LLC

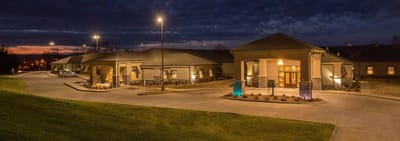
Paralea Hursh owns Johnson County Health and Rehab, a 140-bed facility on East Poplar Street in Clarksville, Arkansas, where Robin Lambert serves as the administrator. The building holds a 76 percent occupancy rate, and residents stay for about 214 days on average. This timeframe shows that the daily routine is split between short-term therapy recovery and permanent residential placements. To cover stay costs, the billing desk processes state Medicaid, traditional Medicare, and standard private pay.

The facility features private and semi-private rooms with personal climate controls, free Wi-Fi, a beauty salon, and a wheelchair-accessible garden with a covered patio. During visits, family members are welcome to share meals with residents in the dining room, and because the area has a walk score of 60, it is easy to cross a few quick errands off your list on foot.

These amenities complement a 24-hour nursing crew that delivers about 5 hours and 11 minutes of direct, hands-on attention to each resident daily, managing everything from regular clinical care and short-term respite stays to physical rehabilitation routines.

Prospective residents can look over the facility’s recent state survey results with the front office, which noted specific compliance issues regarding medication handling, care plan tracking, and resident supervision protocols. Discussing these reports with the staff is a good way to see how they handle everyday building safety and quality control. If the setup fits your needs, you can talk to the intake coordinator during the same conversation to see which rooms are currently available or to find out how the admissions paperwork works.

Quality ratings

Measured by Centers for Medicare & Medicaid Services (CMS)

Overall rating Info The Overall CMS Rating combines results from health inspections, staffing levels and quality measures. Health inspections carry the most weight. Staffing and quality scores can increase or decrease the final rating based on performance compared to state and national standards.
Health Inspection Info Based on the results of the facility's three most recent standard inspections and any complaint investigations. CMS reviews the number, scope, and severity of deficiencies, with more recent findings weighted more heavily.
Staffing Info Measures average nursing staff hours per resident per day, including Registered Nurses (RNs) and total nursing staff. Ratings are adjusted based on the level of care residents require and are compared to state and national benchmarks.
Quality Measures Info Based on clinical and physical health indicators reported to CMS, such as hospital readmissions, falls, pressure ulcers, and improvements in mobility. These measures reflect how well residents' health needs are being managed.

Staffing hours breakdown

Info Daily nursing hours per resident by staff type, reported to CMS. Higher is generally better — compare this facility to state and national averages to see where staffing stands.

Hours per resident per day — compared to state averages

Total nursing care / resident Info Total adjusted nursing hours per resident per day, combining RN, LPN, and aide time. CMS adjusts this for case-mix so facilities can be fairly compared.
5h 11m per day
vs avg

3 of 6 metrics below state avg

Standout metric Nurse Aide is +29% above state avg
Staff typeHours / Day / Residentvs state avg
Registered Nurse (RN) Info RNs hold the highest nursing license and can assess residents, interpret test results, and direct care plans. More RN hours per day often signals stronger clinical oversight and faster response to health changes. 15m per day ▼ 38% State avg: 24m per day · National avg: 41m per day
LPN / LVN Info Licensed Practical Nurses (LPNs) or Licensed Vocational Nurses (LVNs) deliver routine hands-on care — medication administration, wound dressing, and monitoring vital signs. They work under RN supervision and make up a large share of daily bedside care. 1h 3m per day ▲ 10% State avg: 57m per day · National avg: 52m per day
Nurse Aide Info Certified Nurse Aides (CNAs) provide the most direct day-to-day assistance: bathing, dressing, feeding, and mobility. Nurse aide hours are typically the largest staffing category and directly affect residents' quality of life. 3h 30m per day ▲ 29% State avg: 2h 43m per day · National avg: 2h 20m per day
Weekend Total Nursing Info Combined nursing hours (RN + LPN + Nurse Aide) per resident per day on weekends. Staffing often drops on weekends — this figure reveals whether the facility maintains adequate coverage outside of weekday hours. 4h 16m per day ▲ 23% State avg: 3h 29m per day · National avg: 3h 26m per day
Physical Therapist Info Hours per resident per day provided by licensed Physical Therapists (PTs) or PT Assistants. PT services help residents recover mobility after injury or illness and are especially important for post-acute (short-stay) rehabilitation. 1m per day ▼ 56% State avg: 2m per day · National avg: 4m per day
Weekend RN Info Registered nurse hours specifically on weekends. Facilities sometimes reduce RN presence on Saturdays and Sundays — a low weekend RN figure compared to weekday hours can indicate reduced clinical oversight when most administrative staff are absent. 12m per day ▼ 26% State avg: 16m per day · National avg: 28m per day

Capacity and availability

Avg. Length of Stay
214 days
Bed community size
140-bed community Rank #17 / 330Bed count — State benchmarkedThis home is ranked 17th out of 330 homes in Arkansas. Shows this facility's certified or reported bed count compared to other Arkansas facilities. Larger communities may offer more amenities, programs, and on-site services for residents and families.Rankings are based only on facilities in Arkansas that report data for that category. Facilities without available data are excluded from the ranking.Click the rank badge to see the full State ranking.Click here to see the full State ranking.
A larger shared setting that may offer more common spaces and organized community services.
Walk Score
Walk Score: 60 / 100 Rank #48 / 419Walk Score — State benchmarkedThis home is ranked 48th out of 419 homes in Arkansas. Shows how walkable this facility's neighborhood is compared to the average Walk Score across Arkansas facilities. Higher scores benefit residents, families, and staff.Rankings are based only on facilities in Arkansas that report data for that category. Facilities without available data are excluded from the ranking.Click the rank badge to see the full State ranking.Click here to see the full State ranking.
Moderately walkable. Some errands can be accomplished on foot, with a mix of nearby amenities.

About this community

Occupancy

Occupancy rate
76%
Higher than the Arkansas average: 71.3%
Occupied beds
106 / 140
Average occupied beds in Arkansas homes 77 beds

License Details

Facility TypeSkilled Nursing Facility With Dual Certified Beds (medicaid / Medicare)
CountyJohnson
CMS Certification Number045168
Certification TypeMedicaid / Medicare

Ownership & Operating Entity

Johnson County Health and Rehab, LLC is legally operated by Johnson County Health and Rehab, LLC, and administered by Robin Lambert.

Owner NameJohnson County Health And Rehab, LLC
Profit StatusFor-profit

Type Of Units

Medicaid and Medicare
140 units
Total beds
140 units

Safety & Compliance

Wheelchair Accessible

Therapy & Rehabilitation

3 services
Rehabilitation Services
Respite Care
Short-Term Rehab

Staffing & Medical

1 service
24-Hour Staffing

Contact Information

Fax479-754-5745

Amenities & Lifestyle

Free Wireless Internet
Flat Screen Tv’s With Direct Tv
Individual Climate Controls
Private Telephone Hookups
Semi-Private Rooms
Superior Dining Experience
Access To Private Dining Area
Outside Wheelchair Accessible Garden
Outside Covered Patio Area
Activities Room
Beauty Salon Services
Daily Housekeeping And Laundry Services
Planned Activities And Social Opportunities
Specialized Occupational Therapy Return To Home Training Area
Private Speech Therapy Room
24/7 Physician Services
24-Hour Nursing Services
Treatment Nurse
State Of The Art Rehabilitation Gym
Wound Care Services
Activities

Contact Johnson County Health and Rehab, LLC

Inspection History

In Arkansas, the Department of Human Services, Office of Long Term Care is authorized to conduct unannounced inspections and issue official quality of care reports for all senior living providers.

Since 2023 · 3 years of data 7 deficiencies

Inspection Scorecard Info This scorecard compares key inspection, deficiency, and complaint metrics at this facility against the Arkansas state average. Metrics rated ≥15% worse than average are highlighted in red; those ≥15% better are highlighted in green.

Since 2023 vs. Arkansas state average
Overall vs. AR average 0 Worse No metrics in this bucket. 2 Better Metrics better than Arkansas average:
• Total deficiencies (67% below)
• Deficiencies per year (67% below)
Latest Inspection August 7, 2025 Complaint Investigation

Deficiencies Info Deficiencies are formal regulatory issues recorded during state inspections.

This FacilityAR Averagevs. AR Avg
Total deficiencies Info Formal regulatory issues recorded by inspectors across all inspection types. 721 This facility has 67% fewer total deficiencies than a typical Arkansas assisted living residence (7 vs. AR avg 21).↓ 67% better
Deficiencies per year Info Average deficiencies per year since 2023. 2.37 This facility has 67% fewer deficiencies per year than a typical Arkansas assisted living residence (2.3 vs. AR avg 7).↓ 67% better

Inspection Reports Summary Info An editor-reviewed summary of the themes and findings across this facility's recent inspection reports.

  • August 7, 2025 complaint investigation substantiated failure of two Medication Aides to follow Resident #113’s care plan requiring mechanical lift, resulting in resident lowered to floor without injury.
  • February 28, 2025 incident found immediate jeopardy when Resident #1 eloped after an Office Aide turned off the alarm without notifying staff; corrective actions were implemented before survey completion.
  • April 12, 2024 routine inspection cited three deficiencies including undignified feeding on secure unit, improper medication labeling, and uncovered food items with unsanitized equipment.

Health Inspection History

Inspections since 2023
Total health inspections 4

State average N/A


Last Health inspection on Aug 2025

Total health citations
6

State average N/A

Citations per inspection
1.5

State average N/A


Health citations are formal notices following inspections when they fail to comply with safety and care standards.

5 of 6 citations resulted from standard inspections; and 1 of 6 resulted from complaint investigations.

Breakdown of citation severity (last 3 years)
Critical health citations
1
In line with State average

State average: N/A


Serious health citations
0
In line with State average

State average: N/A

1 critical citation State average: N/A

0 serious citations State average: N/A

5 moderate citations State average: N/A

0 minor citations State average: N/A
Citations history (last 3 years)
Quality of Care moderate citation Aug 07, 2025
Corrected

Quality of Care critical citation Mar 12, 2025
Corrected

Nutrition moderate citation Apr 12, 2024
Corrected

Pharmacy moderate citation Apr 12, 2024
Corrected

Staffing Data

Reporting period: October 1 – December 31, 2025 (Q4 2025). Source: CMS Payroll-Based Journal report.

Total staff 169
Employees 154
Contractors 15
Staff to resident ratio 1.50 : 1
0% compared with State average

State average ratio: 0 : 0

Avg staff/day 78
Average shift 7.7 hours
0% compared with State average

State average: 0 hours

Total staff hours (quarter) 55,198

Nursing staff breakdown

Q4 2025 · Oct 1 – Dec 31 More info This data comes from the CMS Payroll-Based Journal report covering October 1 – December 31, 2025.
Registered Nurse

Manages medical care and health needs.

RN Staff Info All 3 RN Staff are full-time employees. No contractors work on this role. 3
Average shift length Info Average shift length. Calculated as total hours divided by days worked and average staff per day. 8.2 hours
Licensed Practical Nurse

Assists with medical care and medications.

LPN Staff Info All 28 LPN Staff are full-time employees. No contractors work on this role. 28
Average shift length Info Average shift length. Calculated as total hours divided by days worked and average staff per day. 8.8 hours
Certified Nursing Assistant

Helps with daily care and mobility.

CNA Staff Info All 91 CNA Staff are full-time employees. No contractors work on this role. 91
Average shift length Info Average shift length. Calculated as total hours divided by days worked and average staff per day. 7.4 hours

Contractor staffing

Q4 2025 · Oct 1 – Dec 31 More info This data comes from the CMS Payroll-Based Journal report covering October 1 – December 31, 2025.

Total hours from contractors

3.3%

1,833 contractor hours this quarter

Physical Therapy Aide: 3 Respiratory Therapy Technician: 3 Speech Language Pathologist: 2 Physical Therapy Assistant: 2 Occupational Therapy Aide: 1 Clinical Nurse Specialist: 1 Qualified Social Worker: 1 Medical Director: 1 Occupational Therapy Assistant: 1

Staff by category

Q4 2025 · Oct 1 – Dec 31 More info This data comes from the CMS Payroll-Based Journal report covering October 1 – December 31, 2025.
Certified Nursing Assistant9109130,97992100%7.4
Licensed Practical Nurse280289,50092100%8.8
Medication Aide/Technician130135,85492100%8.7
RN Director of Nursing4041,7997480%8.3
Clinical Nurse Specialist3141,3238896%7.8
Nurse Aide in Training7079838592%6.6
Registered Nurse3038478896%8.2
Occupational Therapy Aide1125647582%7
Speech Language Pathologist0225396672%7.7
Dietitian1015076166%8.3
Physical Therapy Aide0335036571%7.6
Nurse Practitioner1014886166%8
Administrator1014806065%8
Mental Health Service Worker1014716065%7.8
Respiratory Therapy Technician0331586773%2.4
Physical Therapy Assistant0221054751%2.2
Qualified Social Worker011663841%1.7
Occupational Therapy Assistant0112333%7.5
Medical Director0111033%3.3
91 Certified Nursing Assistant
% of Days 100%
28 Licensed Practical Nurse
% of Days 100%
13 Medication Aide/Technician
% of Days 100%
4 RN Director of Nursing
% of Days 80%
4 Clinical Nurse Specialist
% of Days 96%
7 Nurse Aide in Training
% of Days 92%
3 Registered Nurse
% of Days 96%
2 Occupational Therapy Aide
% of Days 82%
2 Speech Language Pathologist
% of Days 72%
1 Dietitian
% of Days 66%
3 Physical Therapy Aide
% of Days 71%
1 Nurse Practitioner
% of Days 66%
1 Administrator
% of Days 65%
1 Mental Health Service Worker
% of Days 65%
3 Respiratory Therapy Technician
% of Days 73%
2 Physical Therapy Assistant
% of Days 51%
1 Qualified Social Worker
% of Days 41%
1 Occupational Therapy Assistant
% of Days 3%
1 Medical Director
% of Days 3%

Penalties and fines

Includes penalties issued in 2025

Federal penalties imposed by CMS for regulatory violations, including civil money penalties (fines) and denials of payment for new Medicare/Medicaid admissions.

Source: CMS Penalties Database (Data as of Jan 2026)

Total fines amount $8K
68% lower than State average

State average: $26K

Number of fines 1
32% fewer fines than State average

State average: 1.5

Payment Denials Info Serious action where Medicare and/or Medicaid temporarily stops payments for new residents until issues are fixed. 0
100% fewer payment denials than State average

State average: 0.2

Fines amount comparison
This facility $8K
State average $26K
Penalty History

Penalties are imposed by CMS for violations of federal nursing home regulations.

1 penalty in the past 3 years

Mar 12, 2025 · $8K

Civil Money Penalty Info Fines imposed for noncompliance, which can be assessed per day or per instance of violation. Mar 12, 2025
$8K

Last updated: Jan 2026

Quality of care over time

These measures show how residents usually do over time at this home, based on health outcomes and preventive care.

High-risk clinical events score Info A composite score based on pressure ulcers, falls with injury, weight loss, walking ability decline, and activities of daily living decline. 8.0
In line with State average

State average: 7.7

Functional decline score Info A composite score based on activities of daily living decline, walking ability decline, and incontinence. 17.2
29% worse than State average

State average: 13.3

Long-stay resident measures
Significantly above average State avg: 4.2 Info CMS star rating based on long-stay quality measure performance. 5 stars = significantly above average, 1 star = significantly below average.
Need for Help with Daily Activities Increased Info Percent of long-stay residents whose need for help with daily activities has increased 13.7%
19% worse than State average

State average: 11.5%

Walking Ability Worsened Info Percent of long-stay residents whose ability to move independently worsened 13.2%
In line with State average

State average: 13.4%

Low Risk Residents with Bowel/Bladder Incontinence Info Percent of low risk long-stay residents who lose control of their bowels or bladder 24.7%
63% worse than State average

State average: 15.1%

Falls with Major Injury Info Percent of long-stay residents experiencing one or more falls with major injury 2.0%
50% better than State average

State average: 3.9%

High Risk Residents with Pressure Ulcers Info Percent of long-stay high risk residents with pressure ulcers 3.5%
25% better than State average

State average: 4.7%

Urinary Tract Infection Info Percent of long-stay residents with a urinary tract infection 0.0%
100% better than State average

State average: 1.3%

Lost Too Much Weight Info Percent of long-stay residents who lose too much weight 7.5%
50% worse than State average

State average: 5.0%

Depressive Symptoms Info Percent of long-stay residents who have depressive symptoms 0.0%
100% better than State average

State average: 1.5%

Antipsychotic Use Info Percent of long-stay residents who received an antipsychotic medication 11.7%
12% worse than State average

State average: 10.5%

Pneumococcal Vaccine Info Percent of long-stay residents assessed and appropriately given the pneumococcal vaccine 100.0%
6% better than State average

State average: 94.4%

Influenza Vaccine Info Percent of long-stay residents assessed and appropriately given the seasonal influenza vaccine 100.0%
In line with State average

State average: 96.2%

Hospitalizations per 1,000 days Info Number of hospitalizations per 1,000 long-stay resident days. 1.27
36% better than State average

State average: 1.97

ED visits per 1,000 days Info Number of outpatient emergency department visits per 1,000 long-stay resident days. 2.07
5% better than State average

State average: 2.18

Short-stay resident measures
Below average State avg: 2.7 Info CMS star rating based on short-stay quality measure performance. 5 stars = much above average, 1 star = much below average.
Pneumococcal Vaccine Info Percent of short-stay residents assessed and appropriately given the pneumococcal vaccine 100.0%
24% better than State average

State average: 80.9%

Antipsychotic medication increase Info Percent of short-stay residents who newly received an antipsychotic medication 0.5%
70% better than State average

State average: 1.5%

Influenza Vaccine Info Percent of short-stay residents assessed and appropriately given the seasonal influenza vaccine 95.5%
23% better than State average

State average: 77.7%

Re-hospitalized after SNF stay Info Percentage of short-stay residents who were re-hospitalized after their nursing home admission. 20.2%
20% better than State average

State average: 25.2%

Emergency department visits Info Percentage of short-stay residents who had an outpatient emergency department visit. 15.2%
10% worse than State average

State average: 13.8%

Falls with major injury Info Percentage of SNF residents who experience falls with major injury during their stay. 0.0%
100% better than State average

State average: 0.8%

Ability to care for self at discharge Info Percentage of residents at or above expected ability to care for themselves at discharge. 27.0%
50% worse than State average

State average: 53.7%

Successful return to home or community Info Rate of successful return to home or community from a skilled nursing facility. 54.4%
8% better than State average

State average: 50.6%

Breakdown by payment type

Medicare

35% of new residents, usually for short-term rehab.

Typical stay 1 - 2 months

Private pay

56% of new residents, often for short stays.

Typical stay 3 - 4 months

Medicaid

9% of new residents, often for long-term daily care.

Typical stay 5 - 6 years

Facility Characteristics

Source: CMS Long-Term Care Facility Characteristics (Data as of Jan 2026)

Total residents 113
Medicare
12
10.6% of residents
Medicaid
83
73.5% of residents
Private pay or other
18
15.9% of residents
Programs & Services
Residents Group

Residents meet regularly to discuss policies, care quality, and activities

Active Resident Council

Organized group of residents that meets regularly to discuss facility policies, quality of life, and activities.

Finances and operations

Based on CMS SNF Cost Report for fiscal year ending in 12/2023.

For-profit
Operated by a single business entity.
Net patient revenue Info Net patient revenue — what the home actually collects for resident care, after contractual allowances, bad debt and discounts are subtracted from its gross charges (CMS cost report, Worksheet G-3). It covers resident care only; money the home earns from other sources is shown separately as "Other income."
$12.0M
Net patient income Info Net patient income: net patient revenue minus the home's total operating expenses. A positive figure means it earns more from resident care than it spends to deliver it; a negative figure means the opposite. It excludes non-operating "other income."
$206.3K
For-profit Operated by a single business entity.
Net patient revenue Info Net patient revenue — what the home actually collects for resident care, after contractual allowances, bad debt and discounts are subtracted from its gross charges (CMS cost report, Worksheet G-3). It covers resident care only; money the home earns from other sources is shown separately as "Other income."
$12.0M
Net patient income Info Net patient income: net patient revenue minus the home's total operating expenses. A positive figure means it earns more from resident care than it spends to deliver it; a negative figure means the opposite. It excludes non-operating "other income."
$206.3K
Other income Info Money the home earns outside of resident care — such as investments, grants, rentals and other non-operating sources (CMS cost report, Worksheet G-3). It is tracked separately from net patient revenue: it is not part of that figure, and it is not included in net patient income.
$77
Payroll costs Info Staff salaries plus wage-related costs — benefits such as payroll taxes, health insurance and retirement — from the home's own accounting records (CMS cost report, Worksheet A). Contract or agency labor is counted separately, under other operating costs.
$5.3M 43.9% of net patient revenue Info Payroll as a share of revenue: staff salaries and wage-related benefits divided by net patient revenue. A higher figure means more of each revenue dollar goes to staff pay.
Other operating costs Info Everything it costs to run the home apart from payroll — food, utilities, supplies, maintenance, contract labor and administration. Calculated as total operating expense minus payroll (staff salaries and wage-related benefits).
$6.5M
Total costs Info The home's total operating expense for the year — all the costs of running it, salaries included (CMS cost report, Worksheet G-3).
$11.8M

Who this home usually serves

TYPE OF STAY

Mix of rehab and long-term care

This home supports both short-term rehab and long-term care, with residents staying for a wide range of durations.

Most new residents arrive under private pay (56% of admissions), and a typical private pay stay runs around 3 - 4 months.

Admissions
144 total

Coverage residents most often arrive under.

Medicare 35%
Private pay 56%
Medicaid 9%
Discharges
176 total

Coverage residents most often leave under.

Medicare 41%
Private pay 47%
Medicaid 12%

Places of interest near Johnson County Health and Rehab, LLC

Address 0.0 miles from city center Info Estimated distance in miles from Clarksville's city center to Johnson County Health and Rehab, LLC's address, calculated via Google Maps.

Calculate Travel Distance to Johnson County Health and Rehab, LLC

Add your location

Address

Compare Nursing Homes around the area

The information below is reported by the Arkansas Department of Human Services, Office of Long Term Care.

Johnson County Health and Rehab, LLC
NH
HC
RC
Clarksville -140 - 60 -
Butterfield Trail Village
NH
AL
IL
Fayetteville (East Joyce Boulevard) -87 A+ 39 Studio / 1 Bed / 2 Bed
Barnes Healthcare
NH
MC
Lonoke -141 A+ 38 Private / Shared Rooms
The Green House Cottages of Poplar Grove
NH
HC
MC
RC
Little Rock (Leander) -120 A+ 31 Private Rooms / Semi-Private Rooms
Timberlane Health & Rehab
NH
MC
RC
El Dorado -106 A+ 33 -

Frequently Asked Questions about Johnson County Health and Rehab, LLC

Is Johnson County Health and Rehab, LLC in a walkable area?

Johnson County Health and Rehab, LLC has a walk score of 60. Moderately walkable. Some errands can be accomplished on foot, with a mix of nearby amenities.

What is the occupancy rate at Johnson County Health and Rehab, LLC?

Johnson County Health and Rehab, LLC's occupancy is 76%.

Does Johnson County Health and Rehab, LLC operate as a for-profit or non-profit?

Johnson County Health and Rehab, LLC is registered as a for-profit in AR.

Who is the administrator of Johnson County Health and Rehab, LLC?

Robin Lambert is the administrator of Johnson County Health and Rehab, LLC.

How many beds does Johnson County Health and Rehab, LLC have?

Johnson County Health and Rehab, LLC has 140 beds.

Are there photos of Johnson County Health and Rehab, LLC?

Yes — there are 5 photos of Johnson County Health and Rehab, LLC in the photo gallery on this page.

What is the address of Johnson County Health and Rehab, LLC?

Johnson County Health and Rehab, LLC is located at 1451 East Poplar Street, Clarksville, AR 72830.

Guides for Better Senior Living

Care Cost Calculator: See Prices in Your Area

Nursing Home Data Explorer

Don’t Wait Too Long: 7 Red Flag Signs Your Parent Needs Assisted Living Now

The True Cost of Assisted Living in 2025 – And How Families Are Paying For It

Understanding Senior Living Costs: Pricing Models, Discounts & Financial Assistance