


Occupancy rate
96%
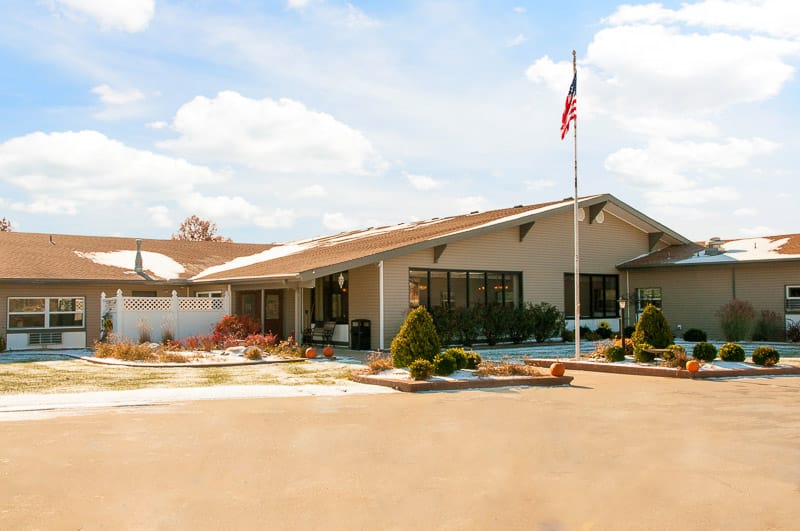
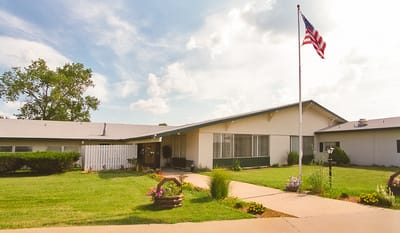
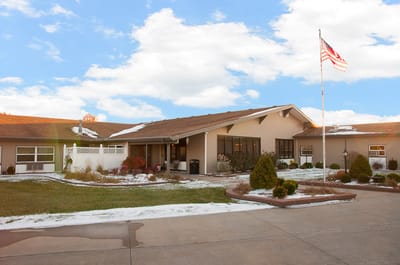
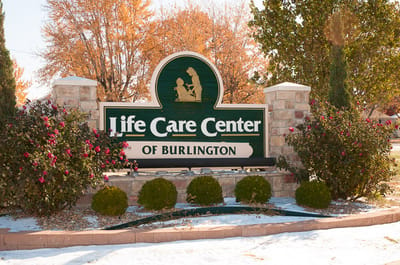
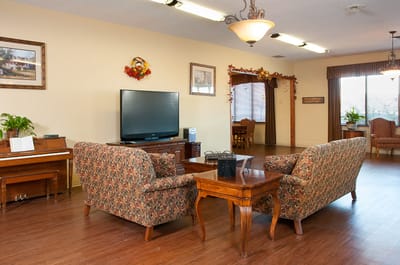
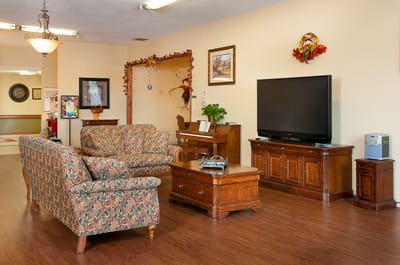
Life Care Center of Burlington is a 77-bed skilled nursing and rehabilitation facility operated by Burlington Real Estate Investors LLC at 601 Cross Street in Burlington, Kansas, in Coffey County. Welcomed are Medicare, Medicaid, and private pay, serving a mostly long-term population averaging a stay of 119 days.
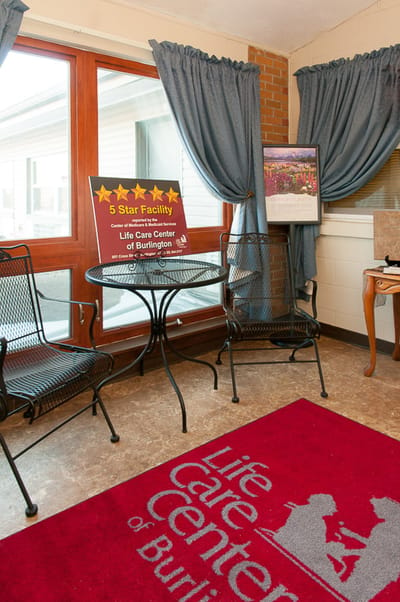
CMS rates the facility 3 stars, 8.3 percent above the Kansas average, with health inspection and quality measures both above the state mean at 12.8 percent and 24.6 percent apiece. Staffing runs 16.9 percent below the Kansas average and is the primary drag on the overall rating. Across 5 inspections since 2021, the facility totaled 23 total including 1 serious finding, with no fines or payment denials in the past three years and no deficiencies cited in the latest inspection. At 96 percent occupancy which is well above Kansas’ 79.5 percent average and ranked 41st out of 217 state facilities, the community is near-capacity with limited availability.
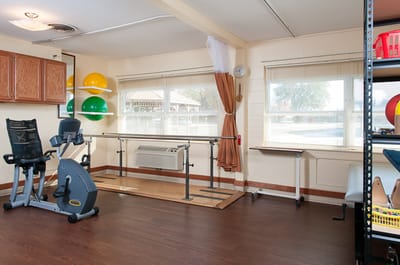
On-site nurse aide training is present. A secured dementia care unit is a program, along with skilled nursing and inpatient and outpatient rehabilitation.
With above-average quality outcomes and strong local demand, the facility is built for long-term skilled nursing and secured memory care in rural Coffey County.
| Staff type | Hours / Day / Resident | vs state avg |
|---|---|---|
|
Registered Nurse (RN)
| 23m per day | ▼ 46% State avg: 43m per day · National avg: 41m per day |
|
LPN / LVN
| 39m per day | ▼ 3% State avg: 40m per day · National avg: 52m per day |
|
Nurse Aide
| 2h 19m per day | ▼ 14% State avg: 2h 41m per day · National avg: 2h 20m per day |
|
Weekend Total Nursing
| 3h 2m per day | ▼ 16% State avg: 3h 35m per day · National avg: 3h 26m per day |
|
Physical Therapist
| 2m per day | ▲ 17% State avg: 2m per day · National avg: 4m per day |
|
Weekend RN
| 15m per day | ▼ 51% State avg: 30m per day · National avg: 28m per day |
Life Care Center of Burlington is administered by Elizabeth Stockebrand.
Key information about the people who lead and staff this community.
In Kansas, the Department for Aging and Disability Services, Survey and Certification Commission performs the unannounced inspections required for facility licensing and federal certification.
Deficiencies
| This Facility | KS Average | vs. KS Avg |
|---|---|---|---|
|
Total deficiencies
| 265 | 100 | This facility has 165% more total deficiencies than a typical Kansas assisted living residence (265 vs. KS avg 100).↑ 165% worse |
|
Deficiencies per year
| 18.9 | 7.1 | This facility has 166% more deficiencies per year than a typical Kansas assisted living residence (18.9 vs. KS avg 7.1).↑ 166% worse |
State average N/A
Last Health inspection on Dec 2024
State average N/A
State average N/A
Health citations are formal notices following inspections when they fail to comply with safety and care standards.
13 of 23 citations resulted from standard inspections; 2 of 23 resulted from complaint investigations; and 8 of 23 came from combined inspections (standard and complaint).
State average: N/A
State average: N/A
Reporting period: October 1 – December 31, 2025 (Q4 2025). Source: CMS Payroll-Based Journal report.
State average ratio: 0 : 0
State average: 0 hours
Manages medical care and health needs.
Assists with medical care and medications.
Helps with daily care and mobility.
Total hours from contractors
165 contractor hours this quarter
| Certified Nursing Assistant | 29 | 0 | 29 | 7,720 | 92 | 100% | 8.6 |
| Medication Aide/Technician | 18 | 0 | 18 | 7,192 | 92 | 100% | 9.3 |
| Licensed Practical Nurse | 8 | 0 | 8 | 3,870 | 92 | 100% | 10 |
| Registered Nurse | 3 | 0 | 3 | 1,408 | 80 | 87% | 10.9 |
| Speech Language Pathologist | 2 | 0 | 2 | 893 | 72 | 78% | 7.4 |
| Clinical Nurse Specialist | 2 | 0 | 2 | 719 | 60 | 65% | 8.1 |
| Physical Therapy Aide | 3 | 0 | 3 | 719 | 63 | 68% | 7.6 |
| Nurse Aide in Training | 3 | 0 | 3 | 613 | 59 | 64% | 8.2 |
| Administrator | 1 | 0 | 1 | 528 | 66 | 72% | 8 |
| Mental Health Service Worker | 1 | 0 | 1 | 520 | 70 | 76% | 7.4 |
| Nurse Practitioner | 1 | 0 | 1 | 464 | 58 | 63% | 8 |
| RN Director of Nursing | 1 | 0 | 1 | 454 | 62 | 67% | 7.3 |
| Dietitian | 1 | 0 | 1 | 442 | 61 | 66% | 7.2 |
| Other Dietary Services Staff | 2 | 0 | 2 | 425 | 60 | 65% | 6.7 |
| Physical Therapy Assistant | 1 | 0 | 1 | 416 | 54 | 59% | 7.7 |
| Respiratory Therapy Technician | 2 | 0 | 2 | 262 | 39 | 42% | 5.7 |
| Qualified Social Worker | 1 | 0 | 1 | 243 | 44 | 48% | 5.5 |
| Occupational Therapy Aide | 0 | 1 | 1 | 109 | 14 | 15% | 7.8 |
| Medical Director | 0 | 1 | 1 | 29 | 3 | 3% | 9.5 |
| Occupational Therapy Assistant | 0 | 1 | 1 | 28 | 3 | 3% | 9.2 |
Federal penalties imposed by CMS for regulatory violations, including civil money penalties (fines) and denials of payment for new Medicare/Medicaid admissions.
Source: CMS Penalties Database (Data as of Jan 2026)
State average: $44K
State average: 2.4
State average: 0.3
No penalties in the past 3 years
No civil money penalties or payment denials were reported in the last 3 years.
These measures show how residents usually do over time at this home, based on health outcomes and preventive care.
State average: 10.5
State average: 20.7
State average: 19.0%
State average: 19.4%
State average: 23.8%
State average: 4.4%
State average: 4.6%
State average: 3.1%
State average: 5.1%
State average: 5.2%
State average: 16.9%
State average: 91.9%
State average: 95.5%
State average: 1.84
State average: 2.16
State average: 75.6%
State average: 2.2%
State average: 73.5%
State average: 23.0%
State average: 11.7%
State average: 0.8%
State average: 53.7%
State average: 50.6%
Quality measures are calculated from Minimum Data Set (MDS) assessments. For most measures, lower percentages indicate better care quality.
24% of new residents, usually for short-term rehab.
33% of new residents, often for short stays.
43% of new residents, often for long-term daily care.
Source: CMS Long-Term Care Facility Characteristics (Data as of Jan 2026)
Residents meet regularly to discuss policies, care quality, and activities
State-approved Nurse Aide Training and Competency Evaluation Program on-site
Organized group of residents that meets regularly to discuss facility policies, quality of life, and activities.
Data sourced from CMS Long-Term Care Facility Characteristics quarterly report. Payer mix reflects the current resident census by primary payment source.
Historical financial and operational data for Life Care Center of Burlington from 2011–2023, based on CMS SNF Cost Reports.
Based on CMS SNF Cost Report for fiscal year ending in 12/2023.
Most residents stay for extended periods and receive ongoing daily care.
New residents most often arrive under Medicaid (43% of admissions), and a typical Medicaid stay runs around 7 - 8 months.
Coverage residents most often arrive under.
Coverage residents most often leave under.
![]() 0.0 miles from city center
0.0 miles from city center
![]() Estimated distance in miles from Burlington's city center to Life Care Center of Burlington's address, calculated via Google Maps.
Estimated distance in miles from Burlington's city center to Life Care Center of Burlington's address, calculated via Google Maps.
Add your location
The information below is reported by the Kansas Department for Aging and Disability Services.
| Life Care Center of Burlington | NH MC | Burlington | - | 77 | - | 46 | - |
| Brookdale Rosehill | NH AL | Shawnee | - | 92 | A+ | 54 | Studio / 1 Bed |
| Ascension Living Via Christi Village McLean | NH AL IL MC | Wichita (Indian Hills) | - | 95 | - | 47 | Studio / 1 Bed |
| Ascension Living Via Christi Village Manhattan | NH AL IL | Manhattan (Willow Grove Road) | - | 129 | - | 10 | Studio / 1 Bed / 2 Bed |
| Claridge Court | NH IL | Prairie Village (Prairie Hills) | - | 45 | A+ | 64 | - |
Life Care Center of Burlington is legally operated by Burlington Real Estate Investors Llc, and administered by Elizabeth Stockebrand.
Life Care Center of Burlington has a walk score of 46. Somewhat walkable. A few nearby services may be reachable on foot, but most trips require transportation.
According to KS state health department records, Life Care Center of Burlington's license number is 175373.
Life Care Center of Burlington's occupancy is 96%.
Life Care Center of Burlington is registered as a for-profit in KS.
Elizabeth Stockebrand is the administrator of Life Care Center of Burlington.
Life Care Center of Burlington has 77 beds.
Care Cost Calculator: See Prices in Your Area
Nursing Home Data Explorer
Don’t Wait Too Long: 7 Red Flag Signs Your Parent Needs Assisted Living Now
The True Cost of Assisted Living in 2025 – And How Families Are Paying For It
Understanding Senior Living Costs: Pricing Models, Discounts & Financial Assistance


