Glenwood Health and Rehabilitation Center

Nursing Home
Overview of Glenwood Health and Rehabilitation Center
Glenwood Health and Rehabilitation Center offers an advanced approach to short-term rehab and long-term care. The facility provides personalized care plans and state-of-the-art treatments in a supportive environment. It is committed to helping residents reach their full recovery potential.
(404) 284-6414

Quality ratings

Measured by Centers for Medicare & Medicaid Services (CMS)

Overall rating Info Official CMS rating based on health inspections, staffing and quality measures.
1/5
Georgia average: 2.6/5
Health Inspection Info Official CMS rating based on deficiencies found during state health inspections.
1/5
Georgia average: 2.8/5
Staffing Info Official CMS rating based on nurse staffing hours per resident per day.
1/5
Georgia average: 2.3/5

Nursing care per resident

Info Average daily nursing hours per resident (adjusted for acuity). Higher values indicate more nursing time per resident.
2h 46m per day

This home provides 22% less nursing time per resident than the state average.

Georgia average: 3h 33m per day

Capacity and availability

High-capacity home

May provide extensive amenities, services and programs.

Total beds 225

This home usually has limited availability

Occupancy is moderate, suggesting balanced demand.

Similar demand to the Georgia average
Occupancy rate 88.4%
Residents per day (avg) 206
Occupancy rate
88.4%
Residents per day (avg)
206

Who this home usually serves

TYPE OF STAY

Mostly long-term care residents

Most residents stay for extended periods and receive ongoing daily care.

Might be optimal for
Long-term daily care Ongoing support needs

Breakdown by payment type

Medicare

9% of new residents, usually for short-term rehab.

Typical stay 1 - 2 months

Private pay

31% of new residents, often for short stays.

Typical stay 1 - 2 months

Medicaid

60% of new residents, often for long-term daily care.

Typical stay 4 - 5 months

Finances and operations

Proprietary home
Corporation
Home revenue
$20.5M
Operating loss
-$733.2K
Proprietary home Corporation
Home revenue
$20,540,895.00
Operating loss
$-733,225.00
Payroll costs Info The portion of the home's budget spent on staff, including nurses, caregivers, and other employees who support care and operations.
$8.2M
39.9% of revenue
Other operating costs Info All remaining costs needed to run the home, such as food, utilities, building maintenance, supplies and administrative expenses.
$13.1M
Total costs $21.3M
Bed community size
225-bed community
A large-scale community that may provide a wide range of amenities, services, and structured programs.
Years in operation
9 years in operation
An established community with some operational experience and growing routines.

About this community

License Status
SNF/NF DUAL CERT
Facility Type
NURSING HOME
License Date
November 1, 2016

Additional licensing details

CMS Certification Number: 115025
County: DEKALB

Ownership & operating entity

Glenwood Health and Rehabilitation Center is administrated by Ms DONNA HUFFSTUTLER.

Care Services

Nursing Services
Rehabilitation Services
Respite Care
Skilled Nursing
Licensed Nurses/CNAs
24-Hour Staffing
Short-Term Rehab

Contact Information

Programs & Activities

Specific Programs
Short-Term Rehab, Long-Term Care, 24/7 Nursing Care, Assistance with Daily Living, Respite Care, Speech Therapy, Physical Therapy, Occupational Therapy, Wound Care, Tracheostomy Care, Orthopedic Rehab, Post-Surgical Care, Pulmonary Care, Bariatric Care, Oncology Care, Hospice Care

Inspection History

In Georgia, the Department of Community Health, Healthcare Facility Regulation Division conducts unannounced inspections to ensure facilities adhere to state health and safety requirements.

Compare Nursing Homes around Decatur

The information below is reported by the Georgia Department of Community Health, Healthcare Facility Regulation Division.
North Decatur Health and Rehabilitation Center
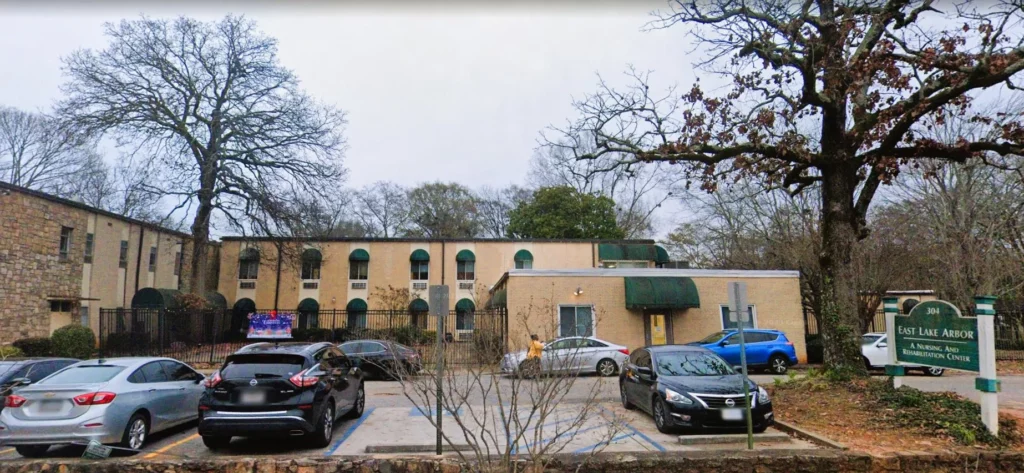
SNF

Nursing Home 24/7 care needed

AL

Assisted Living For seniors needing help with daily tasks but not full-time nursing.

GA 30033
73
No
-
GA NC 14, LLC
90.1%
$9,280,664.00
$3,708,719.00
40%
63.90
3/5
3.1574
3/5
2/5
2/5
2
14
-
+39%
-11%
+15%
East Lake Arbor
AL

Assisted Living For seniors needing help with daily tasks but not full-time nursing.

IL

Independent Living For self-sufficient seniors seeking community and minimal assistance.

MC

Memory Care Specialized care for those with Memory Loss, Alzheimer's, or dementia, ensuring safety and support.

SNF

Nursing Homes 24/7 care needed

Decatur (Oakhurst)
103
No
63
-
88.7%
$9,798,083.00
$1,140,742.00
11.6%
85.50
1/5
2.0827
1/5
1/5
4/5
3
31
3
-29%
-41%
+14%
Glenwood Health and Rehabilitation Center
SNF

Nursing Home 24/7 care needed

AL

Assisted Living For seniors needing help with daily tasks but not full-time nursing.

GA 30032
225
No
-
CABALLERO, CHRISTOPHER
88.4%
$20,335,054.00
$8,197,730.00
40.3%
206.20
1/5
2.7594
1/5
1/5
-
2
42
3
+34%
-22%
+13%
Glenwood Health and Rehabilitation Center
SNF

Nursing Home 24/7 care needed

AL

Assisted Living For seniors needing help with daily tasks but not full-time nursing.

GA 30032
225
No
-
CABALLERO, CHRISTOPHER
88.4%
$20,335,054.00
$8,197,730.00
40.3%
206.20
1/5
2.7594
1/5
1/5
-
2
42
3
+34%
-22%
+13%
Glenwood Health Center by Harborview
AL

Assisted Living For seniors needing help with daily tasks but not full-time nursing.

IL

Independent Living For self-sufficient seniors seeking community and minimal assistance.

MC

Memory Care Specialized care for those with Memory Loss, Alzheimer's, or dementia, ensuring safety and support.

SNF

Nursing Homes 24/7 care needed

Decatur
225
No
68
CABALLERO, CHRISTOPHER
88.4%
$20,335,054.00
$8,197,730.00
40.3%
206.20
1/5
2.7594
1/5
1/5
-
2
42
3
+34%
-22%
+13%

Places of interest near Glenwood Health and Rehabilitation Center

Address 0.0 miles from city center

Address DECATUR, GA 30032

Calculate Travel Distance to Glenwood Health and Rehabilitation Center

Add your location

Address

Staffing Data

Source: CMS Payroll-Based Journal (Q2 2025)

216
Total Staff
213
Employees
3
Contractors
65,101
Total Hours (Quarter)
91
Avg Staff/Day
7.9
Avg Shift (hrs)
Nursing Staff Breakdown
Role Count Avg Shift (hrs) Uses Contractors?
Registered Nurse249 Yes
Licensed Practical Nurse378.8 No
Certified Nursing Assistant1017.2 No
Staff by Category
Administration
3 staff
8hs shift avg
Nursing Staff
186 staff
7.8hs shift avg
Physicians & Practitioners
5 staff
8hs shift avg
Therapy Services
8 staff
8.9hs shift avg
Activities & Recreation
3 staff
9.2hs shift avg
Social Services
2 staff
6.2hs shift avg
Dietary Services
5 staff
8hs shift avg
Other Services
4 staff
8hs shift avg
Contractor Analysis
0.9%
of total hours from contractors
608 contractor hours this quarter
Registered Nurse: 1 Occupational Therapy Aide: 1 Medical Director: 1
Role Employees Contractors Total Staff Total Hours Days Worked % of Days Avg Shift (hrs)
Certified Nursing Assistant101010129,67791100%7.2
Licensed Practical Nurse3703715,44491100%8.8
Registered Nurse231245,03091100%9
Medication Aide/Technician190193,85991100%7.5
RN Director of Nursing5051,7838796%8.2
Clinical Nurse Specialist4041,1056774%8
Other Dietary Services Staff3031,0648492%8
Administrator2021,0246470%8
Dietitian2029947684%8
Physical Therapy Aide2029866571%8.7
Mental Health Service Worker4048486268%8
Respiratory Therapy Technician2026406470%10
Qualified Social Worker2026127684%6.2
Qualified Activities Professional3035756167%9.2
Physical Therapy Assistant2025415459%9
Speech Language Pathologist1014735965%8
Nurse Practitioner1013764752%8
Occupational Therapy Aide0114867%8
Medical Director0112433%8

Health Inspection History

Inspections
Total health inspections 7

Georgia average 3.4


Last Health inspection on Jul 2025

Total health citations 42
Citations per inspection
6

Health citations are formal notices following inspections when they fail to comply with safety and care standards.

7 of 42 citations resulted from standard inspections; 9 of 42 resulted from complaint investigations; and 26 of 42 came from combined inspections (standard and complaint).

Breakdown of citation severity (last 3 years)
Critical Health citations More info 3
329% worse than Georgia average

Georgia average: 0.7


Serious Health citations More info 0
100% better than Georgia average

Georgia average: 0.5

3 critical citations More info Georgia average: 0.7

0 serious citations More info Georgia average: 0.5

39 moderate citations More info Georgia average: 15.2

0 minor citations More info Georgia average: 0.2
Citations history (last 3 years)
Abuse/Neglect moderate citation Jul 29, 2025
Corrected

Nutrition moderate citation Jul 29, 2025
Corrected

Care Planning moderate citation Jul 29, 2025
Corrected

Resident Rights moderate citation Jul 29, 2025
Corrected

Facility Characteristics

Source: CMS Long-Term Care Facility Characteristics (Data as of Jan 2026)

Ownership: For-Profit LLC
Part of: Harborview Health System
Resident Census by Payment Source
211 Total Residents
Medicare 7 (3.3%)
Medicaid 168 (79.6%)
Private Pay/Other 36 (17.1%)
Programs & Services
Residents' Group
Family Engagement

Active councils help families stay involved in care decisions and facility operations.

Quality of care over time

These measures show how residents usually do over time at this home, based on health outcomes and preventive care.

High-risk clinical events score Info A composite score based on pressure ulcers, falls with injury, weight loss, walking ability decline, and activities of daily living decline. 12.6
23% worse than Georgia average

Georgia average: 10.3

Functional decline score Info A composite score based on activities of daily living decline, walking ability decline, and incontinence. 23.1
33% worse than Georgia average

Georgia average: 17.4

Long-stay resident measures
Need for Help with Daily Activities Increased Info Percent of long-stay residents whose need for help with daily activities has increased 13.2%
21% better than Georgia average

Georgia average: 16.8%

Walking Ability Worsened Info Percent of long-stay residents whose ability to move independently worsened 33.1%
70% worse than Georgia average

Georgia average: 19.4%

Low Risk Residents with Bowel/Bladder Incontinence Info Percent of low risk long-stay residents who lose control of their bowels or bladder 23.0%
43% worse than Georgia average

Georgia average: 16.1%

Falls with Major Injury Info Percent of long-stay residents experiencing one or more falls with major injury 0.9%
73% better than Georgia average

Georgia average: 3.2%

High Risk Residents with Pressure Ulcers Info Percent of long-stay high risk residents with pressure ulcers 6.4%
In line with Georgia average

Georgia average: 6.3%

Urinary Tract Infection Info Percent of long-stay residents with a urinary tract infection 1.1%
55% better than Georgia average

Georgia average: 2.5%

Lost Too Much Weight Info Percent of long-stay residents who lose too much weight 9.6%
60% worse than Georgia average

Georgia average: 6.0%

Depressive Symptoms Info Percent of long-stay residents who have depressive symptoms 44.4%
408% worse than Georgia average

Georgia average: 8.7%

Pneumococcal Vaccine Info Percent of long-stay residents assessed and appropriately given the pneumococcal vaccine 58.4%
36% worse than Georgia average

Georgia average: 91.5%

Influenza Vaccine Info Percent of long-stay residents assessed and appropriately given the seasonal influenza vaccine 79.8%
16% worse than Georgia average

Georgia average: 95.0%

Short-stay resident measures
Pneumococcal Vaccine Info Percent of short-stay residents assessed and appropriately given the pneumococcal vaccine 48.1%
40% worse than Georgia average

Georgia average: 80.6%

Antipsychotic medication increase Info Percent of short-stay residents who newly received an antipsychotic medication 2.0%
10% better than Georgia average

Georgia average: 2.2%

Influenza Vaccine Info Percent of short-stay residents assessed and appropriately given the seasonal influenza vaccine 55.8%
29% worse than Georgia average

Georgia average: 78.2%

Penalties and fines

Federal penalties imposed by CMS for regulatory violations, including civil money penalties (fines) and denials of payment for new Medicare/Medicaid admissions.

Source: CMS Penalties Database (Data as of Jan 2026)

Total fines amount $13K
67% lower than Georgia average

Georgia average: $40K

Number of fines 2
In line with Georgia average

Georgia average: 2.1

Payment Denials Info Serious action where Medicare and/or Medicaid temporarily stops payments for new residents until issues are fixed. 1
252% more payment denials than Georgia average

Georgia average: 0.3

Fines amount comparison
This facility $13K
Georgia average $40K
Penalty History

Penalties are imposed by CMS for violations of federal nursing home regulations.

Civil Money Penalty Info Fines imposed for noncompliance, which can be assessed per day or per instance of violation. Oct 11, 2024
$7K
Civil Money Penalty Info Fines imposed for noncompliance, which can be assessed per day or per instance of violation. Oct 11, 2024
$7K
Payment Denial Info Serious action where Medicare and/or Medicaid temporarily stops payments for new residents until issues are fixed. Oct 11, 2024
5 days

Last updated: Jan 2026

Guides for Better Senior Living

Care Cost Calculator: See Prices in Your Area

Nursing Home Data Explorer

Don’t Wait Too Long: 7 Red Flag Signs Your Parent Needs Assisted Living Now

The True Cost of Assisted Living in 2025 – And How Families Are Paying For It

Understanding Senior Living Costs: Pricing Models, Discounts & Financial Assistance

Financial Aid for Georgia Seniors

Get financial aid guidance

Community Care Services Program

Georgia Medicaid CCSP

Age 65+ or disabled, Georgia resident, Medicaid-eligible, nursing home-level care need.

~$2,829/month (300% FBR, individual).

$2,000 (individual), $3,000 (couple).

High rural demand; waitlists possible.

Respite Care Program

Georgia NFCSP Respite

Caregiver of someone 60+ (or with dementia), Georgia resident.

No strict limit; prioritizes low-income.

Not applicable.

Focus on metro and rural balance.

Home and Community Services (HCS)

Georgia Home and Community Services (Non-Medicaid)

Age 60+, Georgia resident, functionally impaired, at risk of nursing home placement.

No strict limit; prioritizes ~$41,000/year; cost-sharing for higher incomes.

Not specified; need-based.

Non-Medicaid; AAA-managed.

Medicare Savings Program (MSP)

Georgia Medicare Savings Program

Age 65+ or disabled, Georgia resident, Medicare Part A/B.

~$2,510/month (QMB), ~$3,380/month (SLMB), ~$3,598/month (QI).

$9,430 (individual), $14,130 (couple).

Three tiers; entitlement benefit.

Program of All-Inclusive Care for the Elderly (PACE)

Georgia Medicaid PACE

Age 55+, Georgia resident, nursing home-level care need, safe with PACE support.

~$2,829/month (300% FBR).

$2,000 (individual), $3,000 (couple).

Limited areas (e.g., Macon, Augusta).

Senior Community Service Employment Program (SCSEP)

Georgia SCSEP (Federally Funded, State-Administered)

Age 55+, unemployed, low-income, Georgia resident.

~$1,983/month (125% FPL).

Not specified; income-focused.

~1,200 slots; prioritizes veterans, rural residents.

SOURCE (Service Options Using Resources in a Community Environment)

Georgia Medicaid SOURCE Program

Age 65+ or disabled, Georgia resident, Medicaid-eligible, frail but not necessarily nursing home-level.

~$914/month (SSI level); QIT allowed.

$2,000 (individual), $3,000 (couple).

Enhanced primary care model; statewide via 12 sites.

Optional State Supplementation (OSS)

Georgia Optional State Supplementation

Age 65+ or disabled, Georgia resident, in approved facility, low-income/SSI recipient.

~$1,004/month (including SSI).

$2,000 (individual), $3,000 (couple).

~$20-$489/month based on facility type.