South Hampton Place
Nursing Home · Columbia, MO
CMS overall rating Info The Overall CMS Rating is scored from 1 to 5 stars and combines results from health inspections, staffing levels, and quality measures. Health inspections carry the most weight. Staffing and quality scores can increase or decrease the final rating based on performance compared to state and national standards.

South Hampton Place

Nursing Home · Columbia, MO
CMS overall rating Info The Overall CMS Rating is scored from 1 to 5 stars and combines results from health inspections, staffing levels, and quality measures. Health inspections carry the most weight. Staffing and quality scores can increase or decrease the final rating based on performance compared to state and national standards.
Calculator: See prices in your area
South Hampton Place accepts Medicare, Medicaid, and private pay.

Overview of South Hampton Place

One of Columbia’s premier nursing homes, South Hampton Place is where residents receive one of the best professional and medical care. The nursing home is proud to be a results-driven rehabilitation center where families and residents are empowered to reach healthcare excellence. South Hampton has committed staff who strive to enhance and enrich the health of its residents for a speedy recovery.
The nursing home’s center of excellence is in healthcare services. They provide life enrichment programs, including recreational activities and social events; rehabilitative services, such as wound care and therapy (occupational, physical, and speech); and personalized care is also offered to maximize the potential of its residents by ensuring that their needs are all met.

(573) 874-3674

Quality ratings

Measured by Centers for Medicare & Medicaid Services (CMS)

Overall rating Info The Overall CMS Rating combines results from health inspections, staffing levels and quality measures. Health inspections carry the most weight. Staffing and quality scores can increase or decrease the final rating based on performance compared to state and national standards.
▼ 59.7% Below MO avg. ▼ 59.7% Below MO avg.Click the badge to see the full State ranking.Click here to see the full State ranking.
Health Inspection Info Based on the results of the facility's three most recent standard inspections and any complaint investigations. CMS reviews the number, scope, and severity of deficiencies, with more recent findings weighted more heavily.
▼ 27.9% Below MO avg. ▼ 27.9% Below MO avg.Click the badge to see the full State ranking.Click here to see the full State ranking.
Staffing Info Measures average nursing staff hours per resident per day, including Registered Nurses (RNs) and total nursing staff. Ratings are adjusted based on the level of care residents require and are compared to state and national benchmarks.
▼ 54.3% Below MO avg. ▼ 54.3% Below MO avg.Click the badge to see the full State ranking.Click here to see the full State ranking.
Quality Measures Info Based on clinical and physical health indicators reported to CMS, such as hospital readmissions, falls, pressure ulcers, and improvements in mobility. These measures reflect how well residents' health needs are being managed.
▼ 62.4% Below MO avg. ▼ 62.4% Below MO avg.Click the badge to see the full State ranking.Click here to see the full State ranking.

Staffing hours breakdown

Info Daily nursing hours per resident by staff type, reported to CMS. Higher is generally better — compare this facility to state and national averages to see where staffing stands.

Hours per resident per day — compared to Missouri state averages

Total nursing care / resident Info This home is ranked 175th out of 256 homes in Missouri.

Total adjusted nursing hours per resident per day, combining RN, LPN, and aide time. CMS adjusts this for case-mix so facilities can be fairly compared.
3h 27m per day
Rank #175 / 256Nurse hours — State benchmarkedThis home is ranked 175th out of 256 homes in Missouri.Shows adjusted nurse hours per resident per day benchmarked to the Missouri average, with a ranking across 256 Missouri SNFs. More hours mean more direct care. The national average is about 3.5 hrs; below 3.0 is a red flag.Click the rank badge to see the full State ranking.Click here to see the full State ranking.
This facility Missouri avg (3h 44m per day)
vs Missouri avg
-8%
Staff typeHours / Day / Residentvs state avg
Total Nursing (Weekend) Info Combined nursing hours (RN + LPN + Nurse Aide) per resident per day on weekends. Staffing often drops on weekends — this figure reveals whether the facility maintains adequate coverage outside of weekday hours. 2h 47m per day

Capacity and availability

This home usually has availability

Occupancy lower than 85% suggests more openings may be available.

Lower occupancy than the Missouri average: 66.6%
Occupancy rate 62.9% Rank #178 / 262Occupancy rate — State benchmarkedThis home is ranked 178th out of 262 homes in Missouri.Shows this facility's occupancy rate versus the Missouri average, with its Statewide rank out of 262. Higher occupancy signals strong local demand and financial stability.Click the rank badge to see the full State ranking.Click here to see the full State ranking.
Avg. Length of Stay 82 days
Occupancy rate
62.9% Rank #178 / 262Occupancy rate — State benchmarkedThis home is ranked 178th out of 262 homes in Missouri.Shows this facility's occupancy rate versus the Missouri average, with its Statewide rank out of 262. Higher occupancy signals strong local demand and financial stability.Click the rank badge to see the full State ranking.Click here to see the full State ranking.
Avg. Length of Stay
82 days

Who this home usually serves

TYPE OF STAY

Mix of rehab and long-term care

This home supports both short-term rehab and long-term care, with residents staying for a wide range of durations.

Breakdown by payment type

Medicare

30% of new residents, usually for short-term rehab.

Typical stay 1 - 2 months

Private pay

38% of new residents, often for short stays.

Typical stay 2 - 3 months

Medicaid

32% of new residents, often for long-term daily care.

Typical stay 8 - 9 months

Finances and operations

Privately-owned community
Operated by a business corporation.
Home revenue
$6.6M
Operating loss
-$88.4K
Privately-owned community Operated by a business corporation.
Home revenue
$6.6M Rank #119 / 263Revenue — State benchmarkedThis home is ranked 119th out of 263 homes in Missouri.Shows this facility's annual revenue compared to the Missouri SNF average. Higher revenue generally means more resources for staffing and capital — read alongside Payroll %.Click the rank badge to see the full State ranking.Click here to see the full State ranking.
Operating loss
-$88.4K
Payroll costs Info The portion of the home's budget spent on staff, including nurses, caregivers, and other employees who support care and operations. Rank #132 / 263Payroll — State benchmarkedThis home is ranked 132nd out of 263 homes in Missouri.Shows total annual staff payroll benchmarked to the Missouri average. Higher payroll investment relative to peers often signals better staffing and less reliance on cheaper contract labor.Click the rank badge to see the full State ranking.Click here to see the full State ranking.
$3.5M
52.8% of revenue Rank #148 / 263Payroll % — State benchmarkedThis home is ranked 148th out of 263 homes in Missouri.Shows payroll as a percentage of revenue versus the Missouri average. Well-run Missouri SNFs typically land around 60–71% — the top third Statewide. Below 25% may signal understaffing or heavy agency use — read with Staffing ratings.Click the rank badge to see the full State ranking.Click here to see the full State ranking.
Other operating costs Info All remaining costs needed to run the home, such as food, utilities, building maintenance, supplies and administrative expenses.
$3.2M
Total costs $6.7M
Walk Score
Walk Score: 5 / 100 Rank #256 / 264Walk Score — State benchmarkedThis home is ranked 256th out of 264 homes in Missouri.Shows how walkable this facility's neighborhood is compared to the average Walk Score across Missouri SNFs. Higher scores benefit residents, families, and staff.Click the rank badge to see the full State ranking.Click here to see the full State ranking.
Car-dependent. Most errands require a car, with limited nearby walkable options.

Contact South Hampton Place

Health Inspection History

Inspections Since 2023
Total health inspections 5

Missouri average 6.6


Last Health inspection on Nov 2025

Total health citations
33 Rank #147 / 261Health citations — State benchmarkedThis home is ranked 147th out of 261 homes in Missouri.Shows this facility's total health deficiency citations benchmarked to the Missouri State average, with a ranking across all 261 MO SNFs. Lower citation counts earn a better rank.Click the rank badge to see the full State ranking.Click here to see the full State ranking.

Missouri average 36.5

Citations per inspection
6.6 Rank #193 / 261Citations per inspection — State benchmarkedThis home is ranked 193rd out of 261 homes in Missouri.Shows average deficiency citations per CMS inspection for this facility versus the Missouri mean across 261 SNFs with citation data. Lower is better.Click the rank badge to see the full State ranking.Click here to see the full State ranking.

Missouri average 5.67


Health citations are formal notices following inspections when they fail to comply with safety and care standards.

29 of 33 citations resulted from standard inspections; 3 of 33 resulted from complaint investigations; and 1 of 33 came from combined inspections (standard and complaint).

Breakdown of citation severity (last 3 years)
Critical Health citations
0
100% better than Missouri average

Missouri average: 0.7


Serious Health citations
1 Rank #1 / 119Serious citations (G–I) — State benchmarkedThis home is ranked 1st out of 119 homes in Missouri.Shows G–I scope serious health citations for this facility versus other Missouri SNFs. Lower counts rank better.Click the rank badge to see the full State ranking.Click here to see the full State ranking.
In line with Missouri average

Missouri average: 1

0 critical citations Missouri average: 0.7

1 serious citation Missouri average: 1

28 moderate citations Missouri average: 33.6

4 minor citations Missouri average: 1.2
Citations history (last 3 years)
Nursing Services moderate citation Nov 17, 2025

Quality of Care serious citation Nov 17, 2025

Care Planning moderate citation May 30, 2025
Corrected

Administration minor citation Apr 08, 2025
Corrected

Financial Assistance for
Nursing Home in Missouri

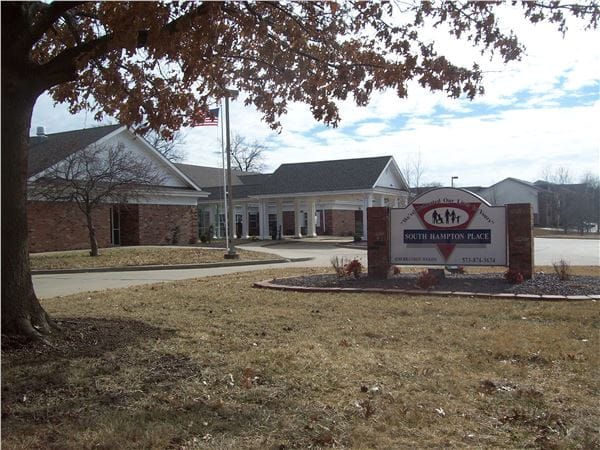
South Hampton Place is located in Columbia, Missouri.
Here are the financial assistance programs available to residents in Missouri.

Get Financial aid guidance

Aged and Disabled Waiver

Missouri Medicaid A&D Waiver

Age 65+ or disabled
General Missouri resident, Medicaid- eligible, nursing home-level care need.
Income Limits (2025) ~$2,829/month 300% FBR, individual
Asset Limits $2,000 (individual), $3,000 (couple).
MO

Rural access prioritized.

Benefits
Personal care (5-7 hours/day) Respite (240 hours/year) Adult day care (~$65/day) Home health services

Missouri Supplemental Nursing Care (SNC)

MO SNC

Age 65+
General Missouri resident, in approved facility.
Income Limits ~$1,215/month individual
Asset Limits $2,000 individual
MO

Supplements SSI; facility-based only.

Benefits
Monthly cash payment (~$156-$292/month) for care costs

Structured Family Caregiving Waiver (SFCW)

Missouri Structured Family Caregiving Waiver

Age 65+
General Missouri resident, MO HealthNet-eligible, NFLOC, dementia diagnosis, live with caregiver.
Income Limits (2025) ~$2,901/month (300% FBR, individual); QIT required.
Asset Limits $5,909.25 (individual), $11,818.45 (couple).
MO

Caregiver must be family; small program size.

Benefits
Cash stipend ($1,000-$1,500/month) to family caregiver Respite Training Supplies ($500/year)

MO HealthNet Aged, Blind, and Disabled (ABD)

Missouri MO HealthNet ABD

Age 65+ or disabled
General Missouri resident, MO HealthNet-eligible, needs help with 1+ ADL.
Income Limits (2025) ~$1,690/month (individual, projected); spenddown allowed.
Asset Limits $5,909.25 (individual), $11,818.45 (couple).
MO

Less intensive than waivers; statewide access.

Benefits
Personal care (2-4 hours/day) Homemaker services Limited respite Medical equipment

Medicare Savings Program (MSP)

Missouri Medicare Savings Program

Age 65+ or disabled
General Missouri resident, Medicare Part A/B.
Income Limits (2025) ~$2,510/month (QMB), ~$3,380/month (SLMB), ~$3,598/month (QI)—individual.
Asset Limits $9,430 (individual), $14,130 (couple).
MO

Three tiers; no waitlist; includes Extra Help for Part D.

Benefits
Covers Part B premiums ($174.70/month) Deductibles ($240/year) Copays (~20%)

Missouri Caregiver Program (Customized Caregiver Training & Relief)

Missouri Caregiver Program

Age
General Caregivers of 60+ with dementia, Missouri resident, functional needs (2+ ADLs).
Income Limits (2025) No strict cap; prioritizes low-income ~$24,980/year individual
Asset Limits Not assessed; need-based.
MO

Administered via AAAs and Alzheimer’s Association; rural focus.

Benefits
Respite (4-6 hours/week) Training Assistive tech ($500/year) Supplies

VA Aid and Attendance (A&A) and Housebound Benefits

Missouri VA Aid and Attendance/Housebound

Age 65+ or disabled veteran/spouse
General Missouri resident, wartime service, need for ADL help (A&A) or homebound.
Income Limits (2025) Net income < ~$1,984/month (veteran with dependent, A&A); pension offsets income.
Asset Limits ~$155,356 net worth limit
MO

High veteran demand in rural/urban areas.

Benefits
Cash (~$1,433-$2,642/month veteran, ~$951-$1,318 spouse) for care costs (e.g., in-home, assisted living)

Staffing Data

Reporting period: April 1 – June 30, 2025 (Q2 2025). Source: CMS Payroll-Based Journal report.

Total staff 88
Employees 71
Contractors 17
Staff to resident ratio 1.54:1
10% worse than Missouri average
Missouri average ratio: 1.71:1 Missouri average ratio: 1.71:1See full Missouri ranking
Avg staff/day 27
Average shift 7.9 hours
0% compared with Missouri average
Missouri average: 8.1 hours Missouri average shift: 8.1 hoursSee full Missouri ranking
Total staff hours (quarter) 19,321

Nursing staff breakdown

Q2 2025 · Apr 1 – Jun 30 More info This data comes from the CMS Payroll-Based Journal report covering April 1 – June 30, 2025.
Registered Nurse

Manages medical care and health needs.

Total count 6
Average shift length Info Average shift length. Calculated as total hours divided by days worked and average staff per day. 10.5 hours

No contractors work on this role.

Licensed Practical Nurse

Assists with medical care and medications.

Total count 7
Average shift length Info Average shift length. Calculated as total hours divided by days worked and average staff per day. 8.6 hours

This role is partially covered by contractors.

Certified Nursing Assistant

Helps with daily care and mobility.

Total count 25
Average shift length Info Average shift length. Calculated as total hours divided by days worked and average staff per day. 7.8 hours

No contractors work on this role.

Contractor staffing

Q2 2025 · Apr 1 – Jun 30 More info This data comes from the CMS Payroll-Based Journal report covering April 1 – June 30, 2025.

Total hours from contractors

8.9%

1,715 contractor hours this quarter

Physical Therapy Aide: 4 Respiratory Therapy Technician: 4 Speech Language Pathologist: 4 Qualified Social Worker: 2 Physical Therapy Assistant: 1 Licensed Practical Nurse: 1 Nurse Practitioner: 1

Staff by category

Q2 2025 · Apr 1 – Jun 30 More info This data comes from the CMS Payroll-Based Journal report covering April 1 – June 30, 2025.
Certified Nursing Assistant250255,88091100%7.8
Medication Aide/Technician8082,75691100%8.3
Licensed Practical Nurse6172,63191100%8.6
Nurse Aide in Training180182,5499099%7.5
Registered Nurse6061,9018998%10.5
Nurse Practitioner1126136571%8.2
Physical Therapy Aide0446066571%5.6
Respiratory Therapy Technician0445526875%6.7
Administrator2025526571%8
Other Dietary Services Staff1014746268%7.6
Physical Therapy Assistant0112896470%4.5
Qualified Social Worker0221546470%2.4
Dental Services Staff1011281618%8
Mental Health Service Worker1011181618%7.4
RN Director of Nursing202871415%6.2
Speech Language Pathologist0443278%3.5
25 Certified Nursing Assistant
% of Days 100%
8 Medication Aide/Technician
% of Days 100%
7 Licensed Practical Nurse
% of Days 100%
18 Nurse Aide in Training
% of Days 99%
6 Registered Nurse
% of Days 98%
2 Nurse Practitioner
% of Days 71%
4 Physical Therapy Aide
% of Days 71%
4 Respiratory Therapy Technician
% of Days 75%
2 Administrator
% of Days 71%
1 Other Dietary Services Staff
% of Days 68%
1 Physical Therapy Assistant
% of Days 70%
2 Qualified Social Worker
% of Days 70%
1 Dental Services Staff
% of Days 18%
1 Mental Health Service Worker
% of Days 18%
2 RN Director of Nursing
% of Days 15%
4 Speech Language Pathologist
% of Days 8%

Facility Characteristics

Source: CMS Long-Term Care Facility Characteristics (Data as of Jan 2026)

Total residents 57
Medicare
7
12.3% of residents
Medicaid
38
66.7% of residents
Private pay or other
12
21.1% of residents
Programs & Services
Nurse Aide Training

State-approved Nurse Aide Training and Competency Evaluation Program on-site

Quality of care over time

These measures show how residents usually do over time at this home, based on health outcomes and preventive care.

High-risk clinical events score Info A composite score based on pressure ulcers, falls with injury, weight loss, walking ability decline, and activities of daily living decline. 14.5
33% worse than Missouri average

Missouri average: 10.9

Functional decline score Info A composite score based on activities of daily living decline, walking ability decline, and incontinence. 26.5
36% worse than Missouri average

Missouri average: 19.5

Long-stay resident measures
Need for Help with Daily Activities Increased Info Percent of long-stay residents whose need for help with daily activities has increased 29.5%
49% worse than Missouri average

Missouri average: 19.8%

Walking Ability Worsened Info Percent of long-stay residents whose ability to move independently worsened 33.6%
63% worse than Missouri average

Missouri average: 20.6%

Low Risk Residents with Bowel/Bladder Incontinence Info Percent of low risk long-stay residents who lose control of their bowels or bladder 16.3%
10% better than Missouri average

Missouri average: 18.1%

Falls with Major Injury Info Percent of long-stay residents experiencing one or more falls with major injury 2.3%
43% better than Missouri average

Missouri average: 4.0%

High Risk Residents with Pressure Ulcers Info Percent of long-stay high risk residents with pressure ulcers 3.5%
31% better than Missouri average

Missouri average: 5.0%

Urinary Tract Infection Info Percent of long-stay residents with a urinary tract infection 2.8%
In line with Missouri average

Missouri average: 2.7%

Lost Too Much Weight Info Percent of long-stay residents who lose too much weight 3.6%
35% better than Missouri average

Missouri average: 5.6%

Depressive Symptoms Info Percent of long-stay residents who have depressive symptoms 0.0%
100% better than Missouri average

Missouri average: 12.8%

Antipsychotic Use Info Percent of long-stay residents who received an antipsychotic medication 25.9%
18% worse than Missouri average

Missouri average: 22.0%

Pneumococcal Vaccine Info Percent of long-stay residents assessed and appropriately given the pneumococcal vaccine 96.3%
13% better than Missouri average

Missouri average: 85.2%

Influenza Vaccine Info Percent of long-stay residents assessed and appropriately given the seasonal influenza vaccine 96.5%
6% better than Missouri average

Missouri average: 90.9%

Short-stay resident measures
Pneumococcal Vaccine Info Percent of short-stay residents assessed and appropriately given the pneumococcal vaccine 90.3%
36% better than Missouri average

Missouri average: 66.6%

Antipsychotic medication increase Info Percent of short-stay residents who newly received an antipsychotic medication 1.1%
51% better than Missouri average

Missouri average: 2.2%

Influenza Vaccine Info Percent of short-stay residents assessed and appropriately given the seasonal influenza vaccine 87.5%
38% better than Missouri average

Missouri average: 63.5%

Penalties and fines

Federal penalties imposed by CMS for regulatory violations, including civil money penalties (fines) and denials of payment for new Medicare/Medicaid admissions.

Source: CMS Penalties Database (Data as of Jan 2026)

Total fines amount $10K Rank #149 / 263Federal fines — State benchmarkedThis home is ranked 149th out of 263 homes in Missouri.Shows this facility's cumulative CMS federal fine dollars versus the Missouri average among facilities with fines, and where it ranks among 263 skilled nursing facilities in the pool. Lower total dollars mean a better rank.Click the rank badge to see the full State ranking.Click here to see the full State ranking.
87% lower than Missouri average

Missouri average: $73K

Number of fines 1
59% fewer fines than Missouri average

Missouri average: 2.4

Payment Denials Info Serious action where Medicare and/or Medicaid temporarily stops payments for new residents until issues are fixed. 1
45% more payment denials than Missouri average

Missouri average: 0.7

Fines amount comparison
This facility $10K
Missouri average $73K
Penalty History

Penalties are imposed by CMS for violations of federal nursing home regulations.

1 penalty in the past 3 years

Apr 8, 2025 · 7 days

Payment Denial Info Serious action where Medicare and/or Medicaid temporarily stops payments for new residents until issues are fixed. Apr 8, 2025
7 days

Last updated: Jan 2026

Guides for Better Senior Living

Care Cost Calculator: See Prices in Your Area

Nursing Home Data Explorer

Don’t Wait Too Long: 7 Red Flag Signs Your Parent Needs Assisted Living Now

The True Cost of Assisted Living in 2025 – And How Families Are Paying For It

Understanding Senior Living Costs: Pricing Models, Discounts & Financial Assistance

Frequently Asked Questions about South Hampton Place

Is South Hampton Place in a walkable area?

South Hampton Place has a walk score of 5. Car-dependent. Most errands require a car, with limited nearby walkable options.

What is the occupancy rate at South Hampton Place?

South Hampton Place's occupancy is 62.9%.

What is the phone number of South Hampton Place?

(573) 874-3674 will put you in contact with the team at South Hampton Place.

Is South Hampton Place Medicare or Medicaid certified?

Yes — South Hampton Place is a CMS-certified provider of Medicare and Medicaid.

Explore Open Rooms
1 Contact details
2 What type of senior care service are you looking for?
3 What budget do you have in mind for senior care?
4 How soon do you need to find care?
5 Additional details

Thank you for your interest!

Our team will be in touch shortly to help with next steps.