East Park Senior Apartments
Nursing Home & Independent Living · Helena, MT
CMS overall rating Info The Overall CMS Rating is scored from 1 to 5 stars and combines results from health inspections, staffing levels, and quality measures. Health inspections carry the most weight. Staffing and quality scores can increase or decrease the final rating based on performance compared to state and national standards.

East Park Senior Apartments

Nursing Home & Independent Living · Helena, MT
CMS overall rating Info The Overall CMS Rating is scored from 1 to 5 stars and combines results from health inspections, staffing levels, and quality measures. Health inspections carry the most weight. Staffing and quality scores can increase or decrease the final rating based on performance compared to state and national standards.
Calculator: See prices in your area
East Park Senior Apartments accepts Medicare, Medicaid, and private pay.

Overview of East Park Senior Apartments

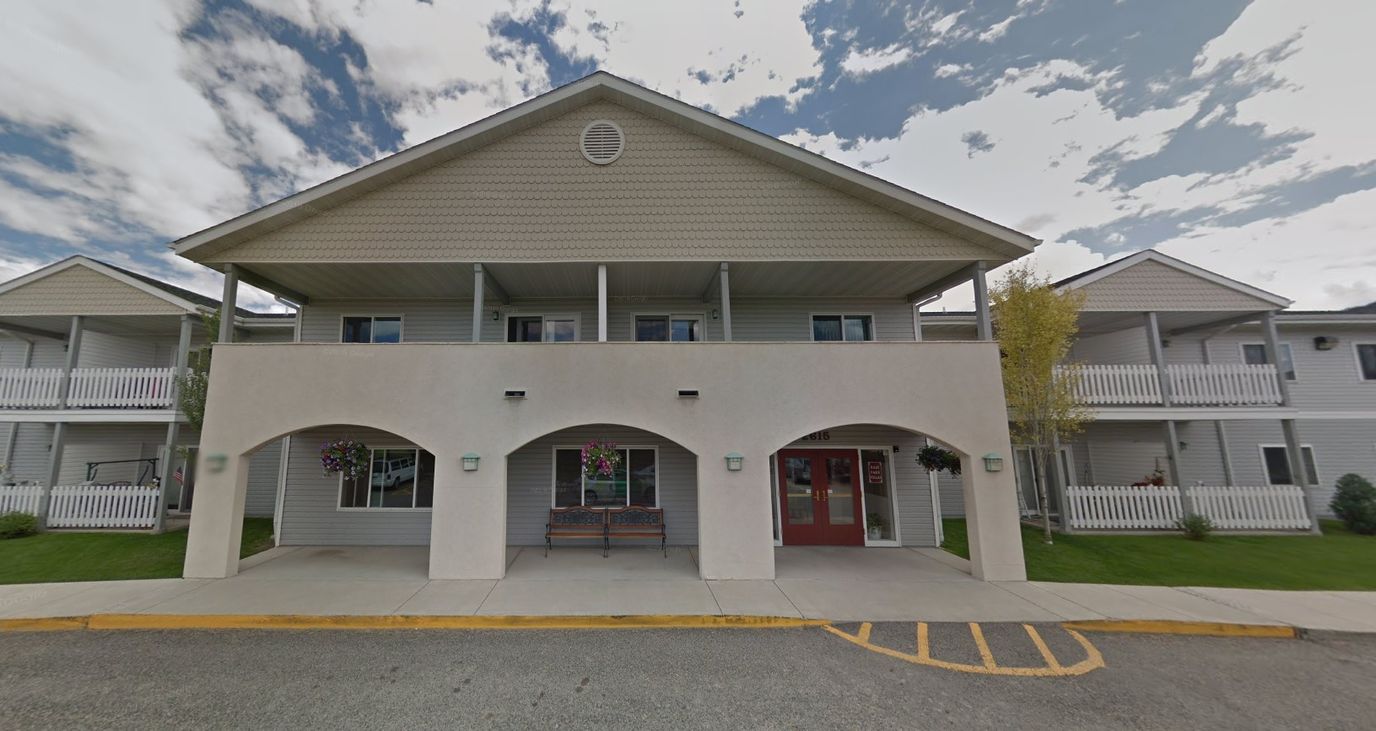
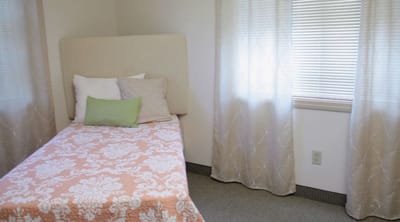
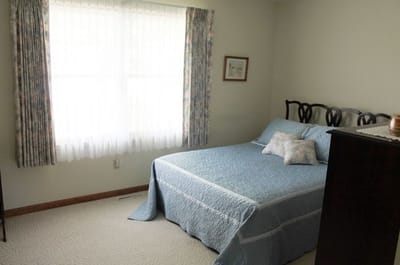
East Park Villas, located near historic downtown Helena, MT, is a classic senior living community that provides residents with an excellent independent living experience that combines comfort with style and elegance. An apartment-style, East Park Villas offers comfortable one- and two-bedroom apartments with open floor plans, walk-in showers, and ceiling fans. Conveniently situated close to Helena Regional, City Hill Mall, and Helena Airport, this community is designed to meet the needs of senior residents, providing an inviting and supportive living environment.

East Park Senior Apartments aims to create a welcoming and caring community where seniors can truly feel at home. The dedicated community staff is committed to assisting residents in finding their ideal living space. Amenities include spacious floor plans, modern conveniences, and a location that provides easy access to local attractions and necessities.

(406) 449-9795

Quality ratings

Measured by Centers for Medicare & Medicaid Services (CMS)

Overall rating Info The Overall CMS Rating combines results from health inspections, staffing levels and quality measures. Health inspections carry the most weight. Staffing and quality scores can increase or decrease the final rating based on performance compared to state and national standards.
▼ 66.1% Below MT avg. ▼ 66.1% Below MT avg.Click the badge to see the full State ranking.Click here to see the full State ranking.
Health Inspection Info Based on the results of the facility's three most recent standard inspections and any complaint investigations. CMS reviews the number, scope, and severity of deficiencies, with more recent findings weighted more heavily.
▼ 64.9% Below MT avg. ▼ 64.9% Below MT avg.Click the badge to see the full State ranking.Click here to see the full State ranking.
Staffing Info Measures average nursing staff hours per resident per day, including Registered Nurses (RNs) and total nursing staff. Ratings are adjusted based on the level of care residents require and are compared to state and national benchmarks.
▼ 68.9% Below MT avg. ▼ 68.9% Below MT avg.Click the badge to see the full State ranking.Click here to see the full State ranking.
Quality Measures Info Based on clinical and physical health indicators reported to CMS, such as hospital readmissions, falls, pressure ulcers, and improvements in mobility. These measures reflect how well residents' health needs are being managed.
▼ 32.6% Below MT avg. ▼ 32.6% Below MT avg.Click the badge to see the full State ranking.Click here to see the full State ranking.

Staffing hours breakdown

Info Daily nursing hours per resident by staff type, reported to CMS. Higher is generally better — compare this facility to state and national averages to see where staffing stands.

Hours per resident per day — compared to Montana state averages

Total nursing care / resident Info This home is ranked 34th out of 34 homes in Montana. Total adjusted nursing hours per resident per day, combining RN, LPN, and aide time. CMS adjusts this for case-mix so facilities can be fairly compared.
2h 24m per day
Rank #34 / 34Nurse hours — State benchmarkedThis home is ranked 34th out of 34 homes in Montana. Shows adjusted nurse hours per resident per day benchmarked to the Montana average, with a ranking across 34 Montana SNFs. More hours mean more direct care. The national average is about 3.5 hrs; below 3.0 is a red flag.Click the rank badge to see the full State ranking.Click here to see the full State ranking.
This facility Montana avg (4h 32m per day)
vs Montana avg
-47%

1 of 1 metrics below state avg

Staff typeHours / Day / Residentvs state avg
Weekend Total Nursing Info Combined nursing hours (RN + LPN + Nurse Aide) per resident per day on weekends. Staffing often drops on weekends — this figure reveals whether the facility maintains adequate coverage outside of weekday hours. 1h 58m per day ▼ 42% State avg: 3h 25m per day · National avg: 3h 25m per day

Capacity and availability

This home usually has availability

Higher occupancy than the Montana average: 61.7%
Occupancy rate
80.5% Rank #5 / 35Occupancy rate — State benchmarkedThis home is ranked 5th out of 35 homes in Montana. Shows this facility's occupancy rate versus the Montana average, with its Statewide rank out of 35. Higher occupancy signals strong local demand and financial stability.Click the rank badge to see the full State ranking.Click here to see the full State ranking.
Avg. Length of Stay
94 days
Walk Score
Walk Score: 37 / 100 Rank #92 / 159Walk Score — State benchmarkedThis home is ranked 92nd out of 159 homes in Montana. Shows how walkable this facility's neighborhood is compared to the average Walk Score across Montana SNFs. Higher scores benefit residents, families, and staff.Click the rank badge to see the full State ranking.Click here to see the full State ranking.
Somewhat walkable. A few nearby services may be reachable on foot, but most trips require transportation.

About this community

Contact East Park Senior Apartments

Staffing Data

Reporting period: October 1 – December 31, 2025 (Q4 2025). Source: CMS Payroll-Based Journal report.

Total staff 105
Employees 78
Contractors 27
Staff to resident ratio 1.67:1
10% worse than Montana average
Montana average ratio: 1.86:1 Montana average ratio: 1.86:1See full Montana ranking
Avg staff/day 28
Average shift 8.9 hours
0% compared with Montana average
Montana average: 8.6 hours Montana average shift: 8.6 hoursSee full Montana ranking
Total staff hours (quarter) 22,947

Nursing staff breakdown

Q4 2025 · Oct 1 – Dec 31 More info This data comes from the CMS Payroll-Based Journal report covering October 1 – December 31, 2025.
Registered Nurse

Manages medical care and health needs.

RN Staff Info 16 total: 9 full-time employees and 7 contractors. 16
Average shift length Info Average shift length. Calculated as total hours divided by days worked and average staff per day. 10 hours
Licensed Practical Nurse

Assists with medical care and medications.

LPN Staff Info 9 total: 4 full-time employees and 5 contractors. 9
Average shift length Info Average shift length. Calculated as total hours divided by days worked and average staff per day. 9.5 hours
Certified Nursing Assistant

Helps with daily care and mobility.

CNA Staff Info 48 total: 38 full-time employees and 10 contractors. 48
Average shift length Info Average shift length. Calculated as total hours divided by days worked and average staff per day. 10.1 hours

Contractor staffing

Q4 2025 · Oct 1 – Dec 31 More info This data comes from the CMS Payroll-Based Journal report covering October 1 – December 31, 2025.

Total hours from contractors

7.8%

1,790 contractor hours this quarter

Certified Nursing Assistant: 10 Registered Nurse: 7 Licensed Practical Nurse: 5 Respiratory Therapy Technician: 2 Physical Therapy Aide: 1 Speech Language Pathologist: 1 Qualified Social Worker: 1

Staff by category

Q4 2025 · Oct 1 – Dec 31 More info This data comes from the CMS Payroll-Based Journal report covering October 1 – December 31, 2025.
Certified Nursing Assistant3810488,01192100%10.1
Registered Nurse97163,66792100%10
Physical Therapy Aide8192,4197480%6.9
Licensed Practical Nurse4591,9778997%9.5
Speech Language Pathologist3141,1486975%6.9
Other Dietary Services Staff2029489098%6.9
Clinical Nurse Specialist2029126470%8
Medication Aide/Technician2027116267%11.2
Nurse Practitioner3035365863%8
Dental Services Staff1015296267%8.5
Administrator2025206470%8
RN Director of Nursing1015126470%8
Mental Health Service Worker1014966267%8
Therapeutic Recreation Specialist1013815863%6.6
Respiratory Therapy Technician1231011011%7.8
Qualified Social Worker011801011%8
48 Certified Nursing Assistant
% of Days 100%
16 Registered Nurse
% of Days 100%
9 Physical Therapy Aide
% of Days 80%
9 Licensed Practical Nurse
% of Days 97%
4 Speech Language Pathologist
% of Days 75%
2 Other Dietary Services Staff
% of Days 98%
2 Clinical Nurse Specialist
% of Days 70%
2 Medication Aide/Technician
% of Days 67%
3 Nurse Practitioner
% of Days 63%
1 Dental Services Staff
% of Days 67%
2 Administrator
% of Days 70%
1 RN Director of Nursing
% of Days 70%
1 Mental Health Service Worker
% of Days 67%
1 Therapeutic Recreation Specialist
% of Days 63%
3 Respiratory Therapy Technician
% of Days 11%
1 Qualified Social Worker
% of Days 11%

Penalties and fines

Includes penalties issued in 2023-2025

Federal penalties imposed by CMS for regulatory violations, including civil money penalties (fines) and denials of payment for new Medicare/Medicaid admissions.

Source: CMS Penalties Database (Data as of Jan 2026)

Total fines amount $153K Rank #31 / 35Federal fines — State benchmarkedThis home is ranked 31st out of 35 homes in Montana. Shows this facility's cumulative CMS federal fine dollars versus the Montana average among facilities with fines, and where it ranks among 35 skilled nursing facilities in the pool. Lower total dollars mean a better rank.Click the rank badge to see the full State ranking.Click here to see the full State ranking.
76% higher than Montana average

Montana average: $87K

Number of fines 4
72% more fines than Montana average

Montana average: 2.3

Payment Denials Info Serious action where Medicare and/or Medicaid temporarily stops payments for new residents until issues are fixed. 0
100% fewer payment denials than Montana average

Montana average: 0.2

Fines amount comparison
This facility $153K
Montana average $87K
Penalty History

Penalties are imposed by CMS for violations of federal nursing home regulations.

4 penalties in the past 3 years

Multiple penalties were reported in the last 3 years.

Civil Money Penalty Info Fines imposed for noncompliance, which can be assessed per day or per instance of violation. Aug 6, 2025
$22K
Civil Money Penalty Info Fines imposed for noncompliance, which can be assessed per day or per instance of violation. Aug 15, 2024
$44K
Civil Money Penalty Info Fines imposed for noncompliance, which can be assessed per day or per instance of violation. May 2, 2024
$53K
Civil Money Penalty Info Fines imposed for noncompliance, which can be assessed per day or per instance of violation. Aug 17, 2023
$34K

Last updated: Jan 2026

Quality of care over time

These measures show how residents usually do over time at this home, based on health outcomes and preventive care.

High-risk clinical events score Info A composite score based on pressure ulcers, falls with injury, weight loss, walking ability decline, and activities of daily living decline. 15.7
40% worse than Montana average

Montana average: 11.2

Functional decline score Info A composite score based on activities of daily living decline, walking ability decline, and incontinence. 29.3
34% worse than Montana average

Montana average: 21.8

Long-stay resident measures
Need for Help with Daily Activities Increased Info Percent of long-stay residents whose need for help with daily activities has increased 29.7%
53% worse than Montana average

Montana average: 19.4%

Walking Ability Worsened Info Percent of long-stay residents whose ability to move independently worsened 26.8%
29% worse than Montana average

Montana average: 20.8%

Low Risk Residents with Bowel/Bladder Incontinence Info Percent of low risk long-stay residents who lose control of their bowels or bladder 31.3%
24% worse than Montana average

Montana average: 25.2%

Falls with Major Injury Info Percent of long-stay residents experiencing one or more falls with major injury 4.8%
10% worse than Montana average

Montana average: 4.3%

High Risk Residents with Pressure Ulcers Info Percent of long-stay high risk residents with pressure ulcers 10.2%
62% worse than Montana average

Montana average: 6.3%

Urinary Tract Infection Info Percent of long-stay residents with a urinary tract infection 0.9%
68% better than Montana average

Montana average: 2.8%

Lost Too Much Weight Info Percent of long-stay residents who lose too much weight 6.8%
12% worse than Montana average

Montana average: 6.1%

Depressive Symptoms Info Percent of long-stay residents who have depressive symptoms 3.8%
20% better than Montana average

Montana average: 4.7%

Antipsychotic Use Info Percent of long-stay residents who received an antipsychotic medication 30.7%
61% worse than Montana average

Montana average: 19.1%

Pneumococcal Vaccine Info Percent of long-stay residents assessed and appropriately given the pneumococcal vaccine 84.0%
10% worse than Montana average

Montana average: 93.8%

Influenza Vaccine Info Percent of long-stay residents assessed and appropriately given the seasonal influenza vaccine 36.2%
61% worse than Montana average

Montana average: 93.7%

Short-stay resident measures
Pneumococcal Vaccine Info Percent of short-stay residents assessed and appropriately given the pneumococcal vaccine 61.7%
19% worse than Montana average

Montana average: 76.4%

Antipsychotic medication increase Info Percent of short-stay residents who newly received an antipsychotic medication 0.0%
100% better than Montana average

Montana average: 1.8%

Influenza Vaccine Info Percent of short-stay residents assessed and appropriately given the seasonal influenza vaccine 50.0%
32% worse than Montana average

Montana average: 73.8%

Breakdown by payment type

Medicare

51% of new residents, usually for short-term rehab.

Typical stay 28 days

Private pay

31% of new residents, often for short stays.

Typical stay 2 - 3 months

Medicaid

19% of new residents, often for long-term daily care.

Typical stay 9 - 10 months

Facility Characteristics

Source: CMS Long-Term Care Facility Characteristics (Data as of Jan 2026)

Total residents 63
Medicare
14
22.2% of residents
Medicaid
35
55.6% of residents
Private pay or other
14
22.2% of residents
Programs & Services
Residents Group

Residents meet regularly to discuss policies, care quality, and activities

Nurse Aide Training

State-approved Nurse Aide Training and Competency Evaluation Program on-site

Active Resident Council

Organized group of residents that meets regularly to discuss facility policies, quality of life, and activities.

Finances and operations

Privately-owned community
Home revenue
$10.1M
Operating loss
-$414.8K
Privately-owned community
Home revenue
$10.1M Rank #8 / 31Revenue — State benchmarkedThis home is ranked 8th out of 31 homes in Montana. Shows this facility's annual revenue compared to the Montana SNF average. Higher revenue generally means more resources for staffing and capital — read alongside Payroll %.Click the rank badge to see the full State ranking.Click here to see the full State ranking.
Operating loss
-$414.8K
Payroll costs Info The portion of the home's budget spent on staff, including nurses, caregivers, and other employees who support care and operations. Rank #5 / 31Payroll — State benchmarkedThis home is ranked 5th out of 31 homes in Montana. Shows total annual staff payroll benchmarked to the Montana average. Higher payroll investment relative to peers often signals better staffing and less reliance on cheaper contract labor.Click the rank badge to see the full State ranking.Click here to see the full State ranking.
$6.0M
59.7% of revenue Rank #14 / 31Payroll % — State benchmarkedThis home is ranked 14th out of 31 homes in Montana. Shows payroll as a percentage of revenue versus the Montana average. Well-run Montana SNFs typically land around 65–71% — the top third Statewide. Below 25% may signal understaffing or heavy agency use — read with Staffing ratings.Click the rank badge to see the full State ranking.Click here to see the full State ranking.
Other operating costs Info All remaining costs needed to run the home, such as food, utilities, building maintenance, supplies and administrative expenses.
$4.5M
Total costs $10.5M

What does this home offer?

Pets allowed icon
Pets allowed icon

Pets Allowed

Housing options icon

Housing Options: 1 Bed / 2 Bed

Building type icon
Building type icon

Building Type: Two-story

Transportation services icon

Transportation Services

Fitness and recreation icon

Fitness and Recreation

Who this home usually serves

TYPE OF STAY

Mostly short-term rehab stays

Most residents typically stay for a few weeks or months before returning home or moving on.

Places of interest near East Park Senior Apartments

Address 2.5 miles from city center Info Estimated distance in miles from Helena's city center to East Park Senior Apartments's address, calculated via Google Maps. — 0.1 miles to nearest hospital (Pure Infusions Suites of Helena)

Calculate Travel Distance to East Park Senior Apartments

Add your location

Address

Financial Assistance for
Nursing Home in Montana

East Park Senior Apartments is located in Helena, Montana.
Here are the financial assistance programs available to residents in Montana.

Get Financial aid guidance

Big Sky Waiver

Montana Medicaid Big Sky Waiver

Age 65+ or disabled
General Montana resident, Medicaid- eligible, nursing home-level care need.
Income Limits (2025) ~$2,829/month 300% FBR, individual
Asset Limits $2,000 (individual), $3,000 (couple).
MT

Rural state; limited providers in some areas.

Benefits
Personal care (5-7 hours/day) Respite (240 hours/year) Home modifications ($1,500 avg.) Meals ($6/meal)

Montana Community First Choice

MT CFC

Age 65+ or disabled
General Montana resident, Medicaid- eligible.
Income Limits ~$1,732/month individual, Medicaid threshold
Asset Limits $2,000 individual
MT

Less intensive than waiver; rural focus.

Benefits
Personal care (up to 40 hours/month) Homemaker services Respite (varies)

Big Sky Rx

Montana Big Sky Rx

Age 65+ or disabled
General Montana resident, enrolled in Medicare Part D, income below limit.
Income Limits (2025) ~$2,510/month (individual), ~$3,380/month (couple).
Asset Limits Not assessed.
MT

Covers up to $38.75/month premium; statewide via AAAs.

Benefits
Prescription drug premium assistance (~$465/year) Reducing out-of-pocket costs

Medicare Savings Program (MSP)

Montana Medicare Savings Program

Age 65+ or disabled
General Montana resident, Medicare Part A/B.
Income Limits (2025) ~$2,510/month (QMB), ~$3,380/month (SLMB), ~$3,598/month (QI)—individual.
Asset Limits $9,430 (individual), $14,130 (couple).
MT

Three tiers; no waitlist; includes Extra Help for Part D.

Benefits
Covers Part B premiums ($174.70/month) Deductibles ($240/year) Copays (~20%)

Montana Caregiver Support Program (via NFCSP)

Montana Caregiver Support Program

Age
General Caregivers of 60+ needing care or 55+ caregivers of others; Montana resident; functional needs (2+ ADLs).
Income Limits (2025) Prioritizes ~$24,980/year (individual); no strict cap.
Asset Limits Not assessed; need-based.
MT

10 AAAs; prioritizes low-income, rural caregivers.

Benefits
Respite (4-6 hours/week or 5 days/year) Adult day care ($50/day) Training Supplies (~$500/year)

VA Aid and Attendance (A&A) and Housebound Benefits

Montana VA Aid and Attendance/Housebound

Age 65+ or disabled veteran/spouse
General Montana resident, wartime service, need for ADL help (A&A) or homebound.
Income Limits (2025) Net income < ~$1,984/month (veteran with dependent, A&A); pension offsets income.
Asset Limits ~$155,356 net worth limit
MT

High veteran demand in rural areas.

Benefits
Cash (~$1,433-$2,642/month veteran, ~$951-$1,318 spouse) for care costs (e.g., in-home, assisted living)

Frequently Asked Questions about East Park Senior Apartments

What neighborhood is East Park Senior Apartments in?

East Park Senior Apartments is in the Capitol Hill neighborhood.

Is East Park Senior Apartments in a walkable area?

East Park Senior Apartments has a walk score of 37. Somewhat walkable. A few nearby services may be reachable on foot, but most trips require transportation.

Are there photos of East Park Senior Apartments?

Yes — there are 4 photos of East Park Senior Apartments in the photo gallery on this page.

What is the phone number of East Park Senior Apartments?

(406) 449-9795 will put you in contact with the team at East Park Senior Apartments.

Is East Park Senior Apartments Medicare or Medicaid certified?

Yes — East Park Senior Apartments is a CMS-certified provider of Medicare and Medicaid.

Guides for Better Senior Living

Care Cost Calculator: See Prices in Your Area

Nursing Home Data Explorer

Don’t Wait Too Long: 7 Red Flag Signs Your Parent Needs Assisted Living Now

The True Cost of Assisted Living in 2025 – And How Families Are Paying For It

Understanding Senior Living Costs: Pricing Models, Discounts & Financial Assistance

Explore Open Rooms
1 Contact details
2 What type of senior care service are you looking for?
3 What budget do you have in mind for senior care?
4 How soon do you need to find care?
5 Additional details

Thank you for your interest!

Our team will be in touch shortly to help with next steps.