• Home
  • Nursing Home in Florida
Woodmark at Daytona Beach
Nursing Home & Independent Living · Daytona Beach, FL
CMS overall rating Info CMS (the Centers for Medicare & Medicaid Services) is the federal agency that rates nursing home quality. Its Overall Rating runs from 1 to 5 stars, combining health inspections, staffing, and quality measures, with inspections weighted most heavily.

Woodmark at Daytona Beach

Nursing Home & Independent Living · Daytona Beach, FL
CMS overall rating Info CMS (the Centers for Medicare & Medicaid Services) is the federal agency that rates nursing home quality. Its Overall Rating runs from 1 to 5 stars, combining health inspections, staffing, and quality measures, with inspections weighted most heavily.
Calculator: See prices in your area
Woodmark at Daytona Beach accepts Medicare, Medicaid, and private pay.

Overview of Woodmark at Daytona Beach

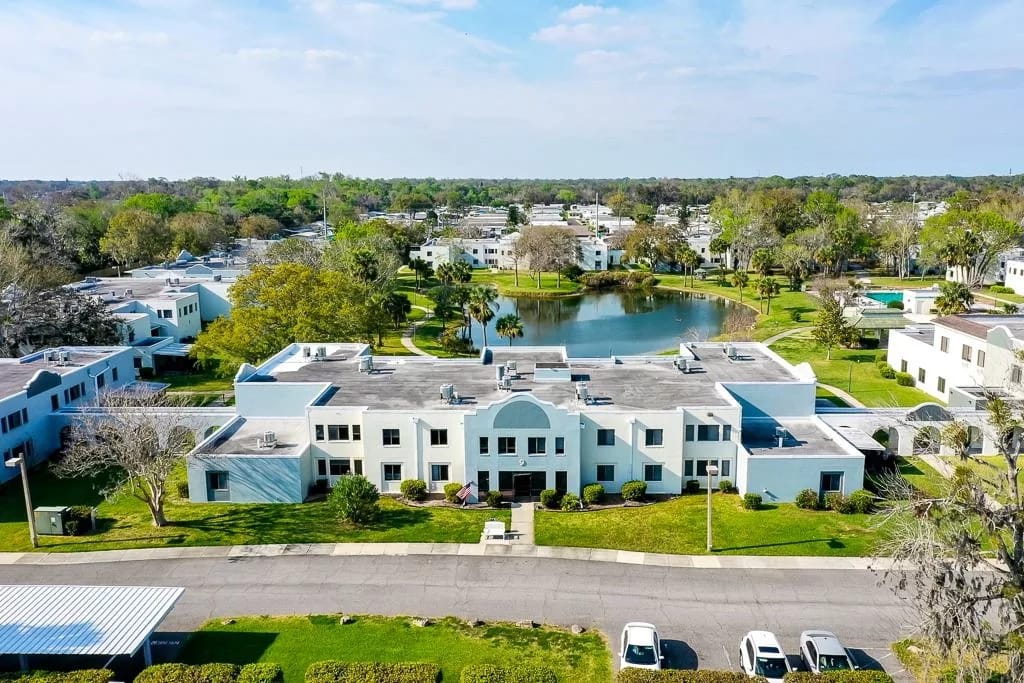
Set in in Daytona Beach, The Woodmark offers residents not just a place to live, but a haven of stunning views and unparalleled service. Here, discerning seniors can indulge in a variety of lifestyle options, including assisted living, independent living, and respite care, all delivered with the utmost care and professionalism by a friendly and dedicated staff.

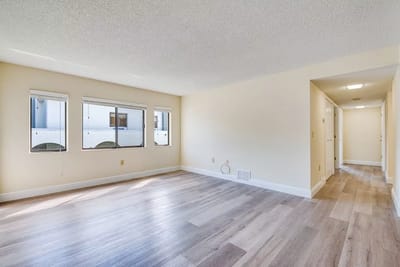
Impeccably maintained cozy rooms, each with a private bathroom, lead to inviting patios or balconies, creating the perfect retreat. Residents can unwind effortlessly, taking advantage of the community’s enticing amenities such as the serene patio, a haven for relaxation, and a well-stocked library offering endless literary adventures. The convenience of on-site parking for both residents and guests, coupled with Wi-Fi in common areas, ensures seamless connectivity. In case of any need, an emergency alert system in the form of pendants or wristbands adds an extra layer of security, offering peace of mind to residents and their families alike.

Quality ratings

Measured by Centers for Medicare & Medicaid Services (CMS)

Overall rating Info The Overall CMS Rating combines results from health inspections, staffing levels and quality measures. Health inspections carry the most weight. Staffing and quality scores can increase or decrease the final rating based on performance compared to state and national standards.
Health Inspection Info Based on the results of the facility's three most recent standard inspections and any complaint investigations. CMS reviews the number, scope, and severity of deficiencies, with more recent findings weighted more heavily.
Staffing Info Measures average nursing staff hours per resident per day, including Registered Nurses (RNs) and total nursing staff. Ratings are adjusted based on the level of care residents require and are compared to state and national benchmarks.
Quality Measures Info Based on clinical and physical health indicators reported to CMS, such as hospital readmissions, falls, pressure ulcers, and improvements in mobility. These measures reflect how well residents' health needs are being managed.

Staffing hours breakdown

Info Daily nursing hours per resident by staff type, reported to CMS. Higher is generally better — compare this facility to state and national averages to see where staffing stands.

Hours per resident per day — compared to state averages

Total nursing care / resident Info Total adjusted nursing hours per resident per day, combining RN, LPN, and aide time. CMS adjusts this for case-mix so facilities can be fairly compared.
3h 48m per day
Rank #145 / 253Nurse hours — State benchmarkedThis home is ranked 145th out of 253 homes in Florida. Shows adjusted nurse hours per resident per day benchmarked to the Florida average, with a ranking across 253 Florida facilities. More hours mean more direct care. The national average is about 3.5 hrs; below 3.0 is a red flag.Rankings are based only on facilities in Florida that report data for that category. Facilities without available data are excluded from the ranking.Click the rank badge to see the full State ranking.Click here to see the full State ranking.
vs avg
Staff typeHours / Day / Residentvs state avg
Weekend Total Nursing Info Combined nursing hours (RN + LPN + Nurse Aide) per resident per day on weekends. Staffing often drops on weekends — this figure reveals whether the facility maintains adequate coverage outside of weekday hours. 3h 26m per day

Capacity and availability

This home usually has availability

Lower occupancy than the state average
Occupancy rate
66.7% Rank #235 / 258Occupancy rate — State benchmarkedThis home is ranked 235th out of 258 homes in Florida. Shows this facility's occupancy rate versus the Florida average, with its Statewide rank out of 258. Higher occupancy signals strong local demand and financial stability.Rankings are based only on facilities in Florida that report data for that category. Facilities without available data are excluded from the ranking.Click the rank badge to see the full State ranking.Click here to see the full State ranking.
Avg. Length of Stay
94 days
Bed community size
60-bed community Rank #695 / 1074Bed count — State benchmarkedThis home is ranked 695th out of 1074 homes in Florida. Shows this facility's certified or reported bed count compared to other Florida facilities. Larger communities may offer more amenities, programs, and on-site services for residents and families.Rankings are based only on facilities in Florida that report data for that category. Facilities without available data are excluded from the ranking.Click the rank badge to see the full State ranking.Click here to see the full State ranking.
A moderately sized community that may balance personal attention with shared amenities and social activities.
Walk Score
Walk Score: 55 / 100 Rank #426 / 1486Walk Score — State benchmarkedThis home is ranked 426th out of 1486 homes in Florida. Shows how walkable this facility's neighborhood is compared to the average Walk Score across Florida facilities. Higher scores benefit residents, families, and staff.Rankings are based only on facilities in Florida that report data for that category. Facilities without available data are excluded from the ranking.Click the rank badge to see the full State ranking.Click here to see the full State ranking.
Moderately walkable. Some errands can be accomplished on foot, with a mix of nearby amenities.

Contact Woodmark at Daytona Beach

Staffing Data

Reporting period: October 1 – December 31, 2025 (Q4 2025). Source: CMS Payroll-Based Journal report.

Total staff 116
Employees 53
Contractors 63
Staff to resident ratio 2.52 : 1
0% compared with State average

State average ratio: 0 : 0

Avg staff/day 30
Average shift 7.7 hours
0% compared with State average

State average: 0 hours

Total staff hours (quarter) 21,264

Nursing staff breakdown

Q4 2025 · Oct 1 – Dec 31 More info This data comes from the CMS Payroll-Based Journal report covering October 1 – December 31, 2025.
Registered Nurse

Manages medical care and health needs.

RN Staff Info 18 total: 8 full-time employees and 10 contractors. 18
Average shift length Info Average shift length. Calculated as total hours divided by days worked and average staff per day. 9.3 hours
Licensed Practical Nurse

Assists with medical care and medications.

LPN Staff Info 27 total: 11 full-time employees and 16 contractors. 27
Average shift length Info Average shift length. Calculated as total hours divided by days worked and average staff per day. 9.6 hours
Certified Nursing Assistant

Helps with daily care and mobility.

CNA Staff Info 53 total: 26 full-time employees and 27 contractors. 53
Average shift length Info Average shift length. Calculated as total hours divided by days worked and average staff per day. 7.7 hours

Contractor staffing

Q4 2025 · Oct 1 – Dec 31 More info This data comes from the CMS Payroll-Based Journal report covering October 1 – December 31, 2025.

Total hours from contractors

13.7%

2,905 contractor hours this quarter

Certified Nursing Assistant: 27 Licensed Practical Nurse: 16 Registered Nurse: 10 Speech Language Pathologist: 3 Physical Therapy Aide: 2 Physical Therapy Assistant: 2 Qualified Social Worker: 2 Respiratory Therapy Technician: 1

Staff by category

Q4 2025 · Oct 1 – Dec 31 More info This data comes from the CMS Payroll-Based Journal report covering October 1 – December 31, 2025.
Certified Nursing Assistant26275310,42892100%7.7
Licensed Practical Nurse1116273,85992100%9.6
Registered Nurse810182,42492100%9.3
RN Director of Nursing2029846470%8
Other Dietary Services Staff2025436874%7.9
Administrator1015126470%8
Nurse Practitioner1015126470%8
Dietitian1015126470%8
Mental Health Service Worker1014725964%8
Speech Language Pathologist0333576773%4.9
Physical Therapy Aide0223516874%5.2
Qualified Social Worker0222294246%5.4
Physical Therapy Assistant022423336%1.1
Respiratory Therapy Technician011403942%1
53 Certified Nursing Assistant
% of Days 100%
27 Licensed Practical Nurse
% of Days 100%
18 Registered Nurse
% of Days 100%
2 RN Director of Nursing
% of Days 70%
2 Other Dietary Services Staff
% of Days 74%
1 Administrator
% of Days 70%
1 Nurse Practitioner
% of Days 70%
1 Dietitian
% of Days 70%
1 Mental Health Service Worker
% of Days 64%
3 Speech Language Pathologist
% of Days 73%
2 Physical Therapy Aide
% of Days 74%
2 Qualified Social Worker
% of Days 46%
2 Physical Therapy Assistant
% of Days 36%
1 Respiratory Therapy Technician
% of Days 42%

Penalties and fines

Includes penalties issued in 2024

Federal penalties imposed by CMS for regulatory violations, including civil money penalties (fines) and denials of payment for new Medicare/Medicaid admissions.

Source: CMS Penalties Database (Data as of Jan 2026)

Total fines amount $9K Rank #171 / 258Federal fines — State benchmarkedThis home is ranked 171st out of 258 homes in Florida. Shows this facility's cumulative CMS federal fine dollars versus the Florida average among facilities with fines, and where it ranks among 258 facilities in the pool. Lower total dollars mean a better rank.Rankings are based only on facilities in Florida that report data for that category. Facilities without available data are excluded from the ranking.Click the rank badge to see the full State ranking.Click here to see the full State ranking.
88% lower than State average

State average: $72K

Number of fines 1
62% fewer fines than State average

State average: 2.6

Payment Denials Info Serious action where Medicare and/or Medicaid temporarily stops payments for new residents until issues are fixed. 0
100% fewer payment denials than State average

State average: 0.1

Fines amount comparison
This facility $9K
State average $72K
Penalty History

Penalties are imposed by CMS for violations of federal nursing home regulations.

1 penalty in the past 3 years

Oct 17, 2024 · $9K

Civil Money Penalty Info Fines imposed for noncompliance, which can be assessed per day or per instance of violation. Oct 17, 2024
$9K

Last updated: Jan 2026

Quality of care over time

These measures show how residents usually do over time at this home, based on health outcomes and preventive care.

High-risk clinical events score Info A composite score based on pressure ulcers, falls with injury, weight loss, walking ability decline, and activities of daily living decline. 9.2
24% worse than State average

State average: 7.4

Functional decline score Info A composite score based on activities of daily living decline, walking ability decline, and incontinence. 18.0
45% worse than State average

State average: 12.4

Long-stay resident measures
Need for Help with Daily Activities Increased Info Percent of long-stay residents whose need for help with daily activities has increased 12.8%
21% worse than State average

State average: 10.5%

Walking Ability Worsened Info Percent of long-stay residents whose ability to move independently worsened 12.0%
8% better than State average

State average: 12.9%

Low Risk Residents with Bowel/Bladder Incontinence Info Percent of low risk long-stay residents who lose control of their bowels or bladder 29.4%
117% worse than State average

State average: 13.5%

Falls with Major Injury Info Percent of long-stay residents experiencing one or more falls with major injury 1.8%
30% better than State average

State average: 2.6%

High Risk Residents with Pressure Ulcers Info Percent of long-stay high risk residents with pressure ulcers 8.5%
59% worse than State average

State average: 5.4%

Urinary Tract Infection Info Percent of long-stay residents with a urinary tract infection 0.7%
26% better than State average

State average: 0.9%

Lost Too Much Weight Info Percent of long-stay residents who lose too much weight 10.8%
81% worse than State average

State average: 6.0%

Depressive Symptoms Info Percent of long-stay residents who have depressive symptoms 45.0%
1245% worse than State average

State average: 3.3%

Antipsychotic Use Info Percent of long-stay residents who received an antipsychotic medication 8.6%
7% worse than State average

State average: 8.0%

Pneumococcal Vaccine Info Percent of long-stay residents assessed and appropriately given the pneumococcal vaccine 100.0%
In line with State average

State average: 97.7%

Influenza Vaccine Info Percent of long-stay residents assessed and appropriately given the seasonal influenza vaccine 100.0%
In line with State average

State average: 99.2%

Short-stay resident measures
Pneumococcal Vaccine Info Percent of short-stay residents assessed and appropriately given the pneumococcal vaccine 100.0%
6% better than State average

State average: 94.0%

Antipsychotic medication increase Info Percent of short-stay residents who newly received an antipsychotic medication 0.0%
100% better than State average

State average: 1.5%

Influenza Vaccine Info Percent of short-stay residents assessed and appropriately given the seasonal influenza vaccine 98.6%
In line with State average

State average: 94.7%

Breakdown by payment type

Medicare

54% of new residents, usually for short-term rehab.

Typical stay 1 - 2 months

Private pay

35% of new residents, often for short stays.

Typical stay 2 - 3 months

Medicaid

11% of new residents, often for long-term daily care.

Typical stay 1 - 2 years

Facility Characteristics

Source: CMS Long-Term Care Facility Characteristics (Data as of Jan 2026)

Total residents 46
Medicare
6
13% of residents
Medicaid
17
37% of residents
Private pay or other
23
50% of residents
Programs & Services
Residents Group

Residents meet regularly to discuss policies, care quality, and activities

Family Member Group

Family members meet regularly to discuss policies, care quality, and activities

Active Family Council

Organized group of family members that meets regularly to discuss facility policies, resident care, and activities.

Active Resident Council

Organized group of residents that meets regularly to discuss facility policies, quality of life, and activities.

Finances and operations

Based on CMS SNF Cost Report for fiscal year ending in 12/2023.

For-profit
Operated by a single business entity.
Net patient revenue Info Net patient revenue — what the home actually collects for resident care, after contractual allowances, bad debt and discounts are subtracted from its gross charges (CMS cost report, Worksheet G-3). It covers resident care only; money the home earns from other sources is shown separately as "Other income."
$5.5M
Net patient income Info Net patient income: net patient revenue minus the home's total operating expenses. A positive figure means it earns more from resident care than it spends to deliver it; a negative figure means the opposite. It excludes non-operating "other income."
-$216.1K
For-profit Operated by a single business entity.
Net patient revenue Info Net patient revenue — what the home actually collects for resident care, after contractual allowances, bad debt and discounts are subtracted from its gross charges (CMS cost report, Worksheet G-3). It covers resident care only; money the home earns from other sources is shown separately as "Other income."
$5.5M Rank #250 / 257Revenue — State benchmarkedThis home is ranked 250th out of 257 homes in Florida. Shows this facility's annual revenue compared to the Florida average. Higher revenue generally means more resources for staffing and capital — read alongside Payroll %.Rankings are based only on facilities in Florida that report data for that category. Facilities without available data are excluded from the ranking.Click the rank badge to see the full State ranking.Click here to see the full State ranking.
Net patient income Info Net patient income: net patient revenue minus the home's total operating expenses. A positive figure means it earns more from resident care than it spends to deliver it; a negative figure means the opposite. It excludes non-operating "other income."
-$216.1K
Other income Info Money the home earns outside of resident care — such as investments, grants, rentals and other non-operating sources (CMS cost report, Worksheet G-3). It is tracked separately from net patient revenue: it is not part of that figure, and it is not included in net patient income.
$497
Payroll costs Info Staff salaries plus wage-related costs — benefits such as payroll taxes, health insurance and retirement — from the home's own accounting records (CMS cost report, Worksheet A). Contract or agency labor is counted separately, under other operating costs. Rank #235 / 257Payroll — State benchmarkedThis home is ranked 235th out of 257 homes in Florida. Shows total annual staff payroll benchmarked to the Florida average. Higher payroll investment relative to peers often signals better staffing and less reliance on cheaper contract labor.Rankings are based only on facilities in Florida that report data for that category. Facilities without available data are excluded from the ranking.Click the rank badge to see the full State ranking.Click here to see the full State ranking.
$2.7M 49.8% of net patient revenue Info Payroll as a share of revenue: staff salaries and wage-related benefits divided by net patient revenue. A higher figure means more of each revenue dollar goes to staff pay. Rank #7 / 257Payroll % — State benchmarkedThis home is ranked 7th out of 257 homes in Florida. Shows payroll as a percentage of revenue versus the Florida average. Well-run Florida facilities typically land around 49–56% — the top third Statewide. Below 25% may signal understaffing or heavy agency use — read with Staffing ratings.Rankings are based only on facilities in Florida that report data for that category. Facilities without available data are excluded from the ranking.Click the rank badge to see the full State ranking.Click here to see the full State ranking.
Other operating costs Info Everything it costs to run the home apart from payroll — food, utilities, supplies, maintenance, contract labor and administration. Calculated as total operating expense minus payroll (staff salaries and wage-related benefits).
$3.0M
Total costs Info The home's total operating expense for the year — all the costs of running it, salaries included (CMS cost report, Worksheet G-3).
$5.7M

What does this home offer?

Pets allowed icon
Pets allowed icon

Pets Allowed

Housing options icon

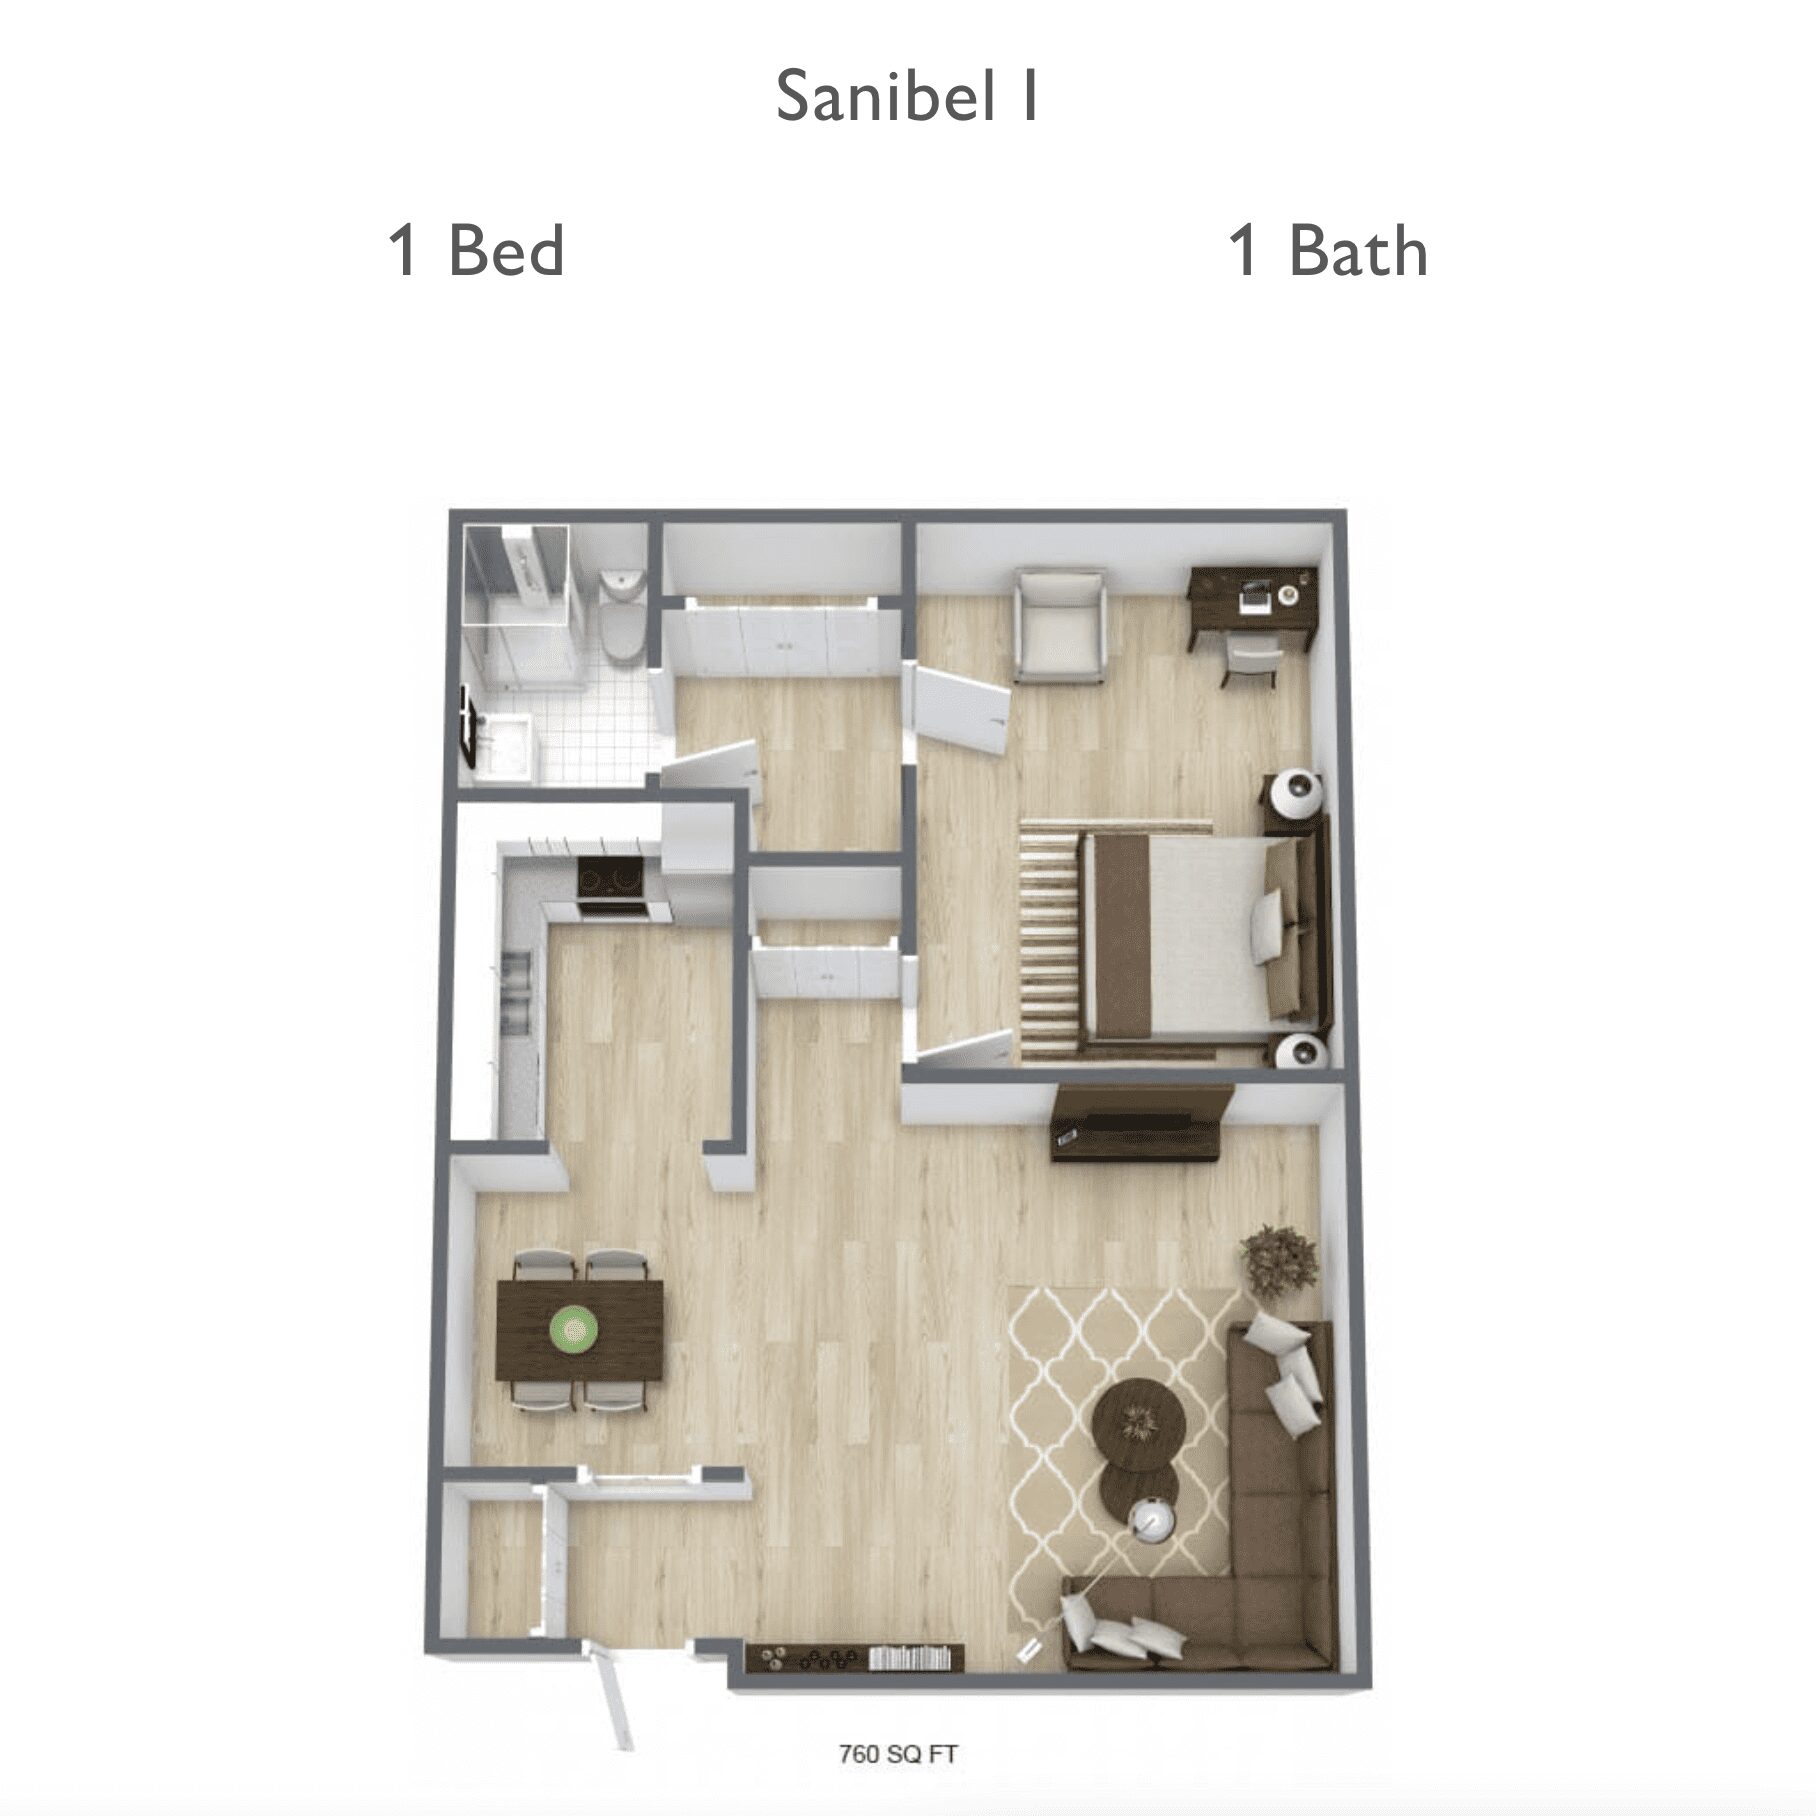
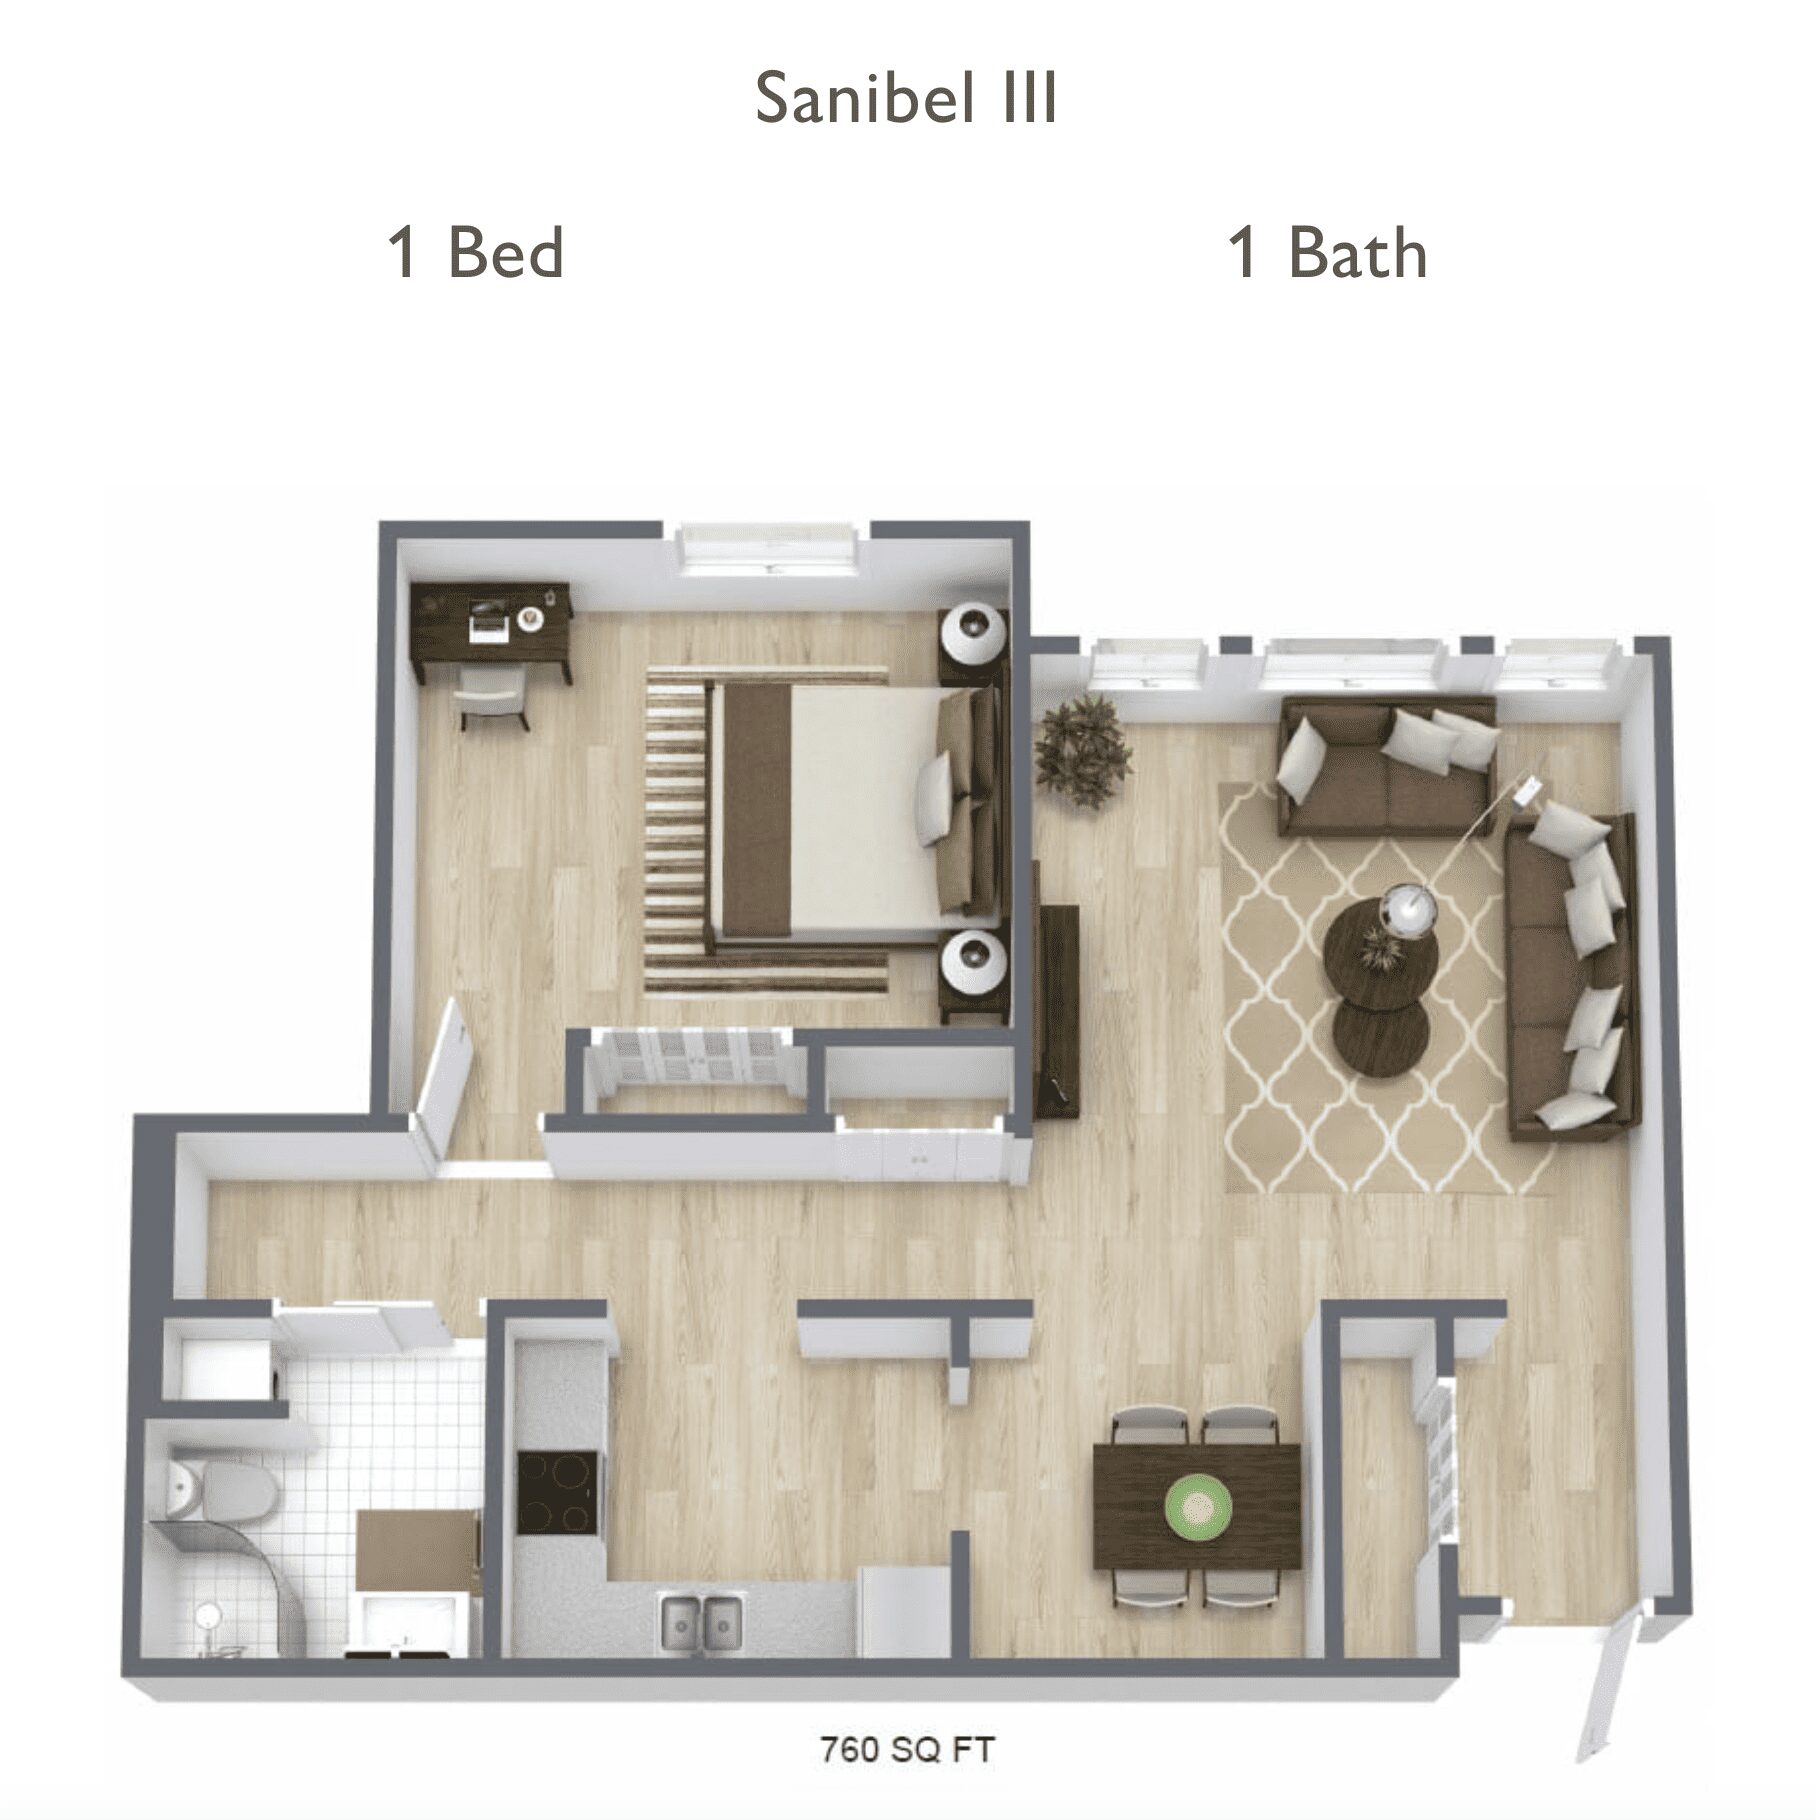
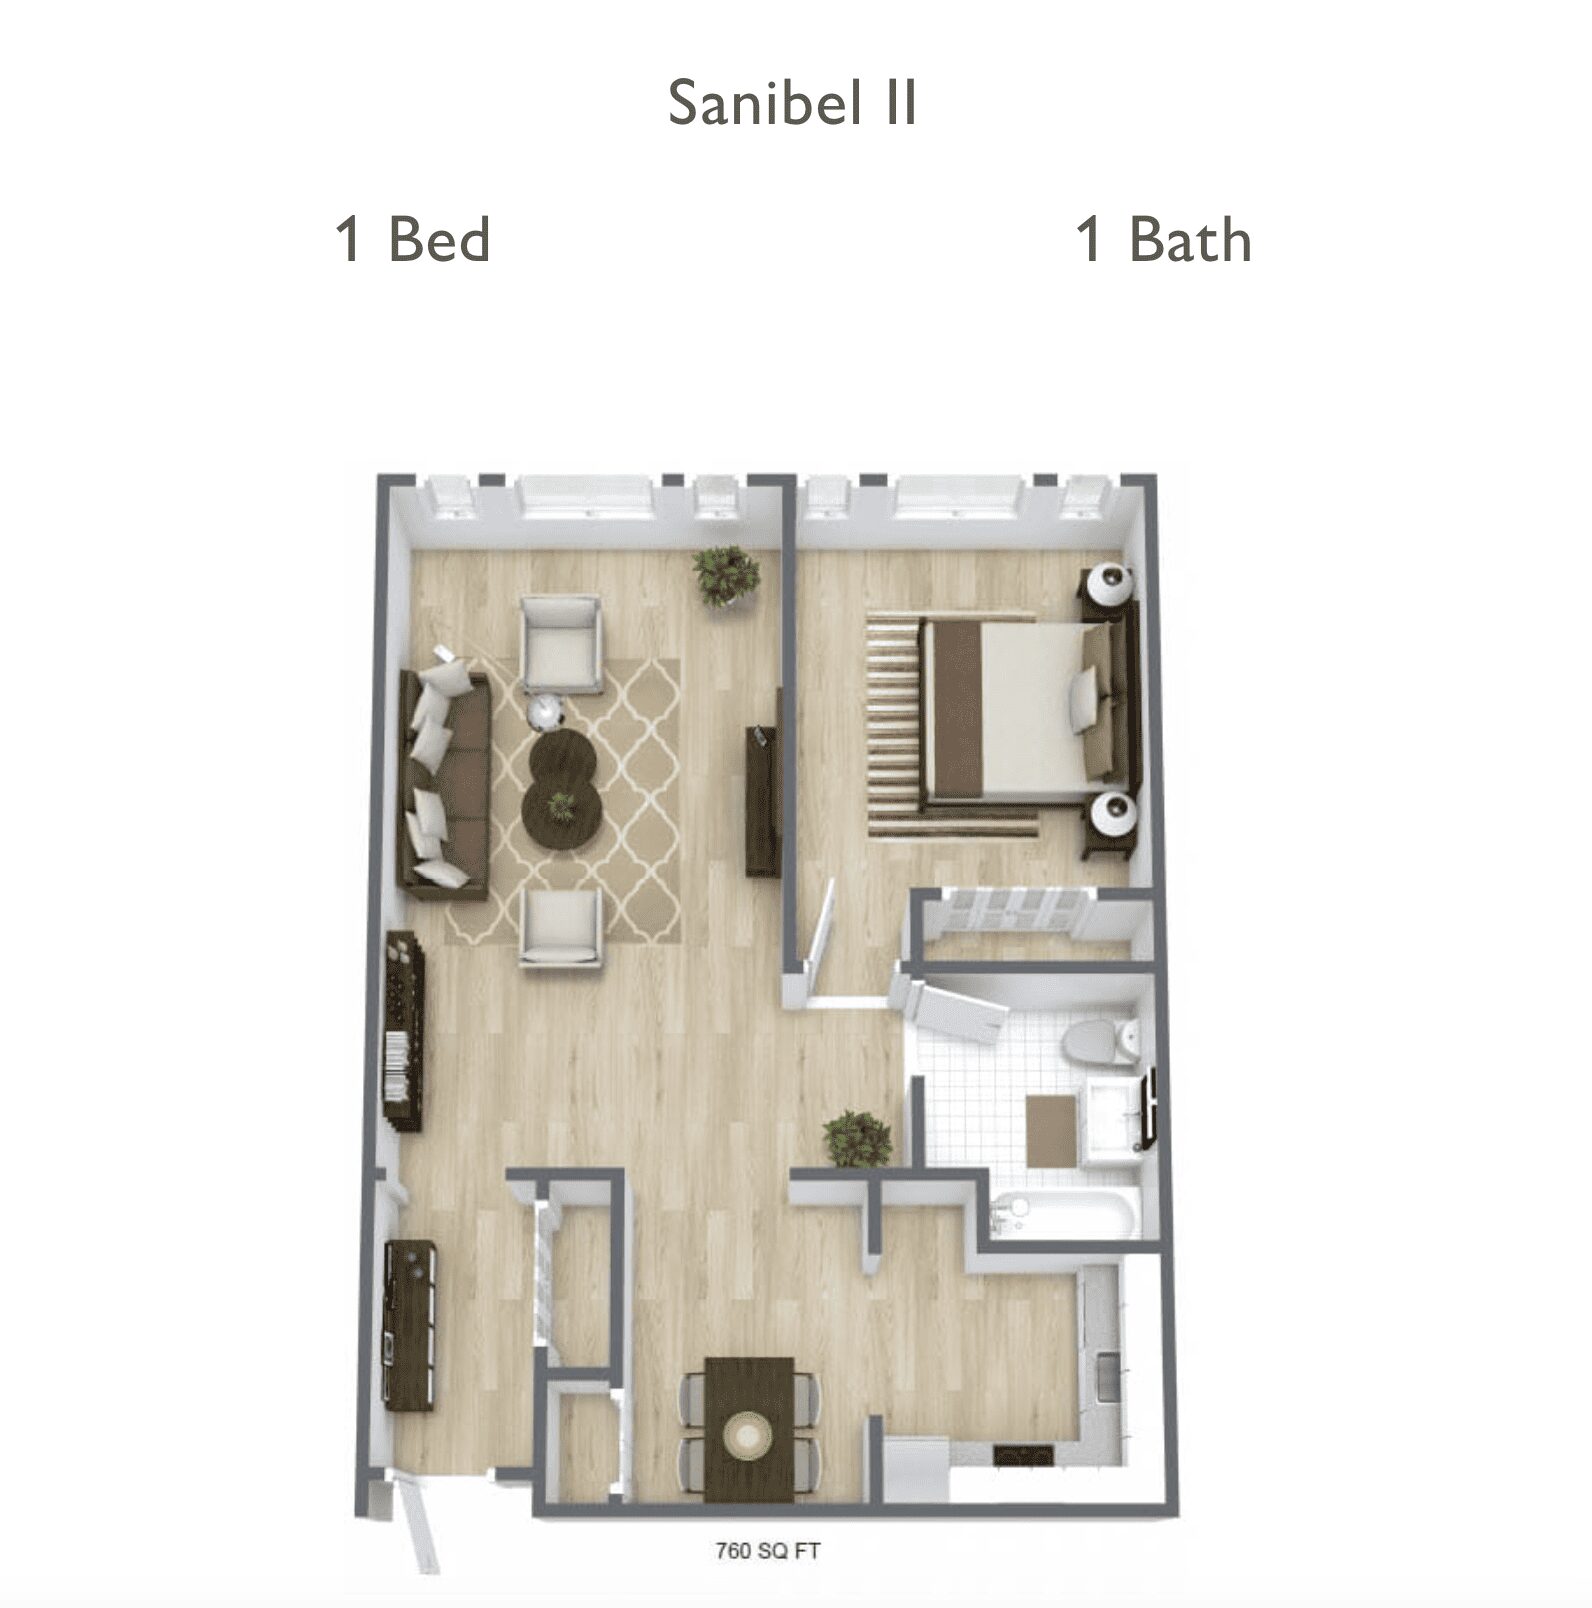
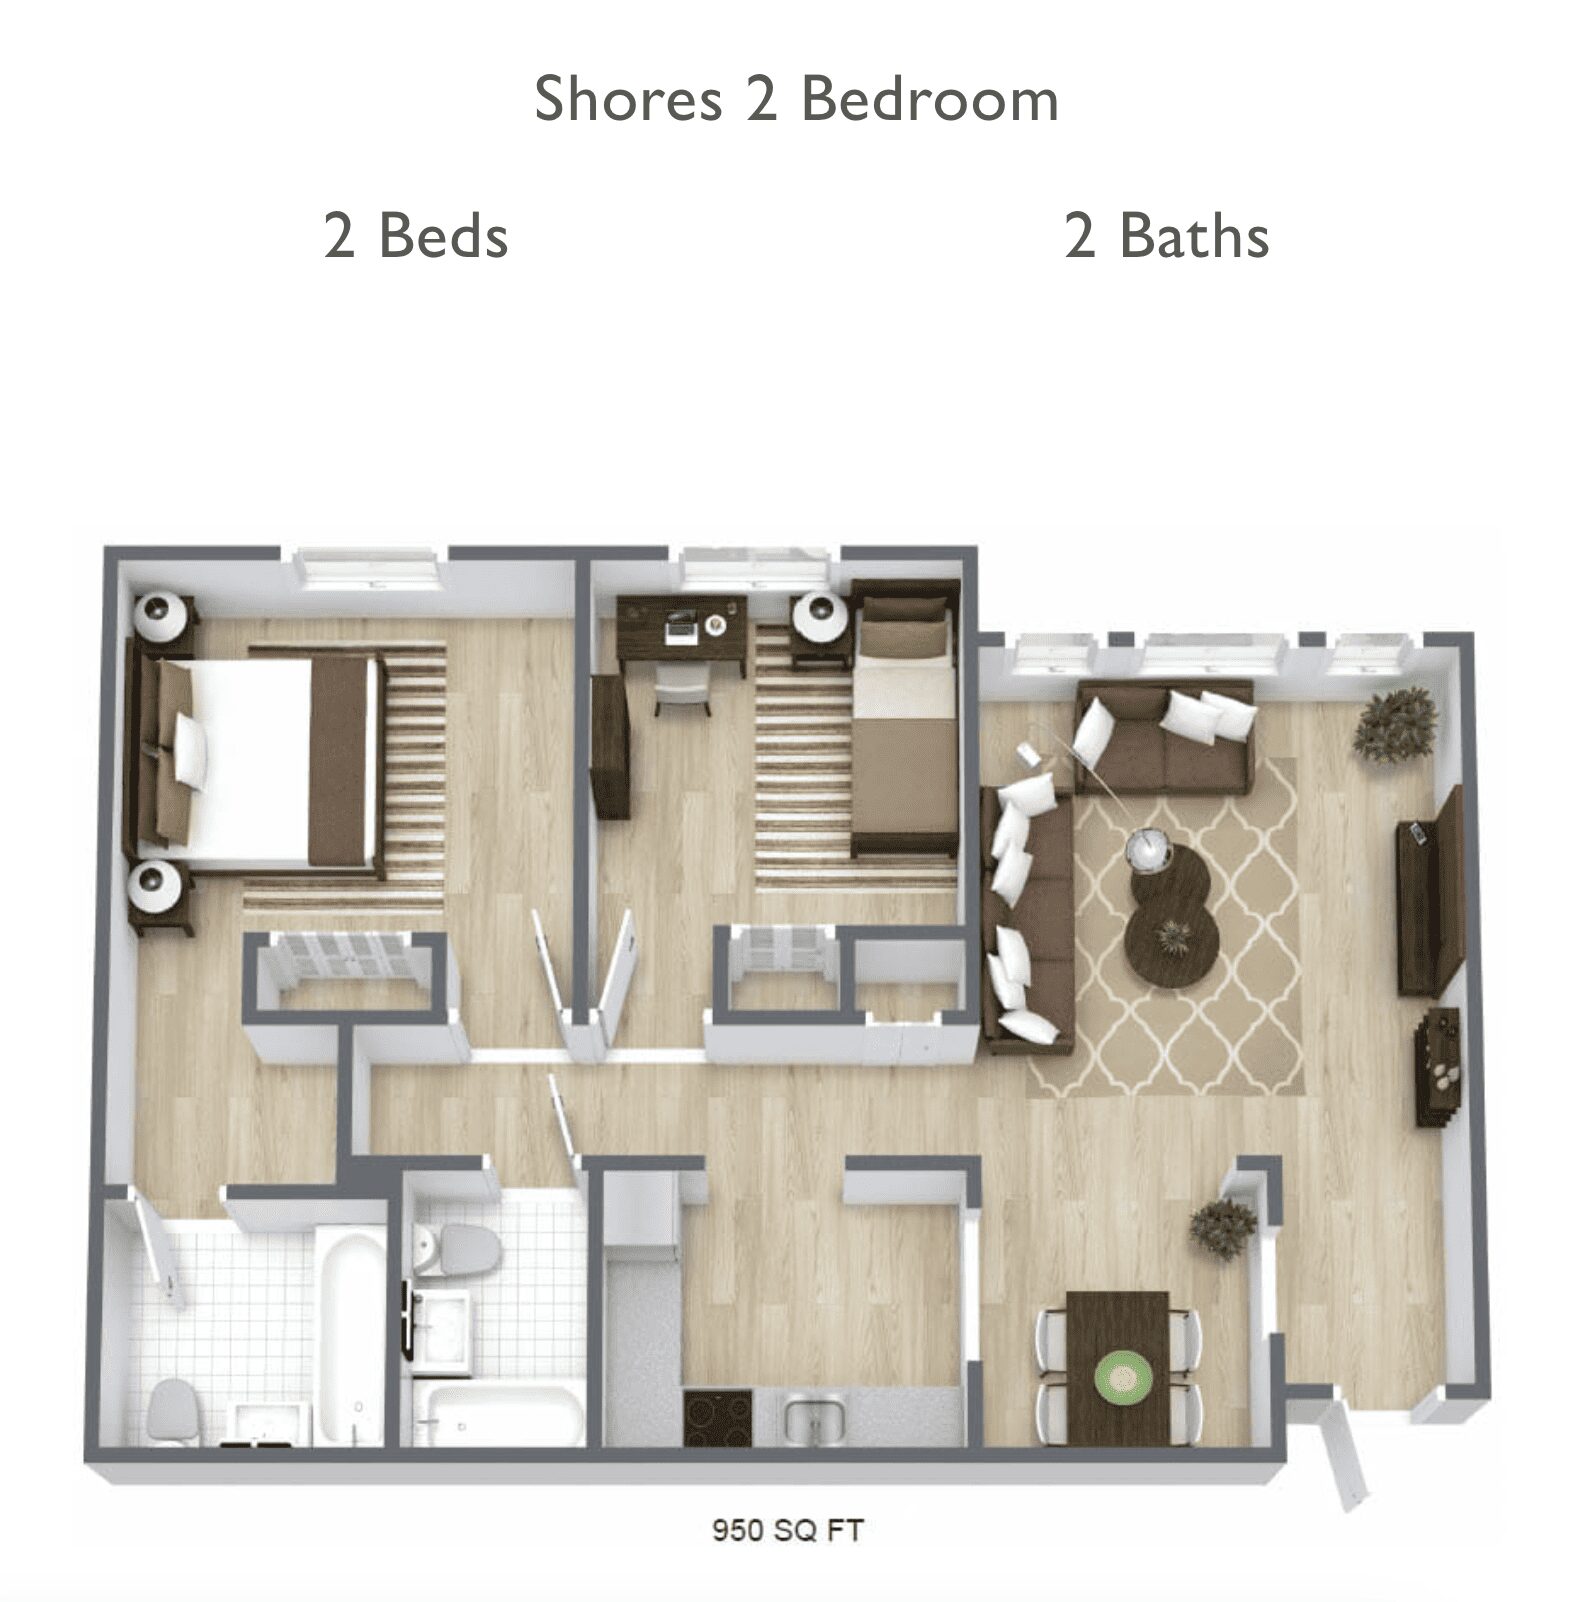
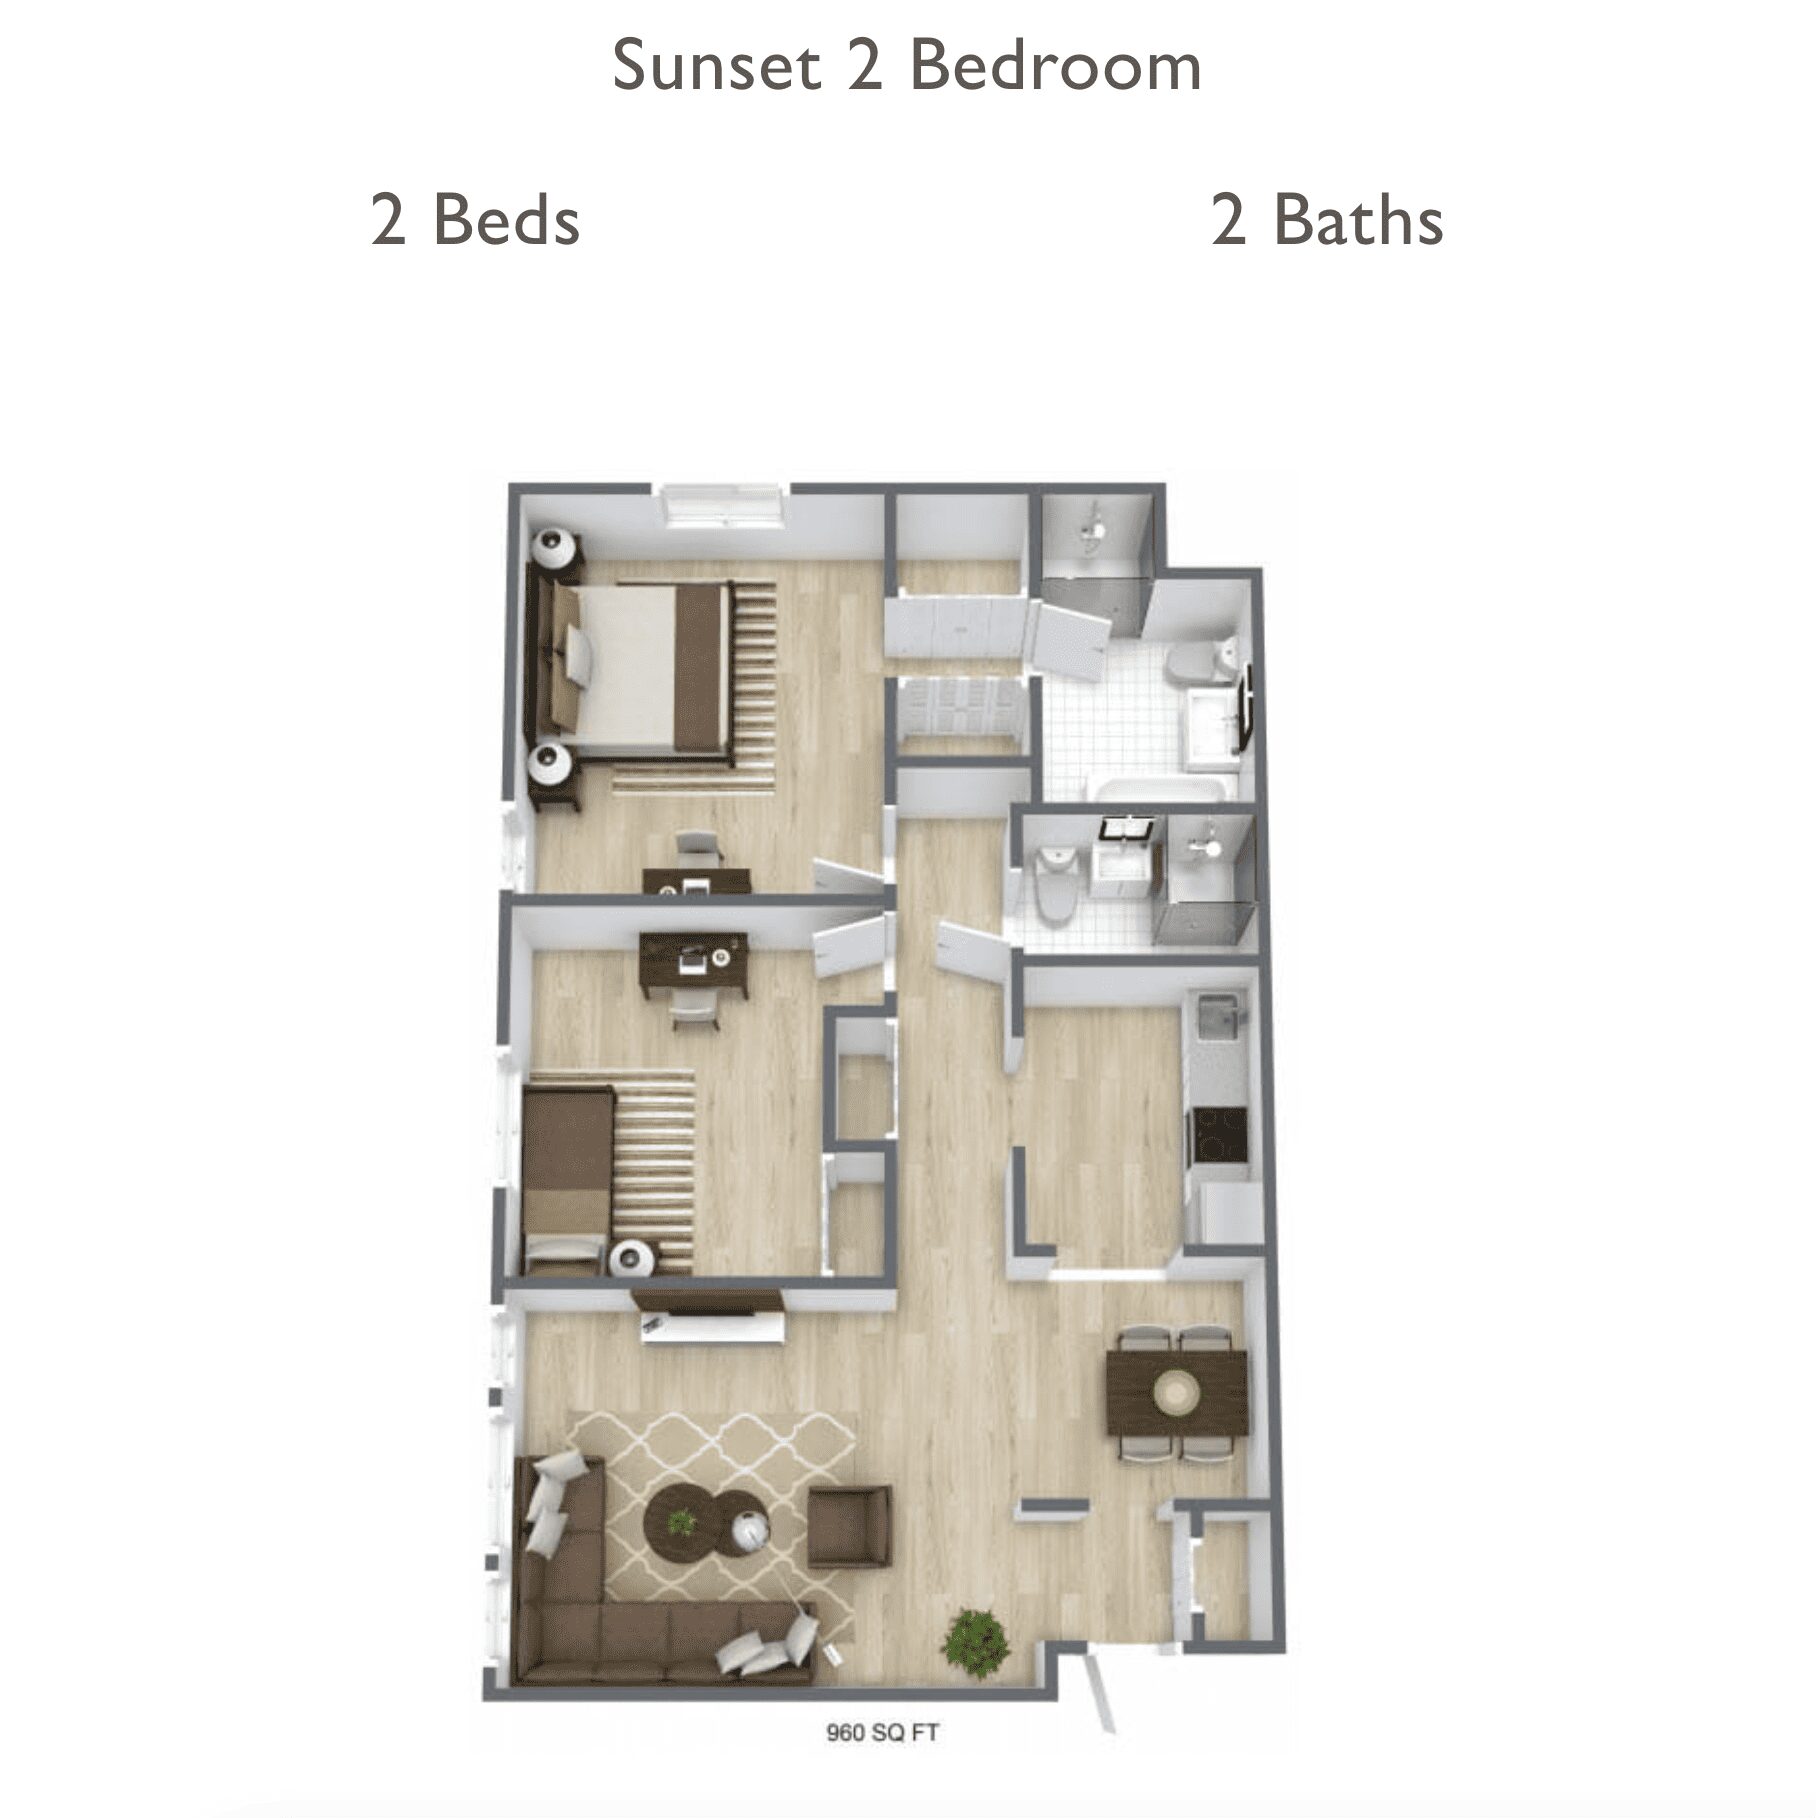
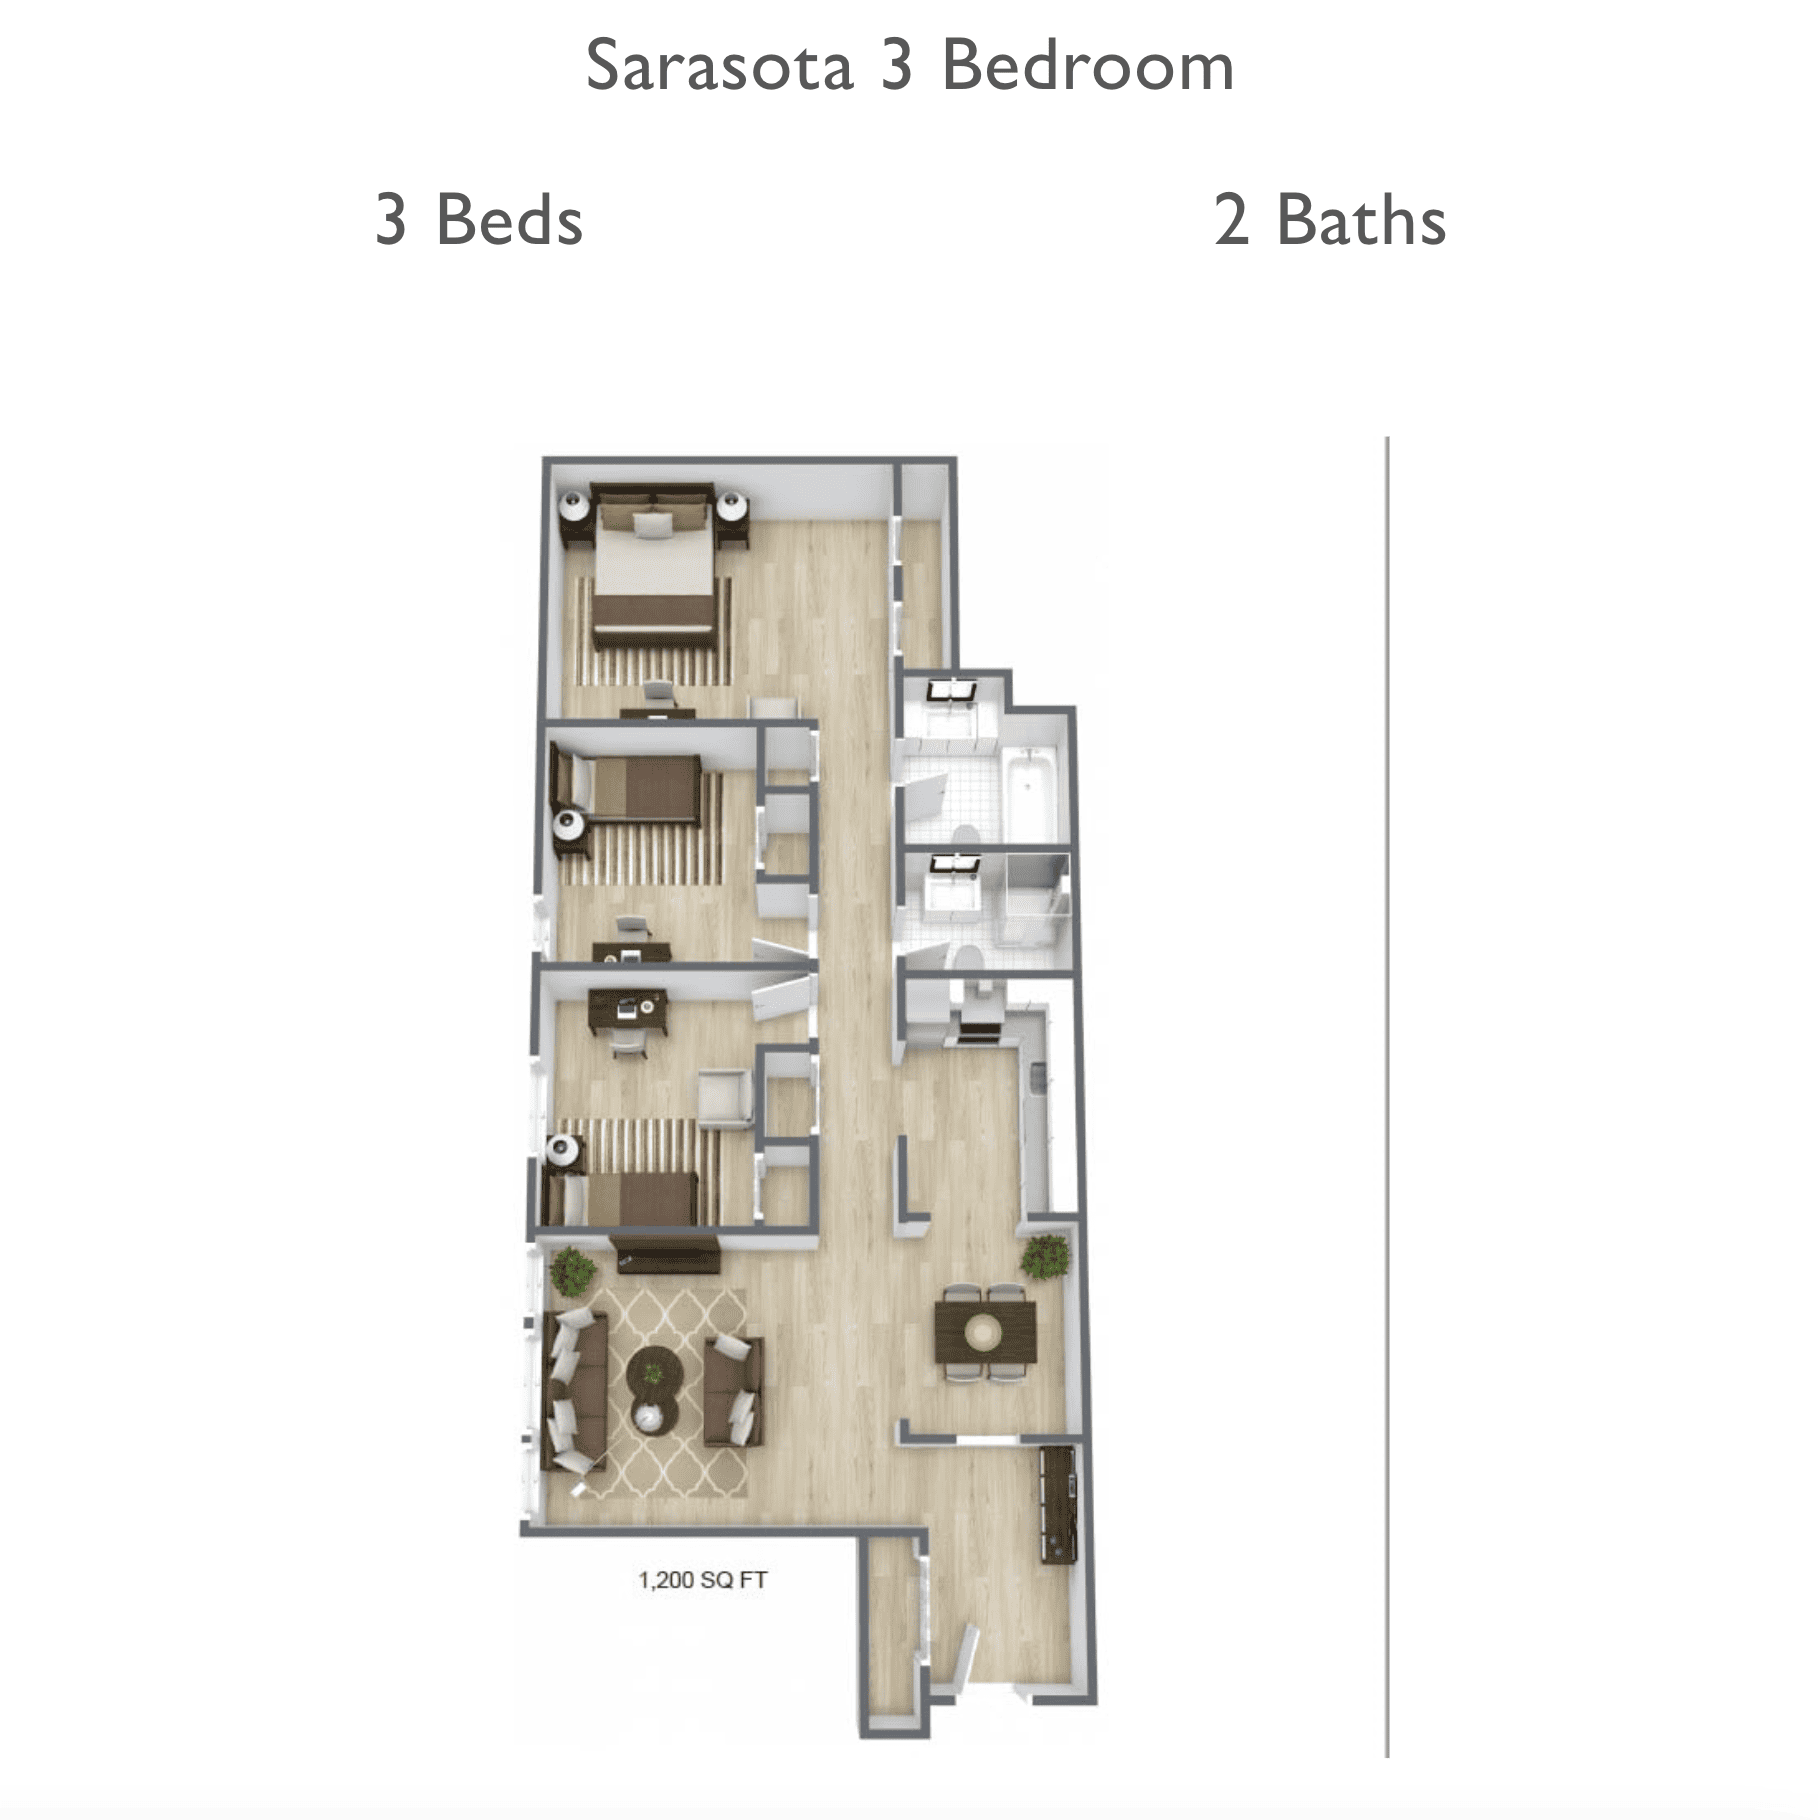
Housing Options: 1 Bed / 2 Bed / 3 Bed

Building type icon
Building type icon

Building Type: Two-storey

Transportation services icon

Transportation Services

Fitness and recreation icon

Fitness and Recreation

Who this home usually serves

TYPE OF STAY

Mostly short-term rehab stays

Most residents typically stay for a few weeks or months before returning home or moving on.

Most new residents arrive under Medicare (54% of admissions), and a typical Medicare stay runs around 1 - 2 months.

Admissions
126 total

Coverage residents most often arrive under.

Medicare 54%
Private pay 35%
Medicaid 11%
Discharges
155 total

Coverage residents most often leave under.
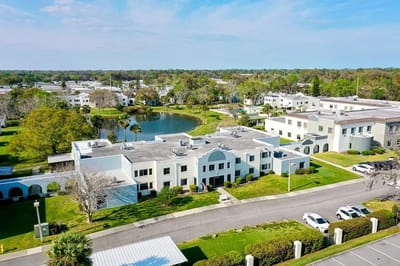
Medicare 49%
Private pay 47%
Medicaid 4%

Living Spaces & Floor Plans for Woodmark at Daytona Beach

1 Bedroom
1 Bedroom
1 Bedroom
2 bedroom
2 bedroom
3 bedroom

Places of interest near Woodmark at Daytona Beach

Address 4.0 miles from city center Info Estimated distance in miles from Daytona Beach's city center to Woodmark at Daytona Beach's address, calculated via Google Maps.

Calculate Travel Distance to Woodmark at Daytona Beach

Add your location

Address

Compare Nursing Homes around the area

Woodmark at Daytona Beach
NH
IL
Daytona Beach (Hopkins Fitch Grant) -60 - 55 1 Bed / 2 Bed / 3 Bed
Westminster Woods on Julington Creek
NH
AL
IL
MC
Fruit Cove (Saint Johns) -80 C- 47 -
Terracina Grand
NH
AL
IL
MC
RC
Naples -200 A+ 12 Studio / 1 Bed / 2 Bed

Frequently Asked Questions about Woodmark at Daytona Beach

What neighborhood is Woodmark at Daytona Beach in?

Woodmark at Daytona Beach is in the Hopkins Fitch Grant neighborhood.

Is Woodmark at Daytona Beach in a walkable area?

Woodmark at Daytona Beach has a walk score of 55. Moderately walkable. Some errands can be accomplished on foot, with a mix of nearby amenities.

What is the occupancy rate at Woodmark at Daytona Beach?

Woodmark at Daytona Beach's occupancy is 66.7%.

Does Woodmark at Daytona Beach operate as a for-profit or non-profit?

Woodmark at Daytona Beach is registered as a for-profit.

Are there photos of Woodmark at Daytona Beach?

Yes — there are 7 photos of Woodmark at Daytona Beach in the photo gallery on this page.

What is the address of Woodmark at Daytona Beach?

Woodmark at Daytona Beach is located at 900 Lpga Blvd, Daytona Beach, FL 32117.

What is the phone number of Woodmark at Daytona Beach?

(386) 766-4601 will put you in contact with the team at Woodmark at Daytona Beach.

Guides for Better Senior Living

Care Cost Calculator: See Prices in Your Area

Nursing Home Data Explorer

Don’t Wait Too Long: 7 Red Flag Signs Your Parent Needs Assisted Living Now

The True Cost of Assisted Living in 2025 – And How Families Are Paying For It

Understanding Senior Living Costs: Pricing Models, Discounts & Financial Assistance