Explore Open Rooms
1 Contact details
2 What type of senior care service are you looking for?
3 What budget do you have in mind for senior care?
4 How soon do you need to find care?
5 Additional details

Thank you for your interest!

Our team will be in touch shortly to help with next steps.

Hospice Home in Lowell

CMS overall rating Info The Overall CMS Rating combines results from health inspections, staffing levels and quality measures. Health inspections carry the most weight. Staffing and quality scores can increase or decrease the final rating based on performance compared to state and national standards.

Northwood Rehabilitation & Health Care Center

Overview of Northwood Rehabilitation & Health Care Center

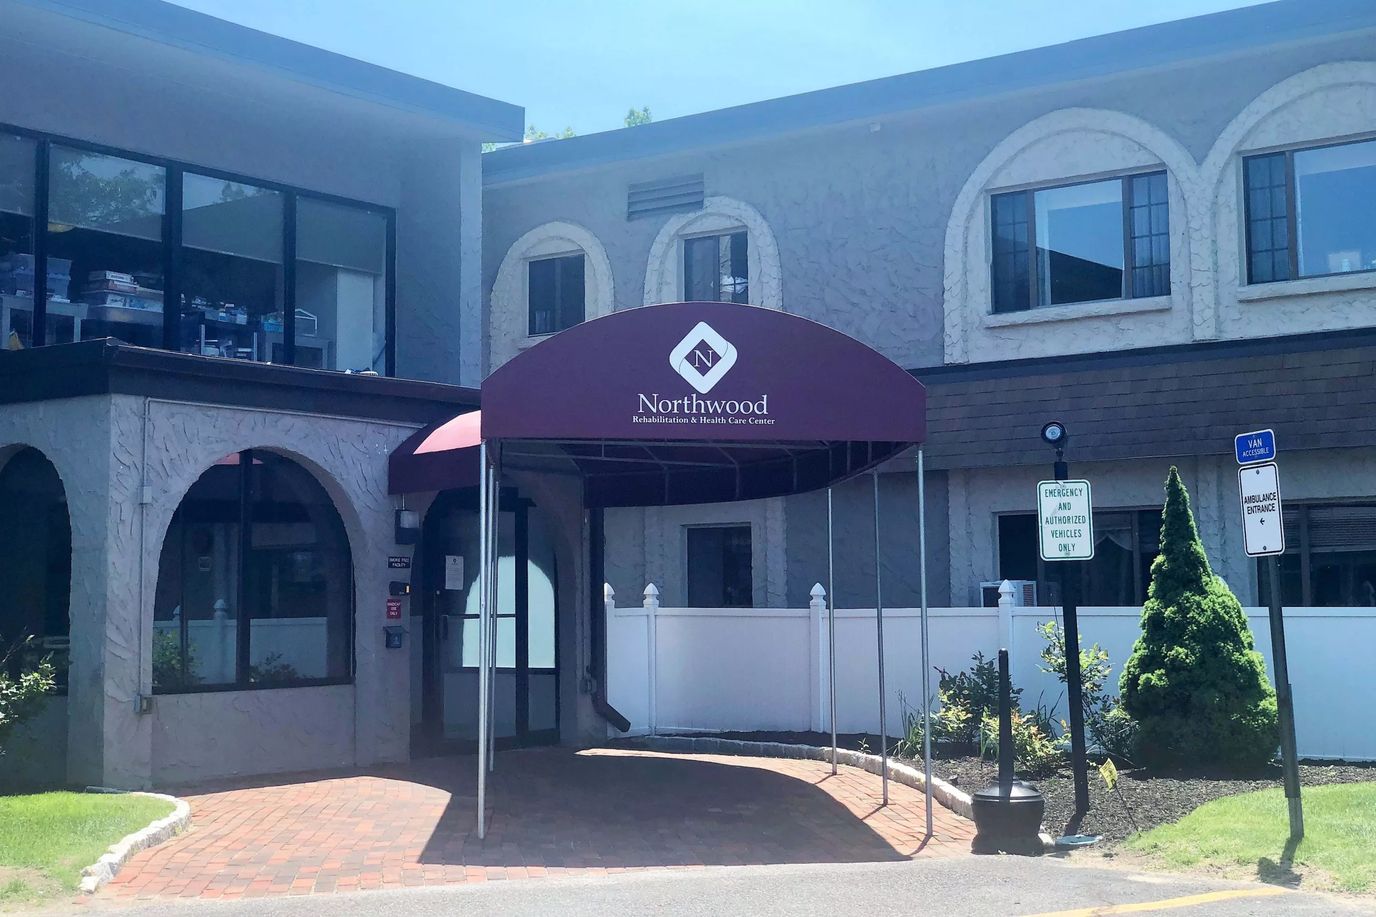
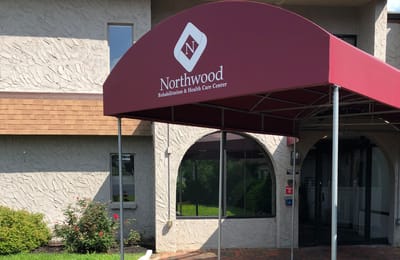
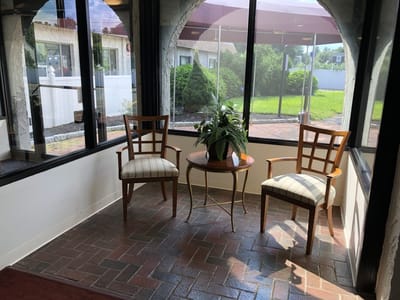
As a member of the Athena Health Care Systems, Northwood Rehabilitation and Health Care focuses on skilled nursing and short-term care for seniors in Lowell. The nursing home is composed of a professional care staff who brings not only excellence to the recovery of every senior; residents can genuinely feel the high-end quality of care in a nurturing environment.
Expect nothing but quality regarding Northwood service: 24/7 skilled nursing with specialized therapy programs, post-hospital care, hospice care, home health care, assisted living, and memory care services. Comprehensive services include behavioral management, wound care, tracheostomy care, respiratory treatments, etc.

Managed by Scott Wheeler

Interim Administrator

Scott Wheeler serves as the Interim Administrator at Northwood Rehabilitation & Health Care Center. He leads the community with dedication, overseeing the care of residents and staff to ensure high-quality short-term rehab and long-term care services. Scott is committed to guiding families through their healthcare decisions with professionalism and compassion.

Quality ratings

Measured by Centers for Medicare & Medicaid Services (CMS)

Overall rating Info The Overall CMS Rating combines results from health inspections, staffing levels and quality measures. Health inspections carry the most weight. Staffing and quality scores can increase or decrease the final rating based on performance compared to state and national standards.
1/5
Massachusetts average: 2.9/5
Health Inspection Info Based on the results of the facility's three most recent standard inspections and any complaint investigations. CMS reviews the number, scope, and severity of deficiencies, with more recent findings weighted more heavily.
1/5
Massachusetts average: 2.8/5
Staffing Info Measures average nursing staff hours per resident per day, including Registered Nurses (RNs) and total nursing staff. Ratings are adjusted based on the level of care residents require and are compared to state and national benchmarks.
2/5
Massachusetts average: 3.0/5
Quality Measures Info Based on clinical and physical health indicators reported to CMS, such as hospital readmissions, falls, pressure ulcers, and improvements in mobility. These measures reflect how well residents' health needs are being managed.
3/5
Massachusetts average: 3.2/5

Nursing care per resident

Info This shows how many total hours of nursing staff time are available per resident each day. Higher numbers usually mean more staff support.
2h 55m per day

This home provides 26% less nursing time per resident than the Massachusetts average.

Massachusetts average: 3h 56m per day

Capacity and availability

Medium-capacity home

Offers a balance of services and community atmosphere.

Total beds 123

This home usually has limited availability

Occupancy is moderate, suggesting balanced demand.

Similar demand to the Massachusetts average
Occupancy rate 90.9%
Residents per day (avg) 117
Occupancy rate
90.9%
Residents per day (avg)
117

Who this home usually serves

TYPE OF STAY

Mix of rehab and long-term care

This home supports both short-term rehab and long-term care, with residents staying for a wide range of durations.

Breakdown by payment type

Medicare

30% of new residents, usually for short-term rehab.

Typical stay 1 - 2 months

Private pay

59% of new residents, often for short stays.

Typical stay 1 months

Medicaid

12% of new residents, often for long-term daily care.

Typical stay 4 years

Finances and operations

Privately-owned community
Operated by a partnership between two or more business owners.
Home revenue
$27.2M
Operating loss
-$645.6K
Privately-owned community Operated by a partnership between two or more business owners.
Home revenue
$27.2M
Operating loss
-$645.6K
Payroll costs Info The portion of the home's budget spent on staff, including nurses, caregivers, and other employees who support care and operations.
$9.5M
34.9% of revenue
Other operating costs Info All remaining costs needed to run the home, such as food, utilities, building maintenance, supplies and administrative expenses.
$18.4M
Total costs $27.8M
Walk Score
Walk Score: 21 / 100
Car-dependent. Most errands require a car, with limited nearby walkable options.

About this community

Payment & Insurance

2 services
Accept Medicaid
Accept Medicare

Therapy & Rehabilitation

3 services
Rehabilitation Services
Respite Care
Short-Term Rehab

Staffing & Medical

4 services
Nursing Services
Skilled Nursing
Licensed Nurses/CNAs
24-Hour Staffing

Additional Services

2 services
Short-Term Rehabilitation
Hospice Care

Amenities & Lifestyle

4 amenities
Spacious Private And Semi-Private Rooms
Well-Appointed Dining Area
Comfortable Lounges
Landscaped Outdoor Terrace
Specific ProgramsHospice Care, Life Enrichment Programming, Short-Term Rehabilitation, Skilled Nursing Care, Substance Use Supportive Services
Operating HoursSuggested visiting hours are 10 AM – 8 PM, with accommodations as requested.

Dining & Nutrition

Food DescriptionThe kitchen staff provide a great variety of nutritious food daily, served either to residents' units or in the dining room.
Meals IncludedYes

Contact Northwood Rehabilitation & Health Care Center

Health Inspection History

Inspections
Total health inspections 5

Massachusetts average 4.5


Last Health inspection on Aug 2024

Total health citations 56

Massachusetts average 32.7

Citations per inspection
11.2

Massachusetts average 7.24


Health citations are formal notices following inspections when they fail to comply with safety and care standards.

53 of 56 citations resulted from standard inspections; and 3 of 56 resulted from complaint investigations.

Breakdown of citation severity (last 3 years)
Critical Health citations More info 0
100% better than Massachusetts average

Massachusetts average: 0.3


Serious Health citations More info 7
367% worse than Massachusetts average

Massachusetts average: 1.5

0 critical citations More info Massachusetts average: 0.3

7 serious citations More info Massachusetts average: 1.5

49 moderate citations More info Massachusetts average: 29.7

0 minor citations More info Massachusetts average: 1.3
Citations history (last 3 years)
Infection Control moderate citation Info Issues related to preventing and controlling infections, including hygiene practices and safety protocols. Aug 29, 2024
Corrected

Nursing Services moderate citation Info Issues related to the availability and quality of nursing staff and the care they provide. Aug 29, 2024
Corrected

Pharmacy moderate citation Info Issues related to medication management, including how drugs are stored, administered, and monitored. Aug 29, 2024
Corrected

Pharmacy moderate citation Info Issues related to medication management, including how drugs are stored, administered, and monitored. Aug 29, 2024
Corrected

Compare Hospice Homes around Lowell The information below is reported by the Massachusetts Executive Office of Elder Affairs and Department of Public Health.

Filter by care type
Fairhaven Healthcare Center for Rehabilitation and Nursing
NH

Nursing Home Licensed facility providing 24/7 skilled nursing care for residents with complex, ongoing medical needs. Staffed by RNs, LPNs, and CNAs. Inspected and star-rated annually by CMS. Accepts Medicare (short-term rehab) and Medicaid (long-term care).

AL

Assisted Living A licensed, long-term care setting for seniors or individuals with disabilities who need help with daily activities — like bathing, dressing, and medication management — but not 24-hour skilled nursing. Offers housing, meals, and around-the-clock support while aiming to maximize resident independence.

Lowell (Pawtucketville)
169
No
40
-
42
A+
No
Northwood Rehabilitation & Health Care Center
NH

Nursing Home Licensed facility providing 24/7 skilled nursing care for residents with complex, ongoing medical needs. Staffed by RNs, LPNs, and CNAs. Inspected and star-rated annually by CMS. Accepts Medicare (short-term rehab) and Medicaid (long-term care).

AL

Assisted Living A licensed, long-term care setting for seniors or individuals with disabilities who need help with daily activities — like bathing, dressing, and medication management — but not 24-hour skilled nursing. Offers housing, meals, and around-the-clock support while aiming to maximize resident independence.

Lowell (Pawtucketville)
123
No
21
-
-
-
No
Lowell General Hospital Palliative Care
AL

Assisted Living A licensed, long-term care setting for seniors or individuals with disabilities who need help with daily activities — like bathing, dressing, and medication management — but not 24-hour skilled nursing. Offers housing, meals, and around-the-clock support while aiming to maximize resident independence.

Lowell (Pawtucketville)
-
No
44
-
-
-
No
Tufts Medicine Care at Home
AL

Assisted Living A licensed, long-term care setting for seniors or individuals with disabilities who need help with daily activities — like bathing, dressing, and medication management — but not 24-hour skilled nursing. Offers housing, meals, and around-the-clock support while aiming to maximize resident independence.

Lowell (South Lowell)
-
No
57
-
-
-
No

Places of interest near Northwood Rehabilitation & Health Care Center

Address 2.7 miles from city center — 9.37 miles to nearest hospital (St. Joseph Hospital)

Calculate Travel Distance to Northwood Rehabilitation & Health Care Center

Add your location

Address

Staffing Data (Q2 2025)

This data corresponds to Q2 2025 and is based on CMS Payroll-Based Journal.

Total staff 125
Employees 124
Contractors 1
Staff to resident ratio 1.10:1
36% worse than Massachusetts average

Massachusetts average ratio: 1.70:1

Avg staff/day 56
Average shift 7.5 hours
5% worse than Massachusetts average

Massachusetts average: 7.9 hours

Total staff hours (quarter) 38,367
Nursing staff breakdown
Registered Nurse

Manages medical care and health needs.

Total count 10
Average shift length Info Average shift length. Calculated as total hours divided by days worked and average staff per day. 7.8 hours

No contractors work on this role.

Licensed Practical Nurse

Assists with medical care and medications.

Total count 24
Average shift length Info Average shift length. Calculated as total hours divided by days worked and average staff per day. 9 hours

No contractors work on this role.

Certified Nursing Assistant

Helps with daily care and mobility.

Total count 59
Average shift length Info Average shift length. Calculated as total hours divided by days worked and average staff per day. 7.4 hours

No contractors work on this role.

Contractor staffing

Total hours from contractors

0.3%

108 contractor hours this quarter

Medical Director: 1
Staff by category
Certified Nursing Assistant5905919,69191100%7.4
Licensed Practical Nurse240246,33591100%9
Registered Nurse100103,12991100%7.8
Other Dietary Services Staff6062,30591100%7.1
Physical Therapy Assistant4041,5948998%7.3
Mental Health Service Worker6061,5797178%7.1
Clinical Nurse Specialist3031,1268998%6.3
Dietitian1014775560%8.7
Nurse Practitioner1014756167%7.8
Administrator1014636066%7.7
Therapeutic Recreation Specialist1013654954%7.4
Respiratory Therapy Technician2023184549%7.1
Occupational Therapy Aide1012253033%7.5
Speech Language Pathologist2021271820%7.1
Medical Director0111082730%4
RN Director of Nursing2023755%7.4
Qualified Social Worker1011533%5
59 Certified Nursing Assistant
% of Days 100%
24 Licensed Practical Nurse
% of Days 100%
10 Registered Nurse
% of Days 100%
6 Other Dietary Services Staff
% of Days 100%
4 Physical Therapy Assistant
% of Days 98%
6 Mental Health Service Worker
% of Days 78%
3 Clinical Nurse Specialist
% of Days 98%
1 Dietitian
% of Days 60%
1 Nurse Practitioner
% of Days 67%
1 Administrator
% of Days 66%
1 Therapeutic Recreation Specialist
% of Days 54%
2 Respiratory Therapy Technician
% of Days 49%
1 Occupational Therapy Aide
% of Days 33%
2 Speech Language Pathologist
% of Days 20%
1 Medical Director
% of Days 30%
2 RN Director of Nursing
% of Days 5%
1 Qualified Social Worker
% of Days 3%

Facility Characteristics

Source: CMS Long-Term Care Facility Characteristics (Data as of Jan 2026)

Total census
114 residents
Residents by payment source
Medicare
5 residents (4.4%)
Medicaid
104 residents (91.2%)
Private pay or other
5 residents (4.4%)
Programs & Services
Residents' Group

Residents meet regularly to discuss policies, care quality, and activities

Active Resident Council

Organized group of residents that meets regularly to discuss facility policies, quality of life, and activities.

Quality of care over time

These measures show how residents usually do over time at this home, based on health outcomes and preventive care.

High-risk clinical events score Info A composite score based on pressure ulcers, falls with injury, weight loss, walking ability decline, and activities of daily living decline. 8.0
21% better than Massachusetts average

Massachusetts average: 10.2

Functional decline score Info A composite score based on activities of daily living decline, walking ability decline, and incontinence. 19.6
In line with Massachusetts average

Massachusetts average: 20.0

Long-stay resident measures
Need for Help with Daily Activities Increased Info Percent of long-stay residents whose need for help with daily activities has increased 15.4%
17% better than Massachusetts average

Massachusetts average: 18.7%

Walking Ability Worsened Info Percent of long-stay residents whose ability to move independently worsened 15.0%
22% better than Massachusetts average

Massachusetts average: 19.3%

Low Risk Residents with Bowel/Bladder Incontinence Info Percent of low risk long-stay residents who lose control of their bowels or bladder 28.3%
28% worse than Massachusetts average

Massachusetts average: 22.1%

Falls with Major Injury Info Percent of long-stay residents experiencing one or more falls with major injury 3.6%
In line with Massachusetts average

Massachusetts average: 3.6%

High Risk Residents with Pressure Ulcers Info Percent of long-stay high risk residents with pressure ulcers 2.3%
51% better than Massachusetts average

Massachusetts average: 4.7%

Urinary Tract Infection Info Percent of long-stay residents with a urinary tract infection 0.5%
76% better than Massachusetts average

Massachusetts average: 2.1%

Lost Too Much Weight Info Percent of long-stay residents who lose too much weight 3.9%
24% better than Massachusetts average

Massachusetts average: 5.2%

Depressive Symptoms Info Percent of long-stay residents who have depressive symptoms 1.1%
90% better than Massachusetts average

Massachusetts average: 10.7%

Antipsychotic Use Info Percent of long-stay residents who received an antipsychotic medication 32.5%
61% worse than Massachusetts average

Massachusetts average: 20.3%

Pneumococcal Vaccine Info Percent of long-stay residents assessed and appropriately given the pneumococcal vaccine 76.1%
17% worse than Massachusetts average

Massachusetts average: 91.9%

Influenza Vaccine Info Percent of long-stay residents assessed and appropriately given the seasonal influenza vaccine 91.9%
In line with Massachusetts average

Massachusetts average: 94.8%

Short-stay resident measures
Pneumococcal Vaccine Info Percent of short-stay residents assessed and appropriately given the pneumococcal vaccine 55.8%
27% worse than Massachusetts average

Massachusetts average: 76.7%

Antipsychotic medication increase Info Percent of short-stay residents who newly received an antipsychotic medication 1.8%
33% worse than Massachusetts average

Massachusetts average: 1.3%

Influenza Vaccine Info Percent of short-stay residents assessed and appropriately given the seasonal influenza vaccine 25.0%
68% worse than Massachusetts average

Massachusetts average: 77.7%

Penalties and fines

Federal penalties imposed by CMS for regulatory violations, including civil money penalties (fines) and denials of payment for new Medicare/Medicaid admissions.

Source: CMS Penalties Database (Data as of Jan 2026)

Total fines amount $166K
130% higher than Massachusetts average

Massachusetts average: $72K

Number of fines 2
17% more fines than Massachusetts average

Massachusetts average: 1.7

Payment Denials Info Serious action where Medicare and/or Medicaid temporarily stops payments for new residents until issues are fixed. 0
100% fewer payment denials than Massachusetts average

Massachusetts average: 0.1

Fines amount comparison
This facility $166K
Massachusetts average $72K
Penalty History

Penalties are imposed by CMS for violations of federal nursing home regulations.

Civil Money Penalty Info Fines imposed for noncompliance, which can be assessed per day or per instance of violation. Aug 29, 2024
$85K
Civil Money Penalty Info Fines imposed for noncompliance, which can be assessed per day or per instance of violation. Aug 10, 2023
$81K

Last updated: Jan 2026

Guides for Better Senior Living

Care Cost Calculator: See Prices in Your Area

Nursing Home Data Explorer

Don’t Wait Too Long: 7 Red Flag Signs Your Parent Needs Assisted Living Now

The True Cost of Assisted Living in 2025 – And How Families Are Paying For It

Understanding Senior Living Costs: Pricing Models, Discounts & Financial Assistance

Financial Aid for Massachusetts Seniors

Get financial aid guidance

Home Care Program

MassHealth Home Care

Age 60+, Massachusetts resident, at risk of nursing home placement.

~$1,500/month (individual, varies by region).

$2,000 (individual, excludes home, car).

Coordinated through Aging Services Access Points (ASAPs); high demand in urban areas.

Frail Elder Waiver

Massachusetts Medicaid FE Waiver

Age 65+, Massachusetts resident, Medicaid-eligible, nursing home-level care need.

~$2,829/month (300% FBR, individual).

$2,000 (individual), $3,000 (couple).

Requires clinical eligibility determination.

Senior Care Options (SCO)

Massachusetts Senior Care Options

Age 65+, Massachusetts resident, eligible for MassHealth (Medicare optional), nursing home-level care need.

~$2,829/month (300% FBR, individual); QIT allowed.

$2,000 (individual), $3,000 (couple) (excludes home up to $713,000, car).

Not available in Dukes/Nantucket Counties; multiple SCO providers (e.g., CCA, Tufts).

Medicare Savings Program (MSP)

Massachusetts Medicare Savings Program (MassHealth Buy-In)

Age 65+ or disabled, Massachusetts resident, Medicare Part A/B.

~$2,510/month (QMB), ~$3,380/month (SLMB), ~$3,598/month (QI)—individual.

$9,430 (individual), $14,130 (couple).

Three tiers; no waitlist; includes Extra Help for Part D.

National Family Caregiver Support Program (NFCSP) Respite

Massachusetts NFCSP Respite Care

Caregivers of 60+ needing care or 55+ caregivers of others; Massachusetts resident; functional needs (2+ ADLs).

Prioritizes ~$24,980/year (individual); no strict cap.

Not assessed; need-based.

27 ASAPs; prioritizes low-income, rural caregivers.

Prescription Advantage

Massachusetts Prescription Advantage

Age 65+ or disabled, Massachusetts resident, enrolled in Medicare Part D (or ineligible for Medicare).

No strict limit; copays vary by income (~$24,980-$75,000/year individual).

Not assessed.

Supplements Medicare Part D; no enrollment fee for low-income.

Senior Community Service Employment Program (SCSEP)

Massachusetts SCSEP

Age 55+, unemployed, low-income, Massachusetts resident.

~$1,983/month (125% FPL).

Not specified; income-focused.

Priority for veterans, rural residents; AARP partnership.

VA Aid and Attendance (A&A) and Housebound Benefits

Massachusetts VA Aid and Attendance/Housebound

Age 65+ or disabled veteran/spouse, Massachusetts resident, wartime service, need for ADL help (A&A) or homebound.

Net income < ~$1,984/month (veteran with dependent, A&A); pension offsets income.

~$155,356 (net worth limit).

High veteran demand statewide.