Sunrise of Fort Worth
Nursing Home, Assisted Living & Memory Care · Fort Worth, TX
CMS overall rating Info CMS (the Centers for Medicare & Medicaid Services) is the federal agency that rates nursing home quality. Its Overall Rating runs from 1 to 5 stars, combining health inspections, staffing, and quality measures, with inspections weighted most heavily.

Sunrise of Fort Worth

Nursing Home, Assisted Living & Memory Care · Fort Worth, TX
CMS overall rating Info CMS (the Centers for Medicare & Medicaid Services) is the federal agency that rates nursing home quality. Its Overall Rating runs from 1 to 5 stars, combining health inspections, staffing, and quality measures, with inspections weighted most heavily.
Calculator: See prices in your area
Sunrise of Fort Worth accepts Medicare, Medicaid, and private pay.

Overview of Sunrise of Fort Worth

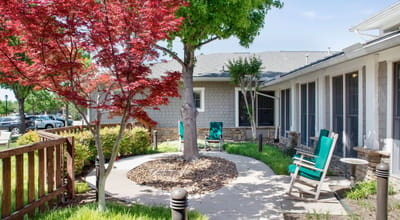
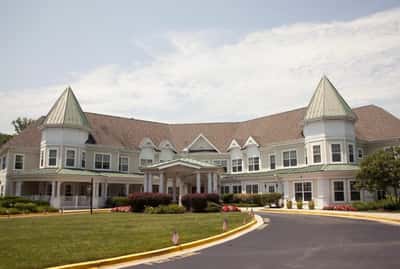
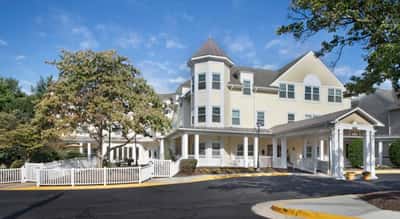
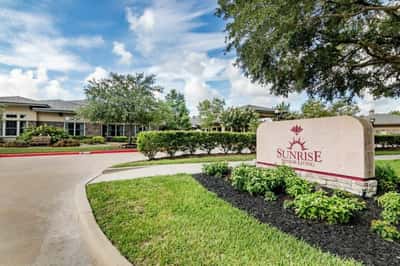
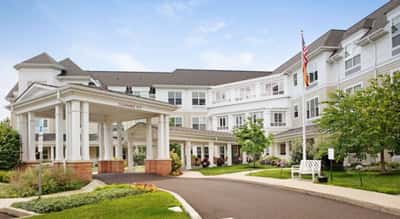
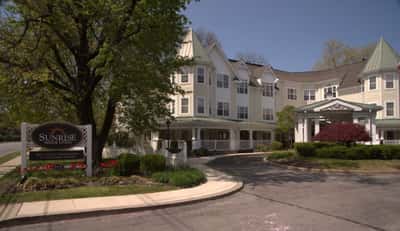
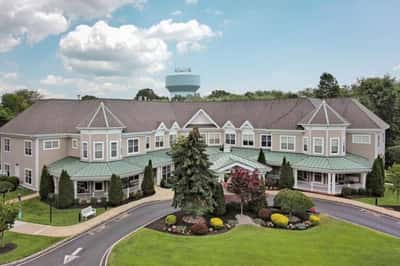
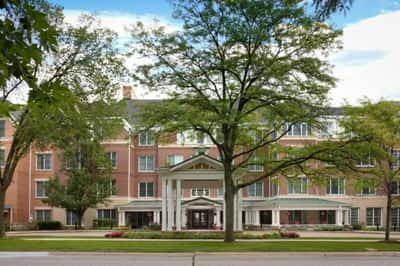
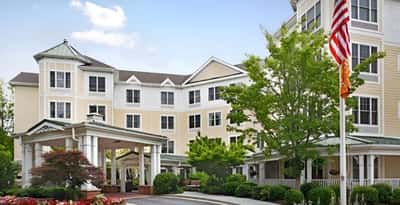
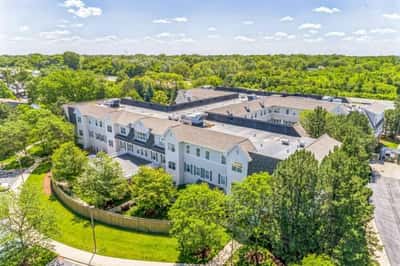
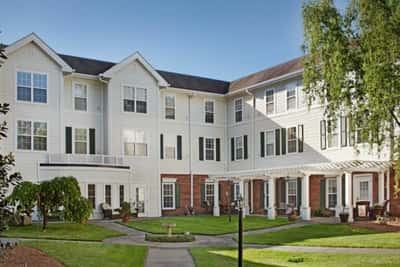
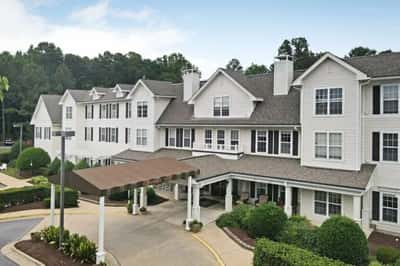
Sunrise of Fort Worth is a senior living community that offers assisted living, independent living, and memory care services. The community is located in a prime Fort Worth location, allowing residents to focus on their holistic wellness while enjoying exercise classes, beautiful outdoor spaces, and well-balanced, flavorful cuisine prepared by the in-house chef. Sunrise of Fort Worth prides itself on the tenure of its management and the beautiful, well-maintained community, providing a warm and comfortable atmosphere for residents.

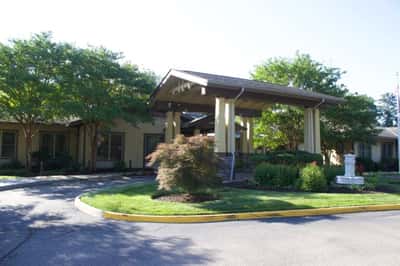
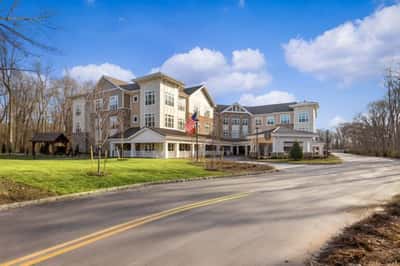
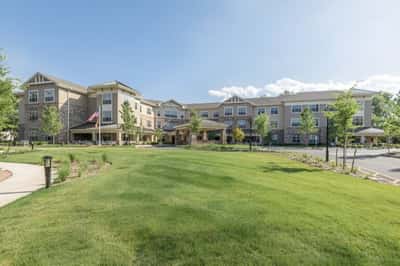
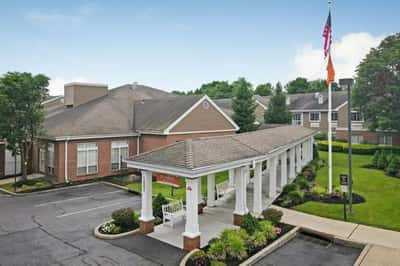
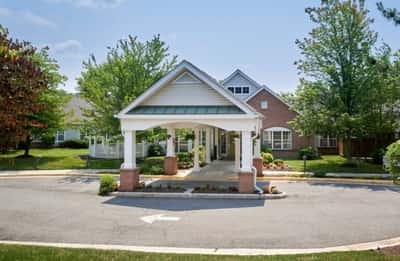
The assisted living neighborhood at Sunrise of Fort Worth offers support with daily activities, allowing residents to engage, thrive, and find new friendships. The independent living option allows residents to indulge in their independent lifestyle with comfortable apartments and top-notch amenities, while the memory care neighborhood provides personalized care and specialized programming for residents living with Alzheimer’s or another form of dementia. Sunrise of Fort Worth is conveniently located near many of the area’s attractions and offers a variety of services and amenities, including restaurant-style dining, transportation, and a range of recreational activities.

(817) 292-2288

Quality ratings

Measured by Centers for Medicare & Medicaid Services (CMS)

Overall rating Info The Overall CMS Rating combines results from health inspections, staffing levels and quality measures. Health inspections carry the most weight. Staffing and quality scores can increase or decrease the final rating based on performance compared to state and national standards.
▼ 66.8% Below TX avg. ▼ 66.8% Below TX avg.Click the badge to see the full State ranking.Click here to see the full State ranking.
Health Inspection Info Based on the results of the facility's three most recent standard inspections and any complaint investigations. CMS reviews the number, scope, and severity of deficiencies, with more recent findings weighted more heavily.
▼ 30.8% Below TX avg. ▼ 30.8% Below TX avg.Click the badge to see the full State ranking.Click here to see the full State ranking.
Staffing Info Measures average nursing staff hours per resident per day, including Registered Nurses (RNs) and total nursing staff. Ratings are adjusted based on the level of care residents require and are compared to state and national benchmarks.
▼ 58.3% Below TX avg. ▼ 58.3% Below TX avg.Click the badge to see the full State ranking.Click here to see the full State ranking.
Quality Measures Info Based on clinical and physical health indicators reported to CMS, such as hospital readmissions, falls, pressure ulcers, and improvements in mobility. These measures reflect how well residents' health needs are being managed.
At TX avg. At TX avg.Click the badge to see the full State ranking.Click here to see the full State ranking.

Staffing hours breakdown

Info Daily nursing hours per resident by staff type, reported to CMS. Higher is generally better — compare this facility to state and national averages to see where staffing stands.

Hours per resident per day — compared to Texas state averages

Total nursing care / resident Info This home is ranked 184th out of 289 homes in Texas for nurse hours. Total adjusted nursing hours per resident per day, combining RN, LPN, and aide time. CMS adjusts this for case-mix so facilities can be fairly compared.
3h 20m per day
Rank #184 / 289Nurse hours — State benchmarkedThis home is ranked 184th out of 289 homes in Texas. Shows adjusted nurse hours per resident per day benchmarked to the Texas average, with a ranking across 289 Texas facilities. More hours mean more direct care. The national average is about 3.5 hrs; below 3.0 is a red flag.Click the rank badge to see the full State ranking.Click here to see the full State ranking.
This facility Texas avg (3h 47m per day)
vs Texas avg
-12%

4 of 6 metrics below state avg

Staff typeHours / Day / Residentvs state avg
Registered Nurse (RN) Info RNs hold the highest nursing license and can assess residents, interpret test results, and direct care plans. More RN hours per day often signals stronger clinical oversight and faster response to health changes. 15m per day ▼ 43% State avg: 25m per day · National avg: 41m per day
LPN / LVN Info Licensed Practical Nurses (LPNs) or Licensed Vocational Nurses (LVNs) deliver routine hands-on care — medication administration, wound dressing, and monitoring vital signs. They work under RN supervision and make up a large share of daily bedside care. 57m per day ■ Avg State avg: 57m per day · National avg: 52m per day
Nurse Aide Info Certified Nurse Aides (CNAs) provide the most direct day-to-day assistance: bathing, dressing, feeding, and mobility. Nurse aide hours are typically the largest staffing category and directly affect residents' quality of life. 1h 59m per day ■ Avg State avg: 2h 1m per day · National avg: 2h 20m per day
Weekend Total Nursing Info Combined nursing hours (RN + LPN + Nurse Aide) per resident per day on weekends. Staffing often drops on weekends — this figure reveals whether the facility maintains adequate coverage outside of weekday hours. 2h 49m per day ▼ 6% State avg: 3h 0m per day · National avg: 3h 27m per day
Physical Therapist Info Hours per resident per day provided by licensed Physical Therapists (PTs) or PT Assistants. PT services help residents recover mobility after injury or illness and are especially important for post-acute (short-stay) rehabilitation. 1m per day ▼ 63% State avg: 4m per day · National avg: 4m per day
Weekend RN Info Registered nurse hours specifically on weekends. Facilities sometimes reduce RN presence on Saturdays and Sundays — a low weekend RN figure compared to weekday hours can indicate reduced clinical oversight when most administrative staff are absent. 11m per day ▼ 46% State avg: 20m per day · National avg: 29m per day

Capacity and availability

This home usually has availability

Higher occupancy than the Texas average: 63.5%
Occupancy rate
69.2% Rank #132 / 297Occupancy rate — State benchmarkedThis home is ranked 132nd out of 297 homes in Texas. Shows this facility's occupancy rate versus the Texas average, with its Statewide rank out of 297. Higher occupancy signals strong local demand and financial stability.Click the rank badge to see the full State ranking.Click here to see the full State ranking.
Avg. Length of Stay
96 days
Bed community size
105-bed community Rank #341 / 988Bed count — State benchmarkedThis home is ranked 341st out of 988 homes in Texas. Shows this facility's certified or reported bed count compared to other Texas facilities. Larger communities may offer more amenities, programs, and on-site services for residents and families.Click the rank badge to see the full State ranking.Click here to see the full State ranking.
A larger shared setting that may offer more common spaces and organized community services.
Years in operation
45 years in operation Rank #106 / 583Years in operation — State benchmarkedThis home is ranked 106th out of 583 homes in Texas. Shows how long this facility has been in operation compared to other Texas facilities. Longer operating histories may benefit residents, families, and staff.Click the rank badge to see the full State ranking.Click here to see the full State ranking.
A longer operating history, which may indicate experience navigating regulations and delivering ongoing care.
Walk Score
Walk Score: 53 / 100 Rank #433 / 1391Walk Score — State benchmarkedThis home is ranked 433rd out of 1391 homes in Texas. Shows how walkable this facility's neighborhood is compared to the average Walk Score across Texas facilities. Higher scores benefit residents, families, and staff.Click the rank badge to see the full State ranking.Click here to see the full State ranking.
Moderately walkable. Some errands can be accomplished on foot, with a mix of nearby amenities.
BBB Rating
BBB Rating: A- (Not Accredited)
An independent rating from the Better Business Bureau based on factors such as complaint history, transparency, and business practices.
How BBB ratings work

About this community

License Details

Facility TypeType B
StatusLicensed
ExpirationJanuary 5, 2026
CountyTarrant
License Number149829
Year Opened5/23/2007

Ownership & Operating Entity

Sunrise of Fort Worth is legally operated by Ms Fort Worth Sh Llc, and administrated by Mellisa Daley.

Management CompanySUNRISE SENIOR LIVING MANAGEMENT, INC
OwnerMS FORT WORTH SH LLC
Ownership TypeLimited Liability Company (LLC)

Type Of Units

Alzheimer's Units
42 units
Total beds
105 units

Staffing

Key information about the people who lead and staff this community.

Leadership

ContactMr. Paul Klaassen, Founder
Administrator Email[email protected]

Memory & Specialized Care

1 service
Alzheimer's Certification

Contact Sunrise of Fort Worth

Inspection History

In Texas, the Health and Human Services Commission (HHSC) is the primary regulatory body that conducts unannounced inspections and publishes quality reports for all long-term care homes.

Since 2022 · 4 years of data 14 citations 2 inspections

Inspection Scorecard Info This scorecard compares key inspection, citation, and complaint metrics at this facility against the Texas state average. Metrics rated ≥15% worse than average are highlighted in red; those ≥15% better are highlighted in green.

Since 2022 vs. Texas state average
Overall vs. TX average 5 Worse Metrics worse than Texas average:
• Total citations (133% above)
• Health citations (150% above)
• Life safety citations (50% above)
• Citations per year (133% above)
• Inspections with citations (100% above)
0 Better No metrics in this bucket.
Latest Inspection June 14, 2022 Other An inspection that falls outside standard annual surveys and formal complaint investigations. May include administrative compliance checks, documentation reviews, focused surveys on specific concerns, or revisit surveys to verify prior corrections.

Citations Info Citations are formal regulatory issues recorded during state inspections.

This FacilityTX Averagevs. TX Avg
Total citations Info Formal regulatory issues recorded by inspectors across all inspection types. 146 This facility has 133% more total citations than a typical Texas nursing home (14 vs. TX avg 6).↑ 133% worse
Health citations Info Violations related to resident care, clinical practices, and day-to-day operations. 52 This facility has 150% more health citations than a typical Texas nursing home (5 vs. TX avg 2).↑ 150% worse
Life safety citations Info Violations related to building safety — fire prevention, emergency egress, and similar. 96 This facility has 50% more life safety citations than a typical Texas nursing home (9 vs. TX avg 6).↑ 50% worse
Citations per year Info Average citations per year since 2022. 3.51.5 This facility has 133% more citations per year than a typical Texas nursing home (3.5 vs. TX avg 1.5).↑ 133% worse

Inspections Info State inspections evaluate whether the facility meets health and safety standards.

This FacilityTX Averagevs. TX Avg
Inspections with citations Info Inspections that resulted in at least one regulatory citation. 21 This facility has 100% more inspections with citations than a typical Texas nursing home (2 vs. TX avg 1).↑ 100% worse

Inspection Reports Summary Info An editor-reviewed summary of the themes and findings across this facility's recent inspection reports.

  • June 14, 2022 inspection cited 14 deficiencies including medication security, food safety, emergency preparedness, and multiple fire safety violations, with one deficiency still pending correction.
  • Facility failed to ensure locking devices on exit and control doors released properly during fire alarm or sprinkler activation and lacked staff training on door release methods.
  • Deficiencies included failure to secure medications, prevent food cross-contamination, conduct emergency risk assessments, and meet fire-rated construction standards for walls and safety glazing.

Health Inspection History

Inspections since 2022
Total health inspections 16

Texas average 7.4


Last Health inspection on Jul 2025

Total health citations
34 Rank #229 / 292Health citations — State benchmarkedThis home is ranked 229th out of 292 homes in Texas. Shows this facility's total health deficiency citations benchmarked to the Texas State average, with a ranking across all 292 TX facilities. Lower citation counts earn a better rank.Click the rank badge to see the full State ranking.Click here to see the full State ranking.

Texas average 25.9

Citations per inspection
2.12 Rank #34 / 292Citations per inspection — State benchmarkedThis home is ranked 34th out of 292 homes in Texas. Shows average deficiency citations per CMS inspection for this facility versus the Texas mean across 292 facilities with citation data. Lower is better.Click the rank badge to see the full State ranking.Click here to see the full State ranking.

Texas average 3.67


Health citations are formal notices following inspections when they fail to comply with safety and care standards.

14 of 34 citations resulted from standard inspections; 16 of 34 resulted from complaint investigations; and 4 of 34 came from combined inspections (standard and complaint).

Breakdown of citation severity (last 4 years)
Critical health citations
2
In line with Texas average

Texas average: 2


Serious health citations
1
150% worse than Texas average

Texas average: 0.4

2 critical citations Texas average: 2

1 serious citation Texas average: 0.4

31 moderate citations Texas average: 23

0 minor citations Texas average: 0.4
Citations history (last 4 years)
Infection Control moderate citation Jul 29, 2025
Corrected

Quality of Care moderate citation Jul 29, 2025
Corrected

Quality of Care moderate citation Jul 29, 2025
Corrected

Abuse/Neglect moderate citation Jun 05, 2025
Corrected

Staffing Data

Reporting period: October 1 – December 31, 2025 (Q4 2025). Source: CMS Payroll-Based Journal report.

Total staff 242
Employees 78
Contractors 164
Staff to resident ratio 2.57 : 1
74% more staff per resident than Texas average
Texas average ratio: 1.48 : 1 Texas average ratio: 1.48 : 1See full Texas ranking
Avg staff/day 49
Average shift 7.9 hours
0% compared with Texas average
Texas average: 8.1 hours Texas average shift: 8.1 hoursSee full Texas ranking
Total staff hours (quarter) 35,413

Nursing staff breakdown

Q4 2025 · Oct 1 – Dec 31 More info This data comes from the CMS Payroll-Based Journal report covering October 1 – December 31, 2025.
Registered Nurse

Manages medical care and health needs.

RN Staff Info 10 total: 8 full-time employees and 2 contractors. 10
Average shift length Info Average shift length. Calculated as total hours divided by days worked and average staff per day. 8 hours
Licensed Practical Nurse

Assists with medical care and medications.

LPN Staff Info 61 total: 16 full-time employees and 45 contractors. 61
Average shift length Info Average shift length. Calculated as total hours divided by days worked and average staff per day. 8.6 hours
Certified Nursing Assistant

Helps with daily care and mobility.

CNA Staff Info 129 total: 36 full-time employees and 93 contractors. 129
Average shift length Info Average shift length. Calculated as total hours divided by days worked and average staff per day. 7.6 hours

Contractor staffing

Q4 2025 · Oct 1 – Dec 31 More info This data comes from the CMS Payroll-Based Journal report covering October 1 – December 31, 2025.

Total hours from contractors

20.5%

7,249 contractor hours this quarter

Certified Nursing Assistant: 93 Licensed Practical Nurse: 45 Speech Language Pathologist: 8 Physical Therapy Aide: 4 Respiratory Therapy Technician: 4 Physical Therapy Assistant: 3 Qualified Social Worker: 2 Registered Nurse: 2 Medication Aide/Technician: 1 Medical Director: 1 Occupational Therapy Assistant: 1

Staff by category

Q4 2025 · Oct 1 – Dec 31 More info This data comes from the CMS Payroll-Based Journal report covering October 1 – December 31, 2025.
Certified Nursing Assistant369312915,22692100%7.6
Licensed Practical Nurse1645617,05292100%8.6
Medication Aide/Technician8193,42392100%8.7
RN Director of Nursing4041,8857986%8
Physical Therapy Aide0441,6337784%8.3
Registered Nurse82101,3708491%8
Speech Language Pathologist0881,2797986%8.8
Qualified Social Worker0225416975%7.8
Clinical Nurse Specialist1015166874%7.6
Administrator1015046368%8
Dietitian1014535964%7.7
Nurse Practitioner1013924953%8
Mental Health Service Worker1013704852%7.7
Physical Therapy Assistant0332725863%4.3
Respiratory Therapy Technician0442326975%2.7
Occupational Therapy Aide1011922426%8
Occupational Therapy Assistant0114355%8.6
Medical Director0113033%10
129 Certified Nursing Assistant
% of Days 100%
61 Licensed Practical Nurse
% of Days 100%
9 Medication Aide/Technician
% of Days 100%
4 RN Director of Nursing
% of Days 86%
4 Physical Therapy Aide
% of Days 84%
10 Registered Nurse
% of Days 91%
8 Speech Language Pathologist
% of Days 86%
2 Qualified Social Worker
% of Days 75%
1 Clinical Nurse Specialist
% of Days 74%
1 Administrator
% of Days 68%
1 Dietitian
% of Days 64%
1 Nurse Practitioner
% of Days 53%
1 Mental Health Service Worker
% of Days 52%
3 Physical Therapy Assistant
% of Days 63%
4 Respiratory Therapy Technician
% of Days 75%
1 Occupational Therapy Aide
% of Days 26%
1 Occupational Therapy Assistant
% of Days 5%
1 Medical Director
% of Days 3%

Penalties and fines

Includes penalties issued in 2023-2025

Federal penalties imposed by CMS for regulatory violations, including civil money penalties (fines) and denials of payment for new Medicare/Medicaid admissions.

Source: CMS Penalties Database (Data as of Jan 2026)

Total fines amount $88K Rank #234 / 294Federal fines — State benchmarkedThis home is ranked 234th out of 294 homes in Texas. Shows this facility's cumulative CMS federal fine dollars versus the Texas average among facilities with fines, and where it ranks among 294 facilities in the pool. Lower total dollars mean a better rank.Click the rank badge to see the full State ranking.Click here to see the full State ranking.
9% higher than Texas average

Texas average: $80K

Number of fines 2
20% fewer fines than Texas average

Texas average: 2.5

Payment Denials Info Serious action where Medicare and/or Medicaid temporarily stops payments for new residents until issues are fixed. 1
354% more payment denials than Texas average

Texas average: 0.2

Fines amount comparison
This facility $88K
Texas average $80K
Penalty History

Penalties are imposed by CMS for violations of federal nursing home regulations.

3 penalties in the past 3 years

Multiple penalties were reported in the last 3 years.

Civil Money Penalty Info Fines imposed for noncompliance, which can be assessed per day or per instance of violation. Jan 8, 2025
$9K
Civil Money Penalty Info Fines imposed for noncompliance, which can be assessed per day or per instance of violation. Aug 31, 2023
$79K
Payment Denial Info Serious action where Medicare and/or Medicaid temporarily stops payments for new residents until issues are fixed. Aug 31, 2023
1 days

Last updated: Jan 2026

Quality of care over time

These measures show how residents usually do over time at this home, based on health outcomes and preventive care.

High-risk clinical events score Info A composite score based on pressure ulcers, falls with injury, weight loss, walking ability decline, and activities of daily living decline. 5.1
41% better than Texas average

Texas average: 8.6

Functional decline score Info A composite score based on activities of daily living decline, walking ability decline, and incontinence. 11.2
30% better than Texas average

Texas average: 16.0

Long-stay resident measures
Need for Help with Daily Activities Increased Info Percent of long-stay residents whose need for help with daily activities has increased 7.1%
56% better than Texas average

Texas average: 16.2%

Walking Ability Worsened Info Percent of long-stay residents whose ability to move independently worsened 10.0%
39% better than Texas average

Texas average: 16.2%

Low Risk Residents with Bowel/Bladder Incontinence Info Percent of low risk long-stay residents who lose control of their bowels or bladder 16.5%
5% worse than Texas average

Texas average: 15.7%

Falls with Major Injury Info Percent of long-stay residents experiencing one or more falls with major injury 3.3%
In line with Texas average

Texas average: 3.2%

High Risk Residents with Pressure Ulcers Info Percent of long-stay high risk residents with pressure ulcers 4.3%
In line with Texas average

Texas average: 4.4%

Urinary Tract Infection Info Percent of long-stay residents with a urinary tract infection 0.0%
100% better than Texas average

Texas average: 0.8%

Lost Too Much Weight Info Percent of long-stay residents who lose too much weight 1.0%
72% better than Texas average

Texas average: 3.5%

Depressive Symptoms Info Percent of long-stay residents who have depressive symptoms 3.6%
24% worse than Texas average

Texas average: 2.9%

Pneumococcal Vaccine Info Percent of long-stay residents assessed and appropriately given the pneumococcal vaccine 99.2%
In line with Texas average

Texas average: 97.3%

Influenza Vaccine Info Percent of long-stay residents assessed and appropriately given the seasonal influenza vaccine 99.0%
In line with Texas average

Texas average: 97.9%

Short-stay resident measures
Pneumococcal Vaccine Info Percent of short-stay residents assessed and appropriately given the pneumococcal vaccine 40.8%
55% worse than Texas average

Texas average: 90.4%

Antipsychotic medication increase Info Percent of short-stay residents who newly received an antipsychotic medication 2.6%
81% worse than Texas average

Texas average: 1.4%

Influenza Vaccine Info Percent of short-stay residents assessed and appropriately given the seasonal influenza vaccine 38.7%
56% worse than Texas average

Texas average: 88.0%

Breakdown by payment type

Medicare

25% of new residents, usually for short-term rehab.

Typical stay 1 - 2 months

Private pay

70% of new residents, often for short stays.

Typical stay 1 - 2 months

Medicaid

5% of new residents, often for long-term daily care.

Typical stay 4 - 5 years

Facility Characteristics

Source: CMS Long-Term Care Facility Characteristics (Data as of Jan 2026)

Total residents 94
Medicare
5
5.3% of residents
Medicaid
63
67% of residents
Private pay or other
26
27.7% of residents
Programs & Services
Residents Group

Residents meet regularly to discuss policies, care quality, and activities

Active Resident Council

Organized group of residents that meets regularly to discuss facility policies, quality of life, and activities.

Finances and operations

Privately-owned community
Operated by a single business entity.
Home revenue
$12.3M
Profit
$489.7K
Privately-owned community Operated by a single business entity.
Home revenue
$12.3M Rank #112 / 297Revenue — State benchmarkedThis home is ranked 112th out of 297 homes in Texas. Shows this facility's annual revenue compared to the Texas average. Higher revenue generally means more resources for staffing and capital — read alongside Payroll %.Click the rank badge to see the full State ranking.Click here to see the full State ranking.
Profit
$489.7K
Payroll costs Info The portion of the home's budget spent on staff, including nurses, caregivers, and other employees who support care and operations. Rank #126 / 297Payroll — State benchmarkedThis home is ranked 126th out of 297 homes in Texas. Shows total annual staff payroll benchmarked to the Texas average. Higher payroll investment relative to peers often signals better staffing and less reliance on cheaper contract labor.Click the rank badge to see the full State ranking.Click here to see the full State ranking.
$5.4M
43.9% of revenue Rank #186 / 297Payroll % — State benchmarkedThis home is ranked 186th out of 297 homes in Texas. Shows payroll as a percentage of revenue versus the Texas average. Well-run Texas facilities typically land around 51–63% — the top third Statewide. Below 25% may signal understaffing or heavy agency use — read with Staffing ratings.Click the rank badge to see the full State ranking.Click here to see the full State ranking.
Other operating costs Info All remaining costs needed to run the home, such as food, utilities, building maintenance, supplies and administrative expenses.
$6.4M
Total costs $11.8M

What does this home offer?

Pets allowed icon
Pets allowed icon

Pets Allowed

Housing options icon

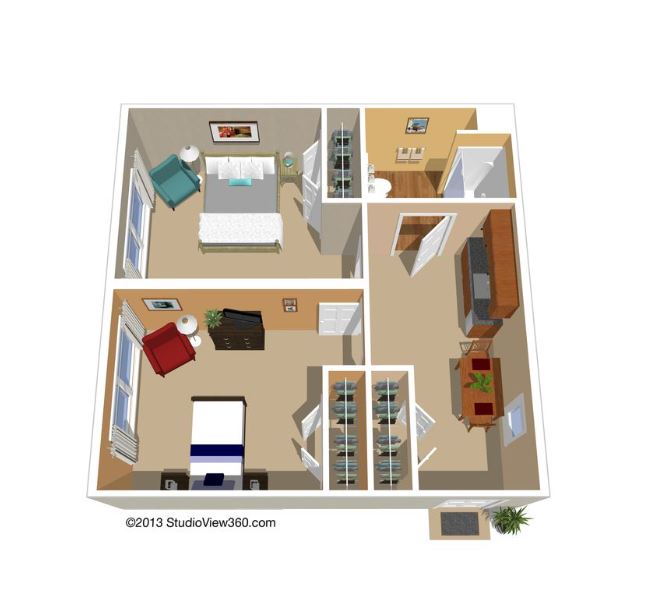
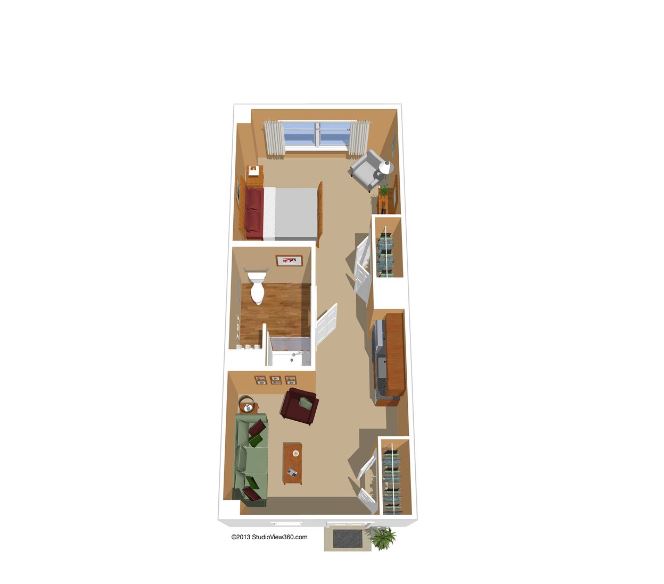
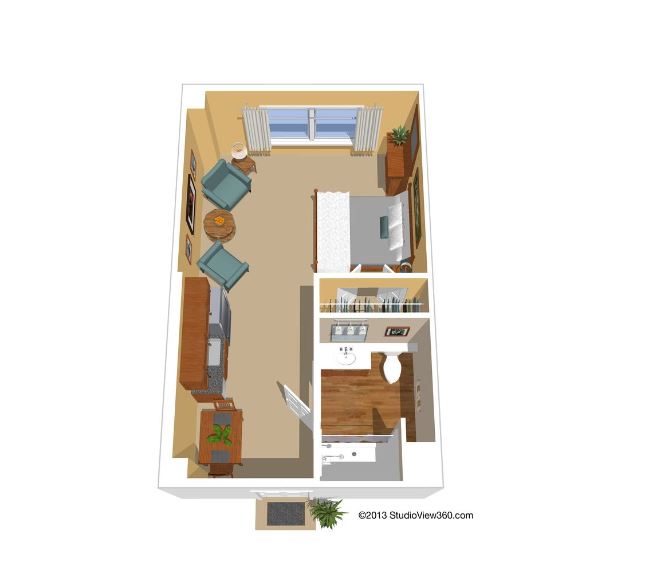
Housing Options: Studio / 1 Bed / 2 Bed

Building type icon
Building type icon

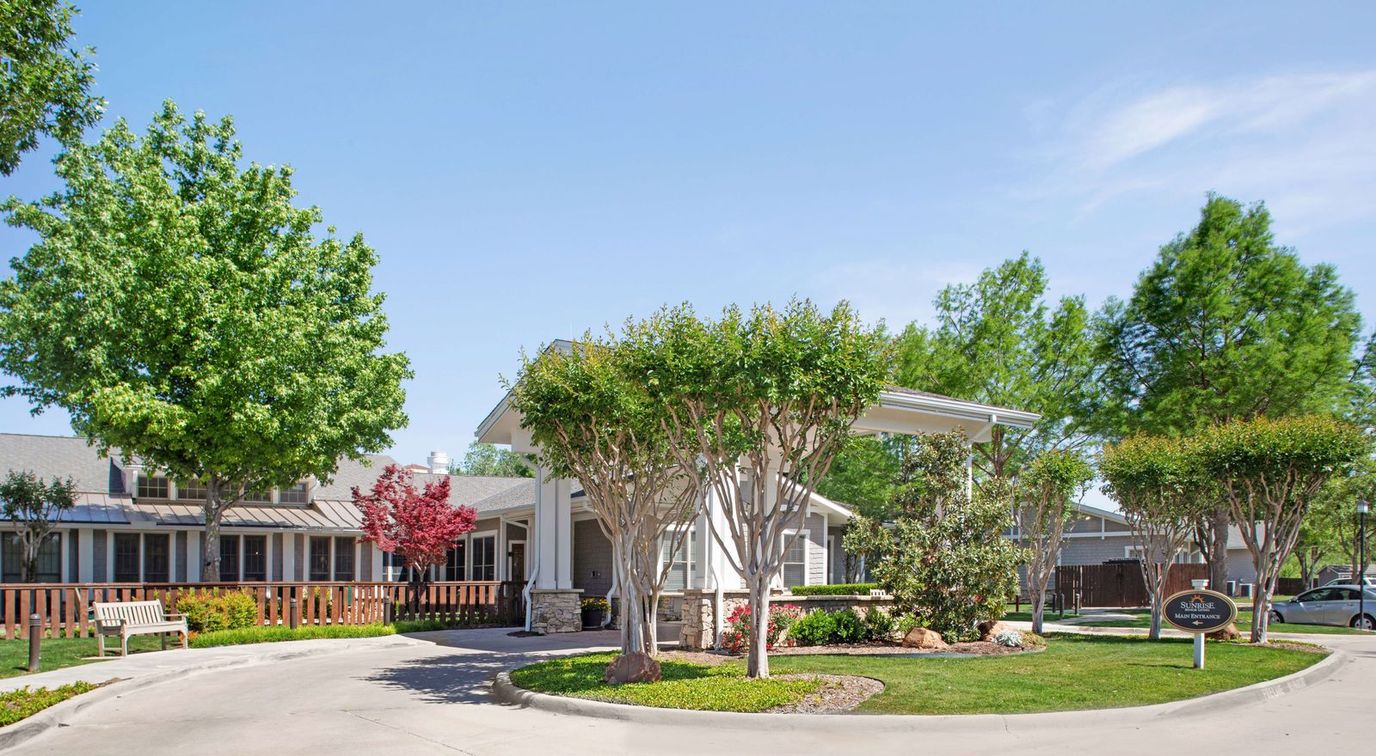
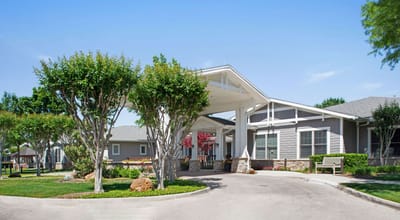
Building Type: Single-story

Transportation services icon

Transportation Services

Fitness and recreation icon

Fitness and Recreation

Who this home usually serves

TYPE OF STAY

Primarily short stays

Residents typically stay for brief periods, with frequent admissions and discharges throughout the year.

Living Spaces & Floor Plans for Sunrise of Fort Worth

Sunrise Of Fort Worth P3
Sunrise Of Fort Worth P2
Sunrise Of Fort Worth P1

Places of interest near Sunrise of Fort Worth

Address 9.6 miles from city center Info Estimated distance in miles from Fort Worth's city center to Sunrise of Fort Worth's address, calculated via Google Maps. — 0.23 miles to nearest hospital (Texas Health Harris Methodist Hospital Southwest Fort Worth)

Calculate Travel Distance to Sunrise of Fort Worth

Add your location

Address

Financial Assistance for
Nursing Home in Texas

Sunrise of Fort Worth is located in Fort Worth, Texas.
Here are the financial assistance programs available to residents in Texas.

Get Financial aid guidance

Community Care for the Aged and Disabled (CCAD)

TX Medicaid CCAD

Age 65+ or disabled
General Texas resident, Medicaid-eligible, care need (not always nursing home level).
Income Limits (2025) ~$2,829/month 300% FBR, individual
Asset Limits $2,000 (individual), $3,000 (couple).
TX

Large state; rural access challenges.

Benefits
Personal care (5-7 hours/day) Respite (240 hours/year) Adult day care (~$60/day) Home aides

Texas Community Care Services

TX CCS

Age 60+
General Texas resident, at risk of decline.
Income Limits ~$2,000/month individual, varies
Asset Limits $5,000 individual
TX

Limited funding; high demand in urban areas.

Benefits
In-home care (3-5 hours/week) Respite (up to 10 days/year) Transportation (~5 trips/month)

Area Agency on Aging (AAA) Services

Texas AAA Services

Age 60+
General TX resident; no income/asset limits.
Income Limits (2025) None; donations encouraged.
Asset Limits Not assessed.
TX

28 AAAs; includes Meals on Wheels in some areas.

Benefits
Meals (~$5-$7/meal) Transportation Homemaker services (~4 hours/week) Respite (~5 days/year) Legal aid

Medicare Savings Program (MSP)

Texas Medicare Savings Program

Age 65+ or disabled
General TX resident, Medicare Part A/B.
Income Limits (2025) ~$2,510/month (QMB), ~$3,380/month (SLMB), ~$3,598/month (QI)—individual.
Asset Limits $9,430 (individual), $14,130 (couple).
TX

Includes Extra Help for Part D; no waitlist.

Benefits
Covers Part B premiums ($174.70/month) Deductibles ($240/year) Copays (~20%)

Family Caregiver Support Program (FCSP)

Texas Family Caregiver Support Program

Age
General Caregivers of 60+ needing care or 55+ caregivers of others; TX resident; 2+ ADLs.
Income Limits (2025) No strict cap; prioritizes low-income ~$24,980/year
Asset Limits Not assessed.
TX

High rural demand; includes grandparent caregivers.

Benefits
Respite (4-6 hours/week or 5 days/year) Adult day care ($60/day) Training Supplies (~$500/year)

VA Aid and Attendance (A&A) and Housebound Benefits

Texas VA Aid and Attendance/Housebound

Age 65+ or disabled veteran/spouse
General TX resident, wartime service, ADL help (A&A) or homebound.
Income Limits (2025) Net income < ~$1,984/month (veteran with dependent, A&A); pension offsets income.
Asset Limits ~$155,356 net worth
TX

High veteran population; supports rural/urban needs.

Benefits
Cash (~$1,433-$2,642/month veteran, ~$951-$1,318 spouse) for care costs

Property Tax Exemption for Seniors

Texas Senior Property Tax Exemption

Age 65+
General TX resident, homeowner (homestead).
Income Limits (2025) None; tax-based eligibility.
Asset Limits Not assessed.
TX

$25,000+ exemption; optional freeze in some counties; saves ~$500-$1,000/year.

Benefits
Tax exemption or freeze (~$500-$1,000/year savings)

Senior Farmers’ Market Nutrition Program (SFMNP)

Texas SFMNP

Age 60+
General TX resident, low-income.
Income Limits (2025) ~$2,322/month 185% FPL
Asset Limits Not assessed.
TX

Vouchers (~$50/season); serves ~20,000 via 28 AAAs.

Benefits
Vouchers (~$50/season) for produce at farmers’ markets

More homes from the same operator

Operated by Sunrise

Frequently Asked Questions about Sunrise of Fort Worth

Who is the owner of Sunrise of Fort Worth?

The legal owner and operator of Sunrise of Fort Worth is Ms Fort Worth Sh Llc.

Is Sunrise of Fort Worth in a walkable area?

Sunrise of Fort Worth has a walk score of 53. Moderately walkable. Some errands can be accomplished on foot, with a mix of nearby amenities.

What is the license number of Sunrise of Fort Worth?

According to TX state health department records, Sunrise of Fort Worth's license number is 149829.

When does Sunrise of Fort Worth's license expire?

According to TX state health department records, Sunrise of Fort Worth's license expires on January 5, 2026.

Who is the administrator of Sunrise of Fort Worth?

Mellisa Daley is the administrator of Sunrise of Fort Worth.

How many beds does Sunrise of Fort Worth have?

Sunrise of Fort Worth has 105 beds.

Has Sunrise of Fort Worth had any recent deficiencies or citations?

Sunrise of Fort Worth has had 14 recently reported deficiencies.

Guides for Better Senior Living

Care Cost Calculator: See Prices in Your Area

Nursing Home Data Explorer

Don’t Wait Too Long: 7 Red Flag Signs Your Parent Needs Assisted Living Now

The True Cost of Assisted Living in 2025 – And How Families Are Paying For It

Understanding Senior Living Costs: Pricing Models, Discounts & Financial Assistance

Explore Open Rooms
1 Contact details
2 What type of senior care service are you looking for?
3 What budget do you have in mind for senior care?
4 How soon do you need to find care?
5 Additional details

Thank you for your interest!

Our team will be in touch shortly to help with next steps.